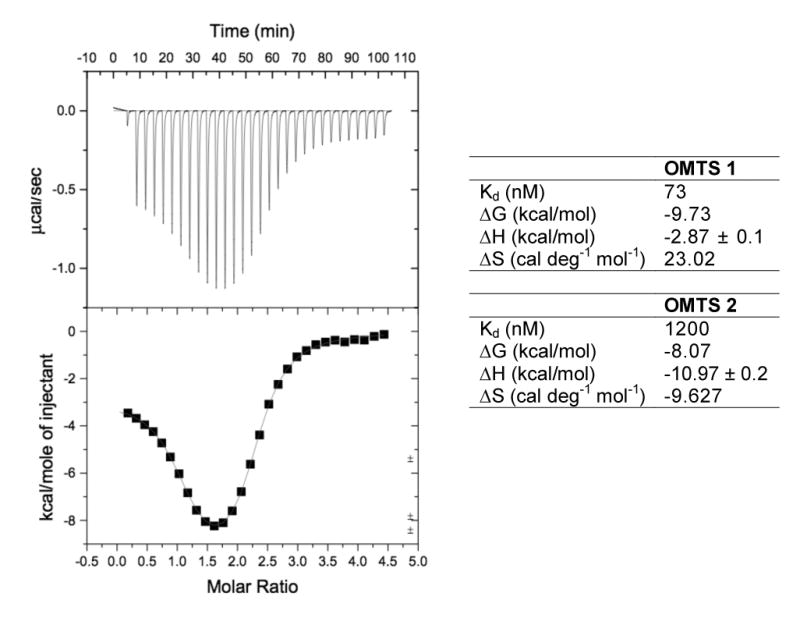
Figure 8. Binding characteristics of OMTS.

ITC data for the binding of OMTS to PtpB and fitting to a two binding site model. The biphasic fitting curve shows entropy-driven binding of the proximal, and enthalpy-driven binding of the distal OMTS. Thermodynamic parameters for the proximal (OMTS 1) and distal (OMTS 2) inhibitor at 25°C are given.
