

Abstract
While diabetic patients often present with comorbid depression, the underlying mechanisms linking diabetes and depression are unknown. The Wistar Kyoto (WKY) rat is a well-known animal model of depression and stress hyper-reactivity. In addition, the WKY rat is glucose intolerant and likely harbors diabetes susceptibility alleles. We conducted a quantitative trait loci (QTL) analysis in the segregating F2 population of a WKY × Fischer 344 (F344) inter-cross. We have previously published QTL analyses for depressive behavior and hypothalamic-pituitary-adrenal (HPA) activity in this cross. In the current study, we report results from the QTL analysis for multiple metabolic phenotypes, including fasting glucose, post-restraint stress glucose, post-prandial glucose and insulin, and body weight. We identified multiple QTLs for each trait and many of the QTLs overlap with those previously identified using inbred models of type 2 diabetes (T2D). Significant correlations were found between metabolic traits and HPA axis measures and several metabolic loci overlap with loci previously identified for HPA activity in this F2 intercross, suggesting the genetic mechanisms underlying these traits may be similar. These results indicate that WKY rats harbor diabetes susceptibility alleles and suggest that this strain may be useful for dissecting the underlying genetic mechanisms linking diabetes, HPA activity and depression.
Keywords: HPA axis, QTL analysis, glucose tolerance, Wistar Kyoto rat
Introduction
There is a high prevalence of depression in patients with diabetes. Approximately one third of diabetic patients also exhibit comorbid depression, and the odds of developing depression double in diabetics over the general population (Anderson et al. 2001). A recent study also found that depression is associated with a 60% increase risk of type 2 diabetes (Mezuk et al. 2008). It has been hypothesized that the causative link between depression and diabetes may be altered function of the hypothalamic-pituitary-adrenal (HPA) axis (Golden 2007; Reagan et al. 2008). Both diabetics (Bruehl et al. 2007; Chan et al. 2003) and those with depression (Gold et al. 1996; Pariante and Lightman 2008) can exhibit increased plasma cortisol, as well as increased sensitivity to acute and chronic stress. Furthermore, animal models of diabetes exhibit similar HPA abnormalities including increased basal plasma adrenocorticotropin hormone (ACTH) and corticosterone levels, and these abnormalities can be reversed with insulin treatment (Chan et al. 2002). It is also known that a chronic increase in glucocorticoids can lead to insulin resistance (McMahon et al. 1988). In addition, the neurological changes caused by chronic stress are similar to the changes found in animal models of diabetes (dendritic remodeling in the hippocampus, synaptic reorganization and neuronal apoptosis), and many of these changes can be reversed with insulin replacement (Biessels et al. 1996; Reagan 2002)
The Wistar Kyoto (WKY) rat is a well-studied rat model of depression that also exhibits HPA axis dysfunction. The HPA abnormalities in the WKY rat include increased ACTH in response to stress (Redei et al. 1994; Rittenhouse et al. 2002), and altered levels of the 24-hour diurnal secretion pattern of plasma ACTH and corticosterone (Solberg et al. 2001). WKY rats also exhibit a sexually dimorphic response to stress, with males exhibiting decreased corticosterone and females exhibiting increased corticosterone responses to stress relative to F344 rats (Solberg et al. 2003). The WKY rat also exhibits hyperglycemia and hyperinsulinemia in response to a glucose challenge (Katayama et al. 1997). In fact, unlike the Zucker fatty rat, when the fa gene is mutated in the WKY rat, these animals not only become obese, but also develop diabetes (Ikeda et al. 1981; Zucker and Antoniades 1972), indicating that WKY rats likely harbor diabetes susceptibility alleles. It is not known if the increased HPA activity in this strain is contributing to their hyperglycemia and insulin resistance, or if there is a causal relationship between the hyperglycemia and the depressive behavior.
We have previously mapped genetic loci that contribute to depressive behavior in the forced swim test (Solberg et al. 2004) and altered HPA function, including basal and stress corticosterone and adrenal weight (Solberg et al. 2006) in a WKY × Fischer 344 (F344) F2 intercross. The following study was undertaken to determine the nature of the relationship between metabolic dysfunction, HPA abnormalities and depressive behavior in the WKY rat and to determine if the underlying genetic basis of metabolic dysfunction of the WKY rat is similar to the previously published genetic basis of HPA dysfunction and depressive behavior in this animal model.
Materials and Methods
Animals
A total of 28 male and 20 female WKY/NHsd and F344/NHsd rats were obtained from Harlan Sprague Dawley (Indianapolis, IN) at approximately 10 weeks of age. For simplicity these rats will be referred to as WKY and F344 in the rest of the manuscript. As previously described, parental WKY and F344 animals were bred reciprocally to generate 121 F1 animals (Solberg et al. 2004; Solberg et al. 2006). Sister-brother breeding of both lineages (WKY and F344 mother) of F1s generated 486 F2 gerenation animals. Animals were raised in a 14:10 light:dark cycle (lights on at 7:00 and off at 21:00, Central Standard Time) and kept under constant ambient temperature (21 ± 1 degrees C) with food and water available ad libitum.
Experimental Protocol
The experimental protocol was approved by the IACUC committee at Northwestern University. All procedures were conducted in both male and female WKY and F344 inbreds as well as male and female F2 animals, with the exception of weight at week 11, which was only done in the F2 generation. At 15 weeks of age, animals were placed in a restraint tube for 30 minutes, after which time blood was collected on ice for determination of post-restraint stress glucose levels. Two weeks later, a glucose tolerance test was conducted as follows. Prior to the glucose tolerance test, animals were fasted overnight for approximately 16 hours. In the morning, animals were weighed and allowed to rest undisturbed for two hours, after which time a blood sample was collected for determination basal glucose levels. Animals were then injected i.p. with 2g/kg glucose. One hour after the injection, animals were sacrificed by decapitation and trunk blood was collected on ice. Blood was spun at 4 degree C and serum was collected and stored at -80 C for subsequent determination of glucose and insulin content.
Glucose Assay
Glucose content was analyzed by the glucose oxidase method, using the colorimetric assay from Stanbio Laboratories, San Antonio, Texas, according to the manufacturer's protocol.
Insulin Assay
Insulin levels were determined by double antibody radioimmunoassay with 125-I human insulin from Eli Lilly and guinea pig anti-human insulin antibody produced at the Endocrinology Laboratory, University of Chicago, with a rat insulin standard. The lower limit of detection was 1uU/ml, with an inter-assay variability of 16% and an intra-assay variability of 13%.
Genotyping
The genotyping protocol has been previously described (Solberg et al. 2004; Solberg et al. 2006). Briefly, 108 polymorphic SSLP markers were typed on genomic DNA. Markers were spaced an average of 16 cM apart (with a range from 2-27 cM). PCR products of markers with inter-strain differences under 12bp were separated on 6% polyacrylamide gels, whereas those over 12bp were separated on agarose gels.
Genome Scan Analysis
Prior to genetic analysis, data for all phenotypic traits were log-transformed to minimize skew. We carried out standard genome scans using the pseudomarker (release 1.03) software package (Sen and Churchill 2001); http://www.jax.org/staff/churchill/labsite/software/. We included an additive covariate representing all combinations of sex and lineage (WKY or F344 grandfather) to account for sex and lineage specific differences in the phenotypes. In addition, we carried out scans for QTL-by-sex and QTL-by-lineage effects, as previously described (Solberg et al. 2004). Significance thresholds were established using permutation analysis (Churchill and Doerge 1994). Significant QTL were those that exceeded the 0.05 genome-wide adjusted threshold and suggestive QTL exceeded or approached the 0.63 genome-wide adjusted threshold (Lander and Kruglyak 1995).
We used a pairwise search strategy (Sen and Churchill 2001) to examine all possible locus pairs to search for epistatic interactions between QTL. We included sex and lineage as additive covariates in the pairwise scans. Significance thresholds for the pairwise scans were established by analysis of 100 permutated data sets. Due to the limited number of permutations and variation in thresholds across traits, we rounded the estimated genome wide significance thresholds upward and use uniform values of 11 (full LOD score) and 5 (interaction LOD score) for all traits (Sen and Churchill 2001).
All loci and interactions that were detected by genome scans were entered into a multiple regression model, as previously described (Solberg et al. 2004; Solberg et al. 2006). This multiple regression analysis was carried out using R/qtl software (Broman et al. 2003); http://www.biostat.jhsph.edu/∼kbroman/software. Briefly, for each trait separately, individual terms were dropped in a backward elimination search until all terms remaining in the model were significant at the p<0.05 or the p<0.01 level. Main effects that were included in significant interaction were retained in the model. The result is a list of QTLs with estimated effects that are adjusted for all other QTLs in the model.
Statistical Analysis
A one-way ANOVA was used to determine statistical significance of strain (WKY or F344) in both males and females, separately, in the parent generation. A 2-way ANOVA was also used to determine effect of sex (male or female) and lineage (WKY or F344 grandfather) in the F2 generation. Statistical comparisons between groups are reported as ANOVA F-statistics using conventional methods (eg, F1,43=5.9, p<0.05, where 1,43 are the degrees of freedom, 5.9 is the F-value and p<0.05 is the significance level).
Results
Metabolic measurements in parent inbreds: WKY and F344
Fasting glucose levels were significantly higher in both male (F1, 43 = 5.9, p < 0.05) and female (F1, 23 = 4.1, p < 0.05) WKY rats relative to F344 males and females, corroborating previous findings of increased fasting glucose in WKY relative to Wistar rats (Katayama et al. 1997) (see Table 1). WKY rats also exhibited significantly higher glucose levels after restraint stress relative to F344 rats. This difference was seen in both males (F1, 39 = 27.38, p < 0.001) and females (F1, 43 = 64.7, p < 0.001). In addition, glucose levels measured 60 minutes after a glucose challenge were significantly higher in both male (F1, 29 = 49.0, p < 0.001) and female (F1, 19 = 19.5, p < 0.001) WKY rats relative to male and female F344 rats, confirming glucose intolerance in WKY rats (Katayama et al. 1997). WKY males exhibited increased plasma insulin levels 60 minute after a glucose challenge relative to F344 males (F1, 28 = 4.5, p < 0.05; see table 1), while no significant difference was seen in insulin levels between WKY and F344 females. No significant difference was found in body weight between WKY and F344 inbreds at 17 weeks of age.
Table 1. Mean ± SE for metabolic measures in parent inbreds: WKY and F344.
| Strain | Fasting glucose (mg/dL) | Post-restraint stress glucose (mg/dL) | Glucose post-challenge (mg/dL) | Insulin post-challenge (uU/ml) | Body Weight (17 wks) (g) |
|---|---|---|---|---|---|
| WKY male | 98.1 ± 2.5 | 153.5 ± 6.3 | 173.8 ± 5.5 | 64.1 ± 9.7 | 352.6 ± 4.5 |
| F344 male | 88.0 ± 3.1* | 117.7 ± 2.7** | 131.6 ± 3.0** | 43.0 ± 4.6* | 345 ± 5.4 |
| WKY female | 84.3 ± 6.9 | 151.6 ± 4.7 | 163.7 ± 7.2 | 20.0 ± 2.5 | 230 ± 3.2 |
| F344 female | 65.1 ± 3.6* | 102.2 ± 4.0** | 121.7 ± 5.1** | 17.0 ± 2.4 | 221 ± 3.8 |
number of animals in each group ranges from 10-25, depending on phenotype significant difference between strains of same sex
p < 0.05
p < 0.01
Mapping loci underlying metabolic measures in a WKY × F344 F2 intercross
Fasting Glucose
As in the parent generation, there is a significant main effect of sex (F1, 478 = 72.0, p < 0.0001) in the F2 generation of a WKY × F344 cross, with females exhibiting significantly lower fasting glucose than males. No effect is seen based on lineage. We identified one significant locus on chromosome 8 and three suggestive loci on chromosomes 1, 5, and 12 (see Figure 1 and Table 2). These loci have been named Gluco41-44 with the following Rat Genome Database (RGD) identification numbers: 2303591, 2303574, 2303564 and 2303569. Loci on chromosomes 1, 8 and 5 were retained in the regression model. No further loci were identified using sex or lineage as co-variates in the model. The WKY locus increased fasting glucose levels at Gluco42 and 43 (loci on chromosomes 5 and 8) and decreased glucose at Gluco 41 and 44 (chromosomes 1 and 12; data not shown). No pairwise interactions were identified.
Figure 1.
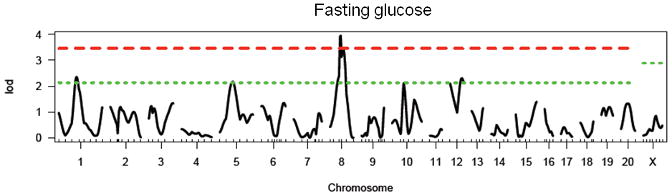
LOD plot for genome scan for log(fasting glucose). Chromosome location is on the x-axis and LOD score is on the y-axis. Top dashed line indicates highly significant threshold (95%) and bottom dashed line indicates suggestive threshold (37%).
Table 2. Summary of results for single-marker genome scans for fasting glucose.
| Chromosome | Peak Marker (position in cM) | LOD | Locus Name | Homology |
|---|---|---|---|---|
| 1 | D1Rat39 (56) | 2.35* | Gluco41 | Niddm23 (Wei et al. 1999) |
| 5 | D5Rat14 (43) | 2.17* | Gluco42 | Niddm25 (Kose et al. 2002; Wei et al. 1999) |
| 8 | D8Rat43 (40) | 3.95** | Gluco43 | |
| 12 | D12Rat52 (38) | 2.31* | Gluco44 | Niddm27 (Wei et al. 1999) |
suggestive threshold (37%) is 2.09
significant threshold (95%) is 3.45
Glucose post-restraint stress
In the F2 generation, there is a significant main effect of sex in the F2 generation (F1, 479 = 37.7, p < 0.0001), with females exhibiting significantly lower post-restraint stress glucose than males. There is no effect of lineage in the F2 generation. We identified two significant loci on chromosomes 1 and 5, and four suggestive loci on chromosomes 3, 8, 17 and 20 (see Figure 2 and Table 3). These loci have been named Gluco45-50 with the following RGD identification numbers: 2303576, 2303593, 2303577, 2303570, 2303580, and 2303578. All loci were retained in the regression model. The WKY locus increased post-restraint stress glucose levels at all loci except Gluco46 (chromosome 3; data not shown). No pairwise interactions were identified.
Figure 2.
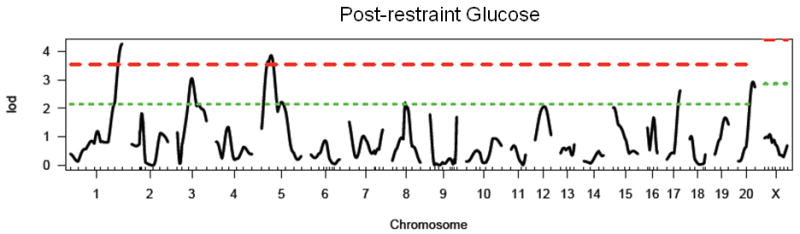
LOD plot for genome scan for log(post-restraint glucose). Chromosome location is on the x-axis and LOD score is on the y-axis. Top dashed line indicates highly significant threshold (95%) and bottom dashed line indicates suggestive threshold (37%).
Table 3. Summary of results for single-marker genome scans for post-restraint stress glucose.
| Chromosome | Peak Marker (position in cM) | LOD | Locus Name | Homology/Relevant Overlapping Loci |
|---|---|---|---|---|
| 1 | D1Rat145 (136) | 4.27** | Gluco45 | |
| 3 | D3Rat181 (46) | 3.05* | Gluco46 | pig chr. 1 (Desautes et al. 2002); Srcrt-2 (Solberg et al. 2006); Climb-4 (Solberg et al. 2004) |
| 5 | D5Rat131 (23) | 3.86** | Gluco47 | Srcrtb-2 (Solberg et al. 2006) |
| 8 | D8Rat31 (42) | 2.20* | Gluco48 | |
| 17 | D17Rat46 (42) | 2.63* | Gluco49 | Cdc123 (Zeggini et al. 2008) |
| 20 | D20Rat29 (42) | 2.93* | Gluco50 |
suggestive threshold (37%) is 2.13
significant threshold (95%) is 3.52
Post-prandial glucose
In the F2 generation, there is a significant main effect of sex (F1, 482 = 87.4, p < 0.0001), again with females exhibiting significantly lower levels of glucose than males. There is no effect of lineage in the F2 generation. We identified one significant locus on chromosome 1, and four suggestive loci on chromosomes 5, 7, 9 and 18 (see Figure 3 and Table 4). These loci have been named Gluco51-55 with the following RDG identification numbers: 2030592, 2303586, 2030582, 2303559, and 2303584. Gluco54 (chromosome 9) interacted significantly with sex, with the WKY locus decreasing glucose levels only in females (see Figure 4). For all other loci, the WKY allele increased glucose levels (data not shown). All loci, except for Gluco52 (chromosome 5), were retained in the regression model. No pairwise interactions were identified.
Figure 3.
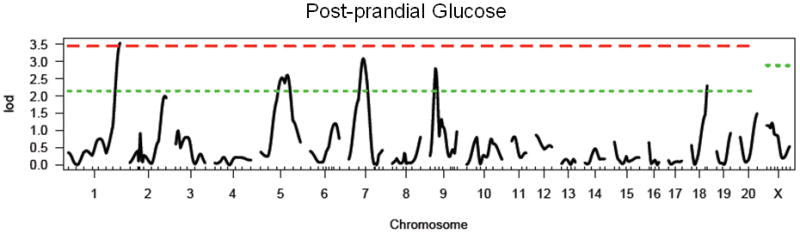
LOD plot for genome scan for log(postprandial glucose). Chromosome location is on the x-axis and LOD score is on the y-axis. Top dashed line indicates highly significant threshold (95%) and bottom dashed line indicates suggestive threshold (37%).
Table 4. Summary of results for single marker genome scans for post-prandial glucose.
| Chromosome | Peak Marker (position in cM) | LOD | Locus Name | Homology/Relevant Overlapping QTL | Genes identified in human GWAS |
|---|---|---|---|---|---|
| 1 | D1Rat145 (136) | 3.54** | Gluco51 | Niddm1, 7, 16, 24, 35, 44, 64, 65, 66 (Chung et al. 1997; Fakhrai-Rad et al. 2000; Galli et al. 1999; Galli et al. 1996; Gauguier et al. 1996; Granhall et al. 2006; Kanemoto et al. 1998; Lin et al. 2001; Wei et al. 1999) | TCF7L2, HHEX-IDE (Lango et al. 2008) |
| 5 | D5Rat157 (70) | 2.61* | Gluco52 | Niddm30 (Sugiura et al. 1999); | CDKN2A/2B (Lango et al. 2008) |
| 7 | D7Rat24 (46) | 3.09* | Gluco53 | Niddm19 (Kose et al. 2002; Wei et al. 1999); Sradr-5 (Solberg et al. 2006) | SLC30A8, TSPAN8/LGR5 (Lango et al. 2008) |
| 9 | D9Rat130 (20) | 2.81* | Gluco54 | Niddm26 (Wei et al. 1999); Imm-5 (Solberg et al. 2004) | |
| 18 | D18Rat121 (44) | 2.31* | Gluco55 |
suggestive threshold (37%) is 2.13
significant threshold (95%) is 3.43
Figure 4.
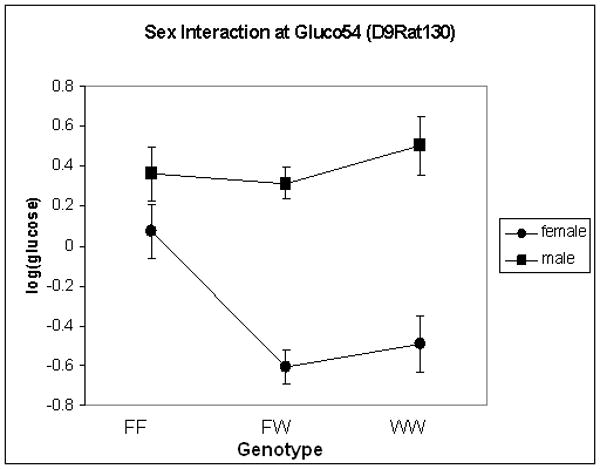
Effect plot for post-prandial glucose on chromosome 9 (Gluco54), showing effect of sex. X-axis represents genotype with F and W representing F344 and WKY alleles, respectively. Y-axis is log(post-prandial glucose levels).
Post-prandial insulin
There is a significant main effect of sex in the F2 generation (F1, 476 = 269.2, p < 0.0001), with females exhibiting significantly lower levels of insulin than males in the F2 generation. There is also a significant effect of lineage (F1, 476 = 17.0, p < 0.0001), with animals from a WKY grandfather exhibiting increased levels of insulin relative to those from a F344 grandfather. We identified two significant loci on chromosomes 1 and 12 and one suggestive locus on chromosome 8 (see Figure 5 and Table 5). These loci have been named Insul12-14 and have been given the following RGD identification numbers: 2303579, 2303572, and 2303575. Insul13 (chromosome 8) was not retained in the regression model. No further loci were identified when sex or lineage were added as covariates. The WKY locus increased insulin levels at both significant loci. No pairwise interactions were found.
Figure 5.
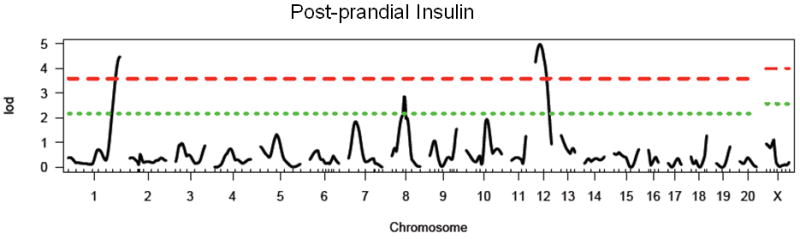
LOD plot for genome scan for log(postprandial insulin). Chromosome location is on the x-axis and LOD score is on the y-axis. Top dashed line indicates highly significant threshold (95%) and bottom dashed line indicates suggestive threshold (37%).
Table 5. Summary of results for single marker genome scans for post-prandial insulin.
| Chromosome | Peak Marker (position in cM) | LOD | Locus Name | Homology |
|---|---|---|---|---|
| 1 | D1Rat145 (136) | 4.47** | Insulin12 | Niddm35 (Galli et al. 1999; Lin et al. 2001) |
| 8 | D8Rat43 (40) | 2.86* | Insulin13 | Niddm11 (Gauguier et al. 1996) |
| 12 | D12Rat69(18) | 4.98** | Insulin14 |
suggestive threshold (37%) is 2.15
significant threshold (95%) is 3.58
Body Weight
There is a significant main effect of sex when animals were both 11 (F1, 457 = 437, p < 0.0001) and 17 (F1, 484 = 463, p < 0.0001) weeks of age, with females exhibiting significantly lower body weight than males. At 17 weeks of age, there is also a significant effect of lineage (F1, 484 = 10.9, p < 0.01). At 11 weeks of age, we identified three significant loci on chromosomes 1, 4, and 18, and three suggestive loci on chromosomes 10, 12 and 16 (see Figure 6A and Table 6). At 17 weeks of age, we identified three significant loci on chromosomes 1, 4, and 13, and four suggestive loci on chromosomes 12, 16, 17 and 18 (see Figure 6B and Table 6). At week 17 we also identified 1 pair of interacting loci between chromosome 13 at 16 cM and chromosome 20 at 44 cM. No further loci were identified when sex or lineage were added as covariates. Many, but not all of the loci were found in common between body weight at week 11 and week 17. The body weight loci have been named Bw85-93 and have been given the following RGD identification numbers: 2303581, 2303585, 2303589, 2303568, 2303563, 2303566, 2303561, 2303571, and 2303587. At week 17, all loci were retained in the regression model. At week 11, all significant loci as well as the suggestive locus on chromosome 10 were retained in the regression model.
Figure 6.
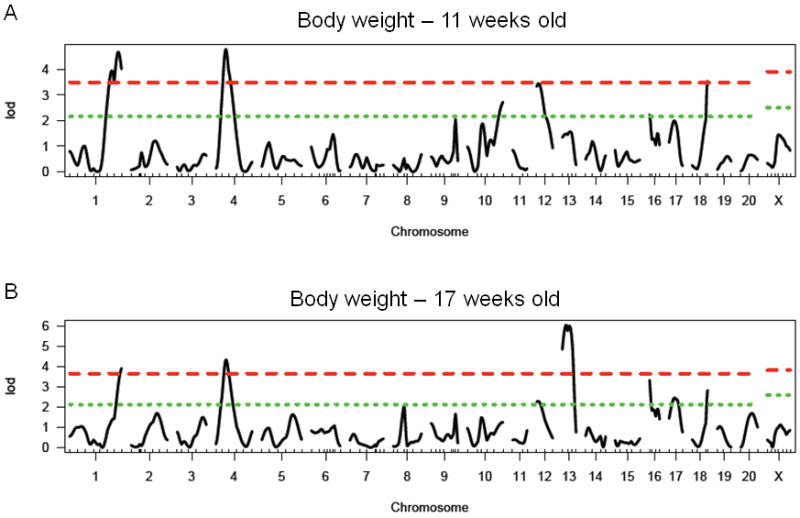
LOD plot for genome scan for A) log(body weight at 11 weeks of age) and B log(body weight at 17 weeks of age). Chromosome location is on the x-axis and LOD score is on the y-axis. Top dashed line indicates highly significant threshold (95%) and bottom dashed line indicates suggestive threshold (37%).
Table 6. Summary of results for single marker genome scans for body weight.
| Chromosome | Peak Marker (position in cM) | LOD | BW age | Locus Name | Homology | Genes identified in human GWAS |
|---|---|---|---|---|---|---|
| 1 | D1Rat145 (136) | 4.68**, 3.92** | 11, 17 | Bw85 | Bw80, Niddm45, 13, 58, 63 (Granhall et al. 2006; Kloting et al. 2001; Redina et al. 2006; Watanabe et al. 1999; Watanabe et al. 2001) | |
| 4 | D4Rat115(28) | 4.78**, 4.33** | 11, 17 | Bw86 | ||
| 10 | D10Rat134 (93) | 2.72* | 11 | Bw87 | Bw57 (Inomata et al. 2005) | |
| 12 | D12Rat89 (4) | 3.44*, 2.28* | 11, 17 | Bw88 | Bw15 (Moreno et al. 2003), Niddm5 (Chung et al. 1997) | |
| 13 | D13Rat26 (22) | 6.04** | 17 | Bw89 | ||
| 16 | D16Arb5 (6) | 2.23*, 3.32* | 11, 17 | Bw90 | ||
| 17 | D17Rat15 (21) | 2.45* | 17 | Bw91 | Bw32 (Bilusic et al. 2004), Bw67 (Seda et al. 2005) | |
| 18 | D18Rat121 (44) | 3.54**, 2.82* | 11, 17 | Bw92 | MCR4 (Loos et al. 2008) | |
| 13:20 | D13Rat26 (16): D20Rat29 (44) | 13.54 | 17 | Bw89: Bw93 |
Significant thresholds for BW at 11 weeks at *37%: 2.15, **95%: 3.46
Significant thresholds for BW at 17 weeks at *37%: 2.11, **95%: 3.60
Correlations between metabolic measures, HPA axis measures, and depressive behavior in the F2 generation
We calculated Pearson's correlation coefficient between three separate measures of HPA axis function previously reported (basal corticosterone, stress corticosterone and adrenal gland weight) (Solberg et al. 2003; Solberg et al. 2006), depressive behavior in the forced swim test (Solberg et al. 2004) and all of the currently reported metabolic measures in the F2 generation. To avoid spurious correlations based on sex differences, correlation coefficients were calculated separately for males and females. A significant positive correlation was found in both males and females between post-restraint stress glucose and basal and stress corticosterone (see Table 7). In addition, post-prandial glucose and post-restraint stress glucose were positively correlated and post-prandial glucose and insulin were positively correlated. No correlations were noted between HPA axis measures and post-prandial glucose or insulin levels. Finally, a negative correlation was found between post-prandial glucose and climbing only in females.
Table 7. Correlations between HPA, FST and metabolic measures in WKY × F344 F2 generation.
| Males | FST: Imm |
FST: Climb |
Basal CORT |
Stress CORT |
Adr. Wt. |
Fasting Glucose |
Stress Glucose |
PP Glucose |
PP Insulin |
Body Wt. |
|---|---|---|---|---|---|---|---|---|---|---|
| FST: Imm | 1 | |||||||||
| FST: Climb | -.348** | 1 | ||||||||
| Basal CORT | .006 | -.086 | 1 | |||||||
| Stress CORT | -.029 | .117 | .556** | 1 | ||||||
| Adr. Wt. | .132 | .110 | .275** | .275** | 1 | |||||
| Fasting Glucose | -.091 | .071 | .076 | .038 | .015 | 1 | ||||
| Stress Glucose | .001 | -.078 | .154ˆ | .200* | .013 | .082 | 1 | |||
| PP Glucose | .088 | -.029 | .004 | -.007 | .036 | .050 | .204* | 1 | ||
| PP Insulin | .027 | .068 | -.117 | -.022 | -.108 | .080 | .083 | .282** | 1 | |
| Body Wt. | -.024 | -.192* | -.057 | -.080 | -.586 | .103 | .198* | -.027 | .134 | 1 |
| Females | FST: Imm | FST: Climb | Basal CORT | Stress CORT | Adr. Wt. | Fasting Glucose | Stress Glucose | PP Glucose | PP Insulin | Body Wt. |
| FST: Imm | 1 | |||||||||
| FST: Climb | -.516** | 1 | ||||||||
| Basal CORT | -.096 | .055 | 1 | |||||||
| Stress CORT | -.138 | .132 | .383** | 1 | ||||||
| Adr. Wt. | -.054 | .106 | -.011 | .118 | 1 | |||||
| Fasting Glucose | -.114 | -.007 | -.091 | .070 | -.033 | 1 | ||||
| Stress glucose | -.103 | -.081 | .243** | .300** | .042 | .131 | 1 | |||
| PP Glucose | .107 | -.168ˆ | -.017 | -.057 | -.050 | -.038 | .221* | 1 | ||
| PP Insulin | -.044 | .039 | -.078 | -.070 | -.085 | .039 | .039 | .391** | 1 | |
| Body Wt. | -.127 | .040 | -.048 | .060 | -.210* | .017 | .066 | .037 | .045 | 1 |
Pearson correlation coefficient r is listed above. Abbreviations: FST: Forced Swim Test, Imm: Immobility, Climb: Climbing, CORT: Corticosterone, Adr. Wt.: Adrenal Weight, PP: post-prandial
p < 0.05
p < 0.01
p < 0.001
When two or more traits mapped to a single locus (see Relevant Overlapping Loci in Tables 3 and 4; Gluco46, 47, 53, 54), we further went on to calculate Pearson's correlation coefficient after dividing animals into subgroups based genotype at that locus. Gluco46 maps to post-restraint stress glucose in the current study and also overlaps stress corticosterone locus Srcrt-2 (Solberg et al. 2006) and climbing locus, Climb-4 (Solberg et al. 2004). After grouping animals based on genotype at this locus, significant correlations were found in some groups, but not others (see Table 8). Post-restraint stress glucose and stress corticosterone were significantly correlated in male and female F344 homozgotes (r = 0.297 and 0.289, respectively, p < 0.05) as well as female heterozygotes (r = 0.338, p < 0.001). Interestingly, the F344 allele at this locus results in increased stress glucose (suggesting transgressive segregation) and increased stress corticosterone (Solberg et al. 2006) in the F2 generation. Post-restraint stress glucose and climbing were significantly negatively correlated only in heterozygote females (r = -0.215, p < 0.01), while stress corticosterone and climbing were significantly correlated in heterozygote males (r = 0.254, p < 0.01) and F344 homozygote females (r = 0.447, p < 0.01). These results are particularly interesting, as climbing was not previously correlated with either post-restraint stress glucose or corticosterone.
Table 8. Correlations between post-restraint stress glucose, stress corticosterone and climbing in the FST based on genotype at D3Rat181.
| Post-restraint stress glucose and Stress corticosterone | |||
| FF | FW | WW | |
| Male | 0.297ˆ | 0.041 | 0.145 |
| Female | 0.289ˆ | 0.338** | 0.259 |
| Post-restraint stress glucose and FST Climbing | |||
| FF | FW | WW | |
| Male | -0.226 | -0.052 | 0.001 |
| Female | 0.088 | -0.215* | -0.019 |
| Stress corticosterone and FST Climbing | |||
| FF | FW | WW | |
| Male | -0.165 | 0.254* | 0.033 |
| Female | 0.447* | 0.025 | 0.040 |
FF represents homozygous for the F344 genotype, WW represents homozygous for the WKY genotype and FW represents heterozygotes
p < 0.05
p < 0.01
p < 0.001
Gluco47, a locus identified for post-restraint stress glucose, overlaps basal corticosterone locus, Srcrtb-2 (Solberg et al. 2006). When correlations were determined after sub-dividing based on genotype at this locus, significance was found only in heterozygous females (r=0.251, p < 0.05). Gluco53, a locus identified for post-prandial glucose in the current study, overlaps adrenal weight locus, Sradr-5 (Solberg et al. 2006). No significant correlations were found between these traits either before or after sub-dividing by genotype at this locus. Gluco54, a locus identified for post-prandial glucose, overlaps a locus previously identified for FST immobility, Imm-5 (Solberg et al. 2004). While no correlation was seen between these traits in the initial analysis, after dividing animals into subgroups based on genotype, a significant correlation was found in males that were homozygous for the F344 allele at this locus (r=0.366, p < 0.05). Interestingly, the F344 allele at this locus acts in a transgressive manner for both glucose and immobility, such that F344 homozygotes exhibit increased glucose and increased immobility, thus resembling the WKY rat.
Discussion
We identified multiple QTLs for several metabolic phenotypes using a WKY × F344 F2 intercross. WKY rats exhibit increased fasting glucose, increased glucose in response to restraint stress, and increased glucose and insulin in response to a glucose challenge relative to F344 rats, indicating altered glucose regulation in this strain, as previously reported (Ikeda et al. 1981; Katayama et al. 1997). The increased insulin in response to a glucose challenge suggests that WKY rats maintain appropriate functioning of pancreatic beta cells and infer a dysfunction at the level of the target tissues. Most of the loci that we identified overlap with loci previously identified for metabolic traits using F2 intercrosses of inbred models of T2D (Galli et al. 1996; Gauguier et al. 1996; Granhall et al. 2006; Kanemoto et al. 1998; Wei et al. 1999), thereby demonstrating that the WKY rat, a known model of depression and stress hyper-reactivity (Rittenhouse et al. 2002; Solberg et al. 2004), also harbors diabetes susceptibility alleles. In addition, significant correlations were found between HPA-related traits and metabolic traits, suggesting an interplay between stress and metabolism in this model.
As previously stated, many patients with diabetes also exhibit comorbid depression (Anderson et al. 2001), and it has been hypothesized that altered HPA function may link these disorders (Reagan et al. 2008). In the WKY × F344 F2 intercross, strong correlations were found between post-restraint stress glucose and basal and stress corticosterone, while no correlations were found between HPA axis measures and post-prandial glucose or insulin. These results indicate that while the HPA-mediated stress response affects glucose regulation, glucose regulation in response to a glucose challenge does not alter HPA activity. Importantly, post-restraint stress glucose loci on chromosomes 3 (Gluco46) and 5 (Gluco47) overlap with stress corticosterone locus, Srcrt-2, and basal corticosterone locus, Srcrtb-2, respectively (Solberg et al. 2006). When the correlation analysis was repeated after sub-dividing by genotype at these loci, we continue to see correlations, but only in certain sub-groups, indicating that these traits may be under similar genetic control at these loci. In contrast, while the chromosome 7 locus (Gluco53) for post-prandial glucose overlaps a previously identified adrenal weight locus, Sradr-5 (Solberg et al. 2006), no correlations were found between these traits after sub-dividing the group based on genotype. These results suggest that altered HPA activity in the WKY rat may indeed play a role in the glucose dysregulation of this strain, and offers the possibility that the underlying genetic mechanisms may be similar. Previous studies have demonstrated a surprising overlap between candidate genes identified for HPA activity with those identified for phenotypes involved in metabolic syndrome (see (Redei 2008), further emphasizing the significance of these findings.
A modest negative correlation was found between post-prandial glucose and climbing behavior in the forced swim test (FST) in females and the chromosome 9 locus (Gluco54) overlaps a locus previously identified for FST immobility (Imm-5) (Solberg et al. 2004). Interestingly, while there was no initial correlation between post-prandial glucose and immobility, after sub-dividing the group based on genotype at this locus, a significant correlation was found for males homozygous for the F344 locus. Interestingly, the F344 allele at this locus results in both increased glucose and increased immobility, resembling the phenotype of the WKY rat. It is also interesting to note that post-restraint stress glucose locus Gluco46 overlaps both stress corticosterone locus, Srcrt-2, and FST climbing locus, Climb-4 (Solberg et al. 2004). Again, while there was no initial correlation found between post-restraint glucose or stress corticosterone and climbing, significant correlations were found after dividing the group based on genotype at this locus (see Table 8). These partial correlations suggest that a common genetic element at this location may control all three phenotypes. Further studies are needed to confirm this hypothesis. These results allude to the possibility of similar genetic mechanisms underlying metabolic, stress, and behavioral phenotypes in the WKY × F344 intercross.
The locus on chromosome 1 was significant for almost every metabolic trait measured, suggesting this region plays an important role in metabolic regulation. Interestingly, this region has been extensively studied by multiple groups and has previously been identified as a locus for post-prandial glucose and insulin, body weight, fasting glucose as well as cholesterol and triglycerides in multiple F2 crosses using various inbred models of T2D (Chung et al. 1997; Fakhrai-Rad et al. 2000; Galli et al. 1999; Galli et al. 1996; Gauguier et al. 1996; Granhall et al. 2006; Kanemoto et al. 1998; Lin et al. 2001; Wei et al. 1999). Congenic animals developed using the Goto-Kakizaki (GK) rat, a non-obese model of T2D, demonstrate that this region can be split into areas that affect insulin secretion separately from those that affect insulin resistance (Fakhrai-Rad et al. 2000; Galli et al. 1999; Lin et al. 2001). These congenics were further fine-mapped into four separate QTLs, each less than 800 Kb, affecting body weight and post-prandial glucose levels (Granhall et al. 2006). Recent genome-wide association studies (GWAS) have identified close to 20 genes involved in human T2D, three of which reside within this region: Tcf7l2 and IDE/HHEX (Lango et al. 2008; Zeggini et al. 2008). While IDE has been identified as a candidate gene in the GK rat (Fakhrai-Rad et al. 2000), Tcf7l2 does not fall within the narrowed GK congenic region (Granhall et al. 2006). These data suggest many more genes are likely to be identified within this rich and complex region.
The chromosome 1 locus was not the only locus that had previously been identified using other rat models of T2D. In fact, almost every significant locus and several of the suggestive loci that we identified in this cross for post-prandial glucose or insulin levels have previously been identified using either the GK rat or the OLETF rat, animal models of T2D (see Tables 2-6). Furthermore, several genes identified in human GWAS for T2D lie within homologous regions of QTLs for post-prandial glucose in this cross (see table 4) (Lango et al. 2008). These data support the WKY rat as a model of glucose intolerance and demonstrate the utility of this inbred strain for dissecting genes involved in metabolic phenotypes.
Of particular interest is the number of body weight loci that we identified which overlap with body weight loci previously identified using inbred models of hypertension (Inomata et al. 2005; Kovacs et al. 1998; Moreno et al. 2003; Redina et al. 2006), metabolic syndrome (Bilusic et al. 2004; Kloting et al. 2001; Seda et al. 2005) and T2D (Chung et al. 1997; Granhall et al. 2006; Watanabe et al. 1999; Watanabe et al. 2001). Furthermore, MC4R, a gene recently identified in human GWAS for obesity (Loos et al. 2008), lies within the chromosome 18 QTL. While we identified an effect of lineage on body weight at week 17 in the F2 generation, none of the loci identified interacted with lineage. The majority of the body weight loci were identified at both time points (11 and 17 weeks of age). Interestingly, of few loci were only identified at either week 11 or week 17, suggesting a change in the genetic landscape in the maintenance of body weight over time, as previously found for progression of arthritis (Vingsbo-Lundberg et al. 1998) and other complex traits (Garrett et al. 2003), including diabetes (Nobrega et al. 2009). An alternative possibility is that the loci identified only at week 17 may represent loci that interact with environmental stress to affect body weight, as these animals have been through several stressful experimental procedures between week 11 and 17, as previously described (Solberg et al. 2003).
To our knowledge, this is the first study to investigate the genetic basis of the response of glucose to restraint stress, a measure of sympathetic activation, in the rat. Work using this phenotype has previously been conducted in pigs (Desautes et al. 2002) and one of our suggestive loci is located in the homologous regions of these pig QTLs (see Table 3; (Desautes et al. 2002)). In addition, Cdc123, which has recently been identified for T2D in human GWAS (Zeggini et al. 2008), lies within the homologous region of the rat chromosome 17 QTL. While a positive correlation is found between post-restraint stress glucose and basal and stress corticosterone in the F2 generation, WKY males exhibit decreased plasma corticosterone and increased glucose after stress relative to F344 males, raising the possibility that glucose availability in the WKY rat is hyper-responsive to glucocorticoids.
We have confirmed that the WKY rat is a rat model of glucose intolerance and have demonstrated that metabolic traits can be mapped to the genome using this inbred strain. We identified a positive correlation between post-restraint stress glucose and basal and stress corticosterone, as well as several overlapping loci between glucose and HPA traits, suggesting the altered HPA axis in the WKY is likely linked to glucose dysregulation in this strain. Correlations between behavior in the FST and glucose levels also suggest there may be a link between behavior and glucose in the WKY rat. Future studies using congenic rat strains or the heterogeneous stock rat colony (Johannesson et al. 2009) are needed to more clearly delineate the relationship between these phenotypes, and to fine-map these loci. This study is the first to investigate metabolic traits in an animal model of depression and suggest the WKY rat may be a useful model for dissecting the underlying genetic mechanisms linking depression, altered HPA activity and diabetes.
Acknowledgments
The current addresses for Leah Solberg Woods, Medical College of Wisconsin, Milwaukee, WI 53226, Nasim Ahmadiyeh, Brigham and Women's Hospital, Boston, MA 02215 and Amber Baum, National Science Foundation, Arlington, VA 22230
Grants: Supporting Grants: MH060789 to ER, NIH-R01GM076468 to GAC. JST is an investigator in the Howard Hughes Medical Institute.
References
- Anderson RJ, Freedland KE, Clouse RE, Lustman PJ. The prevalence of comorbid depression in adults with diabetes: a meta-analysis. Diabetes Care. 2001;24:1069–1078. doi: 10.2337/diacare.24.6.1069. [DOI] [PubMed] [Google Scholar]
- Biessels GJ, Kamal A, Ramakers GM, Urban IJ, Spruijt BM, Erkelens DW, Gispen WH. Place learning and hippocampal synaptic plasticity in streptozotocin-induced diabetic rats. Diabetes. 1996;45:1259–1266. doi: 10.2337/diab.45.9.1259. [DOI] [PubMed] [Google Scholar]
- Bilusic M, Bataillard A, Tschannen MR, Gao L, Barreto NE, Vincent M, Wang T, Jacob HJ, Sassard J, Kwitek AE. Mapping the genetic determinants of hypertension, metabolic diseases, and related phenotypes in the lyon hypertensive rat. Hypertension. 2004;44:695–701. doi: 10.1161/01.HYP.0000144542.57306.5e. [DOI] [PubMed] [Google Scholar]
- Broman KW, Wu H, Sen S, Churchill GA. R/qtl: QTL mapping in experimental crosses. Bioinformatics. 2003;19:889–890. doi: 10.1093/bioinformatics/btg112. [DOI] [PubMed] [Google Scholar]
- Bruehl H, Rueger M, Dziobek I, Sweat V, Tirsi A, Javier E, Arentoft A, Wolf OT, Convit A. Hypothalamic-pituitary-adrenal axis dysregulation and memory impairments in type 2 diabetes. J Clin Endocrinol Metab. 2007;92:2439–2445. doi: 10.1210/jc.2006-2540. [DOI] [PubMed] [Google Scholar]
- Chan O, Inouye K, Riddell MC, Vranic M, Matthews SG. Diabetes and the hypothalamo-pituitary-adrenal (HPA) axis. Minerva Endocrinol. 2003;28:87–102. [PubMed] [Google Scholar]
- Chan O, Inouye K, Vranic M, Matthews SG. Hyperactivation of the hypothalamo-pituitary-adrenocortical axis in streptozotocin-diabetes is associated with reduced stress responsiveness and decreased pituitary and adrenal sensitivity. Endocrinology. 2002;143:1761–1768. doi: 10.1210/endo.143.5.8809. [DOI] [PubMed] [Google Scholar]
- Chung WK, Zheng M, Chua M, Kershaw E, Power-Kehoe L, Tsuji M, Wu-Peng XS, Williams J, Chua SC, Jr, Leibel RL. Genetic modifiers of Leprfa associated with variability in insulin production and susceptibility to NIDDM. Genomics. 1997;41:332–344. doi: 10.1006/geno.1997.4672. [DOI] [PubMed] [Google Scholar]
- Churchill GA, Doerge RW. Empirical threshold values for quantitative trait mapping. Genetics. 1994;138:963–971. doi: 10.1093/genetics/138.3.963. [DOI] [PMC free article] [PubMed] [Google Scholar]
- Desautes C, Bidanelt JP, Milant D, Iannuccelli N, Amigues Y, Bourgeois F, Caritez JC, Renard C, Chevalet C, Mormede P. Genetic linkage mapping of quantitative trait loci for behavioral and neuroendocrine stress response traits in pigs. J Anim Sci. 2002;80:2276–2285. doi: 10.2527/2002.8092276x. [DOI] [PubMed] [Google Scholar]
- Fakhrai-Rad H, Nikoshkov A, Kamel A, Fernstrom M, Zierath JR, Norgren S, Luthman H, Galli J. Insulin-degrading enzyme identified as a candidate diabetes susceptibility gene in GK rats. Hum Mol Genet. 2000;9:2149–2158. doi: 10.1093/hmg/9.14.2149. [DOI] [PubMed] [Google Scholar]
- Galli J, Fakhrai-Rad H, Kamel A, Marcus C, Norgren S, Luthman H. Pathophysiological and genetic characterization of the major diabetes locus in GK rats. Diabetes. 1999;48:2463–2470. doi: 10.2337/diabetes.48.12.2463. [DOI] [PubMed] [Google Scholar]
- Galli J, Li LS, Glaser A, Ostenson CG, Jiao H, Fakhrai-Rad H, Jacob HJ, Lander ES, Luthman H. Genetic analysis of non-insulin dependent diabetes mellitus in the GK rat. Nat Genet. 1996;12:31–37. doi: 10.1038/ng0196-31. [DOI] [PubMed] [Google Scholar]
- Garrett MR, Dene H, Rapp JP. Time-course genetic analysis of albuminuria in Dahl salt-sensitive rats on low-salt diet. J Am Soc Nephrol. 2003;14:1175–1187. doi: 10.1097/01.asn.0000060572.13794.58. [DOI] [PubMed] [Google Scholar]
- Gauguier D, Froguel P, Parent V, Bernard C, Bihoreau MT, Portha B, James MR, Penicaud L, Lathrop M, Ktorza A. Chromosomal mapping of genetic loci associated with non-insulin dependent diabetes in the GK rat. Nat Genet. 1996;12:38–43. doi: 10.1038/ng0196-38. [DOI] [PubMed] [Google Scholar]
- Gold PW, Wong ML, Chrousos GP, Licinio J. Stress system abnormalities in melancholic and atypical depression: molecular, pathophysiological, and therapeutic implications. Mol Psychiatry. 1996;1:257–264. [PubMed] [Google Scholar]
- Golden SH. A review of the evidence for a neuroendocrine link between stress, depression and diabetes mellitus. Curr Diabetes Rev. 2007;3:252–259. doi: 10.2174/157339907782330021. [DOI] [PubMed] [Google Scholar]
- Granhall C, Park HB, Fakhrai-Rad H, Luthman H. High-resolution quantitative trait locus analysis reveals multiple diabetes susceptibility loci mapped to intervals<800 kb in the species-conserved Niddm1i of the GK rat. Genetics. 2006;174:1565–1572. doi: 10.1534/genetics.106.062208. [DOI] [PMC free article] [PubMed] [Google Scholar]
- Ikeda H, Shino A, Matsuo T, Iwatsuka H, Suzuoki Z. A new genetically obese-hyperglycemic rat (Wistar fatty) Diabetes. 1981;30:1045–1050. doi: 10.2337/diab.30.12.1045. [DOI] [PubMed] [Google Scholar]
- Inomata H, Watanabe T, Iizuka Y, Liang YQ, Mashimo T, Nabika T, Ikeda K, Yanai K, Gotoda T, Yamori Y, Isobe M, Kato N. Identification of quantitative trait loci for cardiac hypertrophy in two different strains of the spontaneously hypertensive rat. Hypertens Res. 2005;28:273–281. doi: 10.1291/hypres.28.273. [DOI] [PubMed] [Google Scholar]
- Johannesson M, Lopez-Aumatell R, Stridh P, Diez M, Tuncel J, Blazquez G, Martinez-Membrives E, Canete T, Vicens-Costa E, Graham D, Copley RR, Hernandez-Pliego P, Beyeen AD, Ockinger J, Fernandez-Santamaria C, Gulko PS, Brenner M, Tobena A, Guitart-Masip M, Gimenez-Llort L, Dominiczak A, Holmdahl R, Gauguier D, Olsson T, Mott R, Valdar W, Redei EE, Fernandez-Teruel A, Flint J. A resource for the simultaneous high-resolution mapping of multiple quantitative trait loci in rats: the NIH heterogeneous stock. Genome Res. 2009;19:150–158. doi: 10.1101/gr.081497.108. [DOI] [PMC free article] [PubMed] [Google Scholar]
- Kanemoto N, Hishigaki H, Miyakita A, Oga K, Okuno S, Tsuji A, Takagi T, Takahashi E, Nakamura Y, Watanabe TK. Genetic dissection of “OLETF”, a rat model for non-insulin-dependent diabetes mellitus. Mamm Genome. 1998;9:419–425. doi: 10.1007/s003359900789. [DOI] [PubMed] [Google Scholar]
- Katayama S, Inaba M, Maruno Y, Morita T, Awata T, Oka Y. Glucose intolerance in spontaneously hypertensive and Wistar-Kyoto rats: enhanced gene expression and synthesis of skeletal muscle glucose transporter 4. Hypertens Res. 1997;20:279–286. doi: 10.1291/hypres.20.279. [DOI] [PubMed] [Google Scholar]
- Kloting I, Kovacs P, van den Brandt J. Sex-specific and sex-independent quantitative trait loci for facets of the metabolic syndrome in WOKW rats. Biochem Biophys Res Commun. 2001;284:150–156. doi: 10.1006/bbrc.2001.4932. [DOI] [PubMed] [Google Scholar]
- Kose H, Moralejo DH, Ogino T, Mizuno A, Yamada T, Matsumoto K. Examination of OLETF-derived non-insulin-dependent diabetes mellitus QTL by construction of a series of congenic rats. Mamm Genome. 2002;13:558–562. doi: 10.1007/s00335-002-2199-y. [DOI] [PubMed] [Google Scholar]
- Kovacs P, Voigt B, Kloting I. Congenic strain confirms putative quantitative trait locus for body weight in the rat. Mamm Genome. 1998;9:294–296. doi: 10.1007/s003359900751. [DOI] [PubMed] [Google Scholar]
- Lander E, Kruglyak L. Genetic dissection of complex traits: guidelines for interpreting and reporting linkage results. Nature Genetics. 1995;11:241–247. doi: 10.1038/ng1195-241. [DOI] [PubMed] [Google Scholar]
- Lango H, Palmer CN, Morris AD, Zeggini E, Hattersley AT, McCarthy MI, Frayling TM, Weedon MN. Assessing the combined impact of 18 common genetic variants of modest effect sizes on type 2 diabetes risk. Diabetes. 2008;57:3129–3135. doi: 10.2337/db08-0504. [DOI] [PMC free article] [PubMed] [Google Scholar]
- Lin JM, Ortsater H, Fakhrai-Rad H, Galli J, Luthman H, Bergsten P. Phenotyping of individual pancreatic islets locates genetic defects in stimulus secretion coupling to Niddm1i within the major diabetes locus in GK rats. Diabetes. 2001;50:2737–2743. doi: 10.2337/diabetes.50.12.2737. [DOI] [PubMed] [Google Scholar]
- Loos RJ, Lindgren CM, Li S, Wheeler E, Zhao JH, Prokopenko I, Inouye M, Freathy RM, Attwood AP, Beckmann JS, Berndt SI, Jacobs KB, Chanock SJ, Hayes RB, Bergmann S, Bennett AJ, Bingham SA, Bochud M, Brown M, Cauchi S, Connell JM, Cooper C, Smith GD, Day I, Dina C, De S, Dermitzakis ET, Doney AS, Elliott KS, Elliott P, Evans DM, Sadaf Farooqi I, Froguel P, Ghori J, Groves CJ, Gwilliam R, Hadley D, Hall AS, Hattersley AT, Hebebrand J, Heid IM, Lamina C, Gieger C, Illig T, Meitinger T, Wichmann HE, Herrera B, Hinney A, Hunt SE, Jarvelin MR, Johnson T, Jolley JD, Karpe F, Keniry A, Khaw KT, Luben RN, Mangino M, Marchini J, McArdle WL, McGinnis R, Meyre D, Munroe PB, Morris AD, Ness AR, Neville MJ, Nica AC, Ong KK, O'Rahilly S, Owen KR, Palmer CN, Papadakis K, Potter S, Pouta A, Qi L, Randall JC, Rayner NW, Ring SM, Sandhu MS, Scherag A, Sims MA, Song K, Soranzo N, Speliotes EK, Syddall HE, Teichmann SA, Timpson NJ, Tobias JH, Uda M, Vogel CI, Wallace C, Waterworth DM, Weedon MN, Willer CJ, Wraight, Yuan X, Zeggini E, Hirschhorn JN, Strachan DP, Ouwehand WH, Caulfield MJ, Samani NJ, Frayling TM, Vollenweider P, Waeber G, Mooser V, Deloukas P, McCarthy MI, Wareham NJ, Barroso I, Kraft P, Hankinson SE, Hunter DJ, Hu FB, Lyon HN, Voight BF, Ridderstrale M, Groop L, Scheet P, Sanna S, Abecasis GR, Albai G, Nagaraja R, Schlessinger D, Jackson AU, Tuomilehto J, Collins FS, Boehnke M, Mohlke KL. Common variants near MC4R are associated with fat mass, weight and risk of obesity. Nat Genet. 2008;40:768–775. doi: 10.1038/ng.140. [DOI] [PMC free article] [PubMed] [Google Scholar]
- McMahon M, Gerich J, Rizza R. Effects of glucocorticoids on carbohydrate metabolism. Diabetes Metab Rev. 1988;4:17–30. doi: 10.1002/dmr.5610040105. [DOI] [PubMed] [Google Scholar]
- Mezuk B, Eaton WW, Albrecht S, Golden SH. Depression and type 2 diabetes over the lifespan: a meta-analysis. Diabetes Care. 2008;31:2383–2390. doi: 10.2337/dc08-0985. [DOI] [PMC free article] [PubMed] [Google Scholar]
- Moreno C, Dumas P, Kaldunski ML, Tonellato PJ, Greene AS, Roman RJ, Cheng Q, Wang Z, Jacob HJ, Cowley AW., Jr Genomic map of cardiovascular phenotypes of hypertension in female Dahl S rats. Physiol Genomics. 2003;15:243–257. doi: 10.1152/physiolgenomics.00105.2003. [DOI] [PubMed] [Google Scholar]
- Nobrega MA, Solberg Woods LC, Fleming S, Jacob HJ. Distinct genetic regulation of the progression of diabetes and renal disease in the Goto-Kakizaki (GK) rat. Physiol Genomics. 2009 doi: 10.1152/physiolgenomics.90389.2008. [DOI] [PubMed] [Google Scholar]
- Pariante CM, Lightman SL. The HPA axis in major depression: classical theories and new developments. Trends Neurosci. 2008;31:464–468. doi: 10.1016/j.tins.2008.06.006. [DOI] [PubMed] [Google Scholar]
- Reagan LP. Glucose, stress, and hippocampal neuronal vulnerability. Int Rev Neurobiol. 2002;51:289–324. doi: 10.1016/s0074-7742(02)51009-6. [DOI] [PubMed] [Google Scholar]
- Reagan LP, Grillo CA, Piroli GG. The As and Ds of stress: metabolic, morphological and behavioral consequences. Eur J Pharmacol. 2008;585:64–75. doi: 10.1016/j.ejphar.2008.02.050. [DOI] [PMC free article] [PubMed] [Google Scholar]
- Redei E, Pare WP, Aird F, Kluczynski J. Strain differences in hypothalamic-pituitary-adrenal activity and stress ulcer. Am J Physiol. 1994;266:R353–360. doi: 10.1152/ajpregu.1994.266.2.R353. [DOI] [PubMed] [Google Scholar]
- Redei EE. Molecular genetics of the stress-responsive adrenocortical axis. Ann Med. 2008;40:139–148. doi: 10.1080/07853890701724863. [DOI] [PubMed] [Google Scholar]
- Redina OE, Machanova NA, Efimov VM, Markel AL. Rats with inherited stress-induced arterial hypertension (ISIAH strain) display specific quantitative trait loci for blood pressure and for body and kidney weight on chromosome 1. Clin Exp Pharmacol Physiol. 2006;33:456–464. doi: 10.1111/j.1440-1681.2006.04387.x. [DOI] [PubMed] [Google Scholar]
- Rittenhouse PA, Lopez-Rubalcava C, Stanwood GD, Lucki I. Amplified behavioral and endocrine responses to forced swim stress in the Wistar-Kyoto rat. Psychoneuroendocrinology. 2002;27:303–318. doi: 10.1016/s0306-4530(01)00052-x. [DOI] [PubMed] [Google Scholar]
- Seda O, Liska F, Krenova D, Kazdova L, Sedova L, Zima T, Peng J, Pelinkova K, Tremblay J, Hamet P, Kren V. Dynamic genetic architecture of metabolic syndrome attributes in the rat. Physiol Genomics. 2005;21:243–252. doi: 10.1152/physiolgenomics.00230.2004. [DOI] [PubMed] [Google Scholar]
- Sen S, Churchill GA. A statistical framework for quantitative trait mapping. Genetics. 2001;159:371–387. doi: 10.1093/genetics/159.1.371. [DOI] [PMC free article] [PubMed] [Google Scholar]
- Solberg LC, Ahmadiyeh N, Baum AE, Vitaterna MH, Takahashi JS, Turek FW, Redei EE. Depressive-like behavior and stress reactivity are independent traits in a Wistar Kyoto × Fisher 344 cross. Mol Psychiatry. 2003;8:423–433. doi: 10.1038/sj.mp.4001255. [DOI] [PubMed] [Google Scholar]
- Solberg LC, Baum AE, Ahmadiyeh N, Shimomura K, Li R, Turek FW, Churchill GA, Takahashi JS, Redei EE. Sex- and lineage-specific inheritance of depression-like behavior in the rat. Mamm Genome. 2004;15:648–662. doi: 10.1007/s00335-004-2326-z. [DOI] [PMC free article] [PubMed] [Google Scholar]
- Solberg LC, Baum AE, Ahmadiyeh N, Shimomura K, Li R, Turek FW, Takahashi JS, Churchill GA, Redei EE. Genetic analysis of the stress-responsive adrenocortical axis. Physiol Genomics. 2006;27:362–369. doi: 10.1152/physiolgenomics.00052.2006. [DOI] [PubMed] [Google Scholar]
- Solberg LC, Olson SL, Turek FW, Redei E. Altered hormone levels and circadian rhythm of activity in the WKY rat, a putative animal model of depression. Am J Physiol Regul Integr Comp Physiol. 2001;281:R786–794. doi: 10.1152/ajpregu.2001.281.3.R786. [DOI] [PubMed] [Google Scholar]
- Sugiura K, Miyake T, Taniguchi Y, Yamada T, Moralejo DH, Wei S, Wei K, Sasaki Y, Matsumoto K. Identification of novel non-insulin-dependent diabetes mellitus susceptibility loci in the Otsuka Long-Evans Tokushima fatty rat by MQM-mapping method. Mamm Genome. 1999;10:1126–1131. doi: 10.1007/s003359901177. [DOI] [PubMed] [Google Scholar]
- Vingsbo-Lundberg C, Nordquist N, Olofsson P, Sundvall M, Saxne T, Pettersson U, Holmdahl R. Genetic control of arthritis onset, severity and chronicity in a model for rheumatoid arthritis in rats. Nat Genet. 1998;20:401–404. doi: 10.1038/3887. [DOI] [PMC free article] [PubMed] [Google Scholar]
- Watanabe TK, Okuno S, Oga K, Mizoguchi-Miyakita A, Tsuji A, Yamasaki Y, Hishigaki H, Kanemoto N, Takagi T, Takahashi E, Irie Y, Nakamura Y, Tanigami A. Genetic dissection of “OLETF,” a rat model for non-insulin-dependent diabetes mellitus: quantitative trait locus analysis of (OLETF × BN) × OLETF. Genomics. 1999;58:233–239. doi: 10.1006/geno.1999.5789. [DOI] [PubMed] [Google Scholar]
- Watanabe TK, Okuno S, Ono T, Yamasaki Y, Oga K, Mizoguchi-Miyakita A, Miyao H, Suzuki M, Momota H, Goto Y, Shinomiya H, Hishigaki H, Hayashi I, Asai T, Wakitani S, Takagi T, Nakamura Y, Tanigami A. Single-allele correction of the Dmo1 locus in congenic animals substantially attenuates obesity, dyslipidaemia and diabetes phenotypes of the OLETF rat. Clin Exp Pharmacol Physiol. 2001;28:28–42. doi: 10.1046/j.1440-1681.2001.03391.x. [DOI] [PubMed] [Google Scholar]
- Wei S, Wei K, Moralejo DH, Ogino T, Koike G, Jacob HJ, Sugiura K, Sasaki Y, Yamada T, Matsumoto K. Mapping and characterization of quantitative trait loci for non-insulin-dependent diabetes mellitus with an improved genetic map in the Otsuka Long-Evans Tokushima fatty rat. Mamm Genome. 1999;10:249–258. doi: 10.1007/s003359900982. [DOI] [PubMed] [Google Scholar]
- Zeggini E, Scott LJ, Saxena R, Voight BF, Marchini JL, Hu T, de Bakker PI, Abecasis GR, Almgren P, Andersen G, Ardlie K, Bostrom KB, Bergman RN, Bonnycastle LL, Borch-Johnsen K, Burtt NP, Chen H, Chines PS, Daly MJ, Deodhar P, Ding CJ, Doney AS, Duren WL, Elliott KS, Erdos MR, Frayling TM, Freathy RM, Gianniny L, Grallert H, Grarup N, Groves CJ, Guiducci C, Hansen T, Herder C, Hitman GA, Hughes TE, Isomaa B, Jackson AU, Jorgensen T, Kong A, Kubalanza K, Kuruvilla FG, Kuusisto J, Langenberg C, Lango H, Lauritzen T, Li Y, Lindgren CM, Lyssenko V, Marvelle AF, Meisinger C, Midthjell K, Mohlke KL, Morken MA, Morris AD, Narisu N, Nilsson P, Owen KR, Palmer CN, Payne F, Perry JR, Pettersen E, Platou C, Prokopenko I, Qi L, Qin L, Rayner NW, Rees M, Roix JJ, Sandbaek A, Shields B, Sjogren M, Steinthorsdottir V, Stringham HM, Swift AJ, Thorleifsson G, Thorsteinsdottir U, Timpson NJ, Tuomi T, Tuomilehto J, Walker M, Watanabe RM, Weedon MN, Willer CJ, Illig T, Hveem K, Hu FB, Laakso M, Stefansson K, Pedersen O, Wareham NJ, Barroso I, Hattersley AT, Collins FS, Groop L, McCarthy MI, Boehnke M, Altshuler D. Meta-analysis of genome-wide association data and large-scale replication identifies additional susceptibility loci for type 2 diabetes. Nat Genet. 2008 doi: 10.1038/ng.120. [DOI] [PMC free article] [PubMed] [Google Scholar]
- Zucker LM, Antoniades HN. Insulin and obesity in the Zucker genetically obese rat “fatty”. Endocrinology. 1972;90:1320–1330. doi: 10.1210/endo-90-5-1320. [DOI] [PubMed] [Google Scholar]