

Abstract
Aging is associated with significant white matter deterioration and this deterioration is assumed to be at least partly a consequence of myelin degeneration. The present study investigated specific predictions of the myelodegeneration hypothesis using diffusion tensor tractography. This technique has several advantages over other methods of assessing white matter architecture, including the possibility of isolating individual white matter tracts and measuring effects along the whole extent of each tract. The study yielded three main findings. First, age-related white matter deficits increased gradually from posterior to anterior segments within specific fiber tracts traversing frontal and parietal, but not temporal cortex. This pattern inverts the sequence of myelination during childhood and early development observed in previous studies and lends support to a “last-in-first-out” theory of the white matter health across the lifespan. Second, both the effects aging on white matter and their impact on cognitive performance were stronger for radial diffusivity (RD) than for axial diffusivity (AD). Given that RD has previously been shown to be more sensitive to myelin integrity than AD, this second finding is also consistent with the myelodegeneration hypothesis. Finally, the effects of aging on select white matter tracts were associated with age difference in specific cognitive functions. Specifically, FA in anterior tracts was shown to be primarily associated with executive tasks and FA in posterior tracts mainly associated with visual memory tasks. Furthermore, these correlations were mirrored in RD, but not AD, suggesting that RD is more sensitive to age-related changes in cognition. Taken together, the results help to clarify how age-related white matter decline impairs cognitive performance.
Keywords: Aging, DTI, tractography, radial diffusivity, demyelination
Introduction
Post-mortem and in vivo studies of the structural composition of the human brain converge on the idea that aging is associated with significant changes in white matter architecture (Meier-Ruge et al., 1992; for review, see Raz, 2005; Resnick et al., 2003; Scahill et al., 2003; Tang and Nyengaard, 1997). Evidence from humans (Yakovlev and Lecours, 1967) and non-human primates (Peters et al., 2000) suggests that this deterioration is partly due to the degeneration of myelin in old age, which is a process likely to impair the conduction of neural signals across the brain. The main goal of the current study was to investigate the possible predictions of this myelodegeneration hypothesis using diffusion tensor imaging (DTI) tractography.
DTI tractography is a non-invasive imaging technique for investigating changes in white matter integrity. Whereas early neuroimaging studies of white matter and aging typically used qualitative measures of white-matter hyperintensities or quantitative analyses of white matter volume (for review, see Sullivan and Pfefferbaum, 2006; Wozniak and Lim, 2006), more recent studies have used DTI. This technique assesses the diffusion of water molecules, which is more constrained for intact than degraded white matter fibers (Concha et al., 2006; Thomalla et al., 2004). Most DTI studies of aging have focused on regions-of-interest (ROI) or clusters of voxels showing significant differences (e.g., Grieve et al., 2007; Madden et al., 2004). These methods afford a number of benefits: manual ROI volumetry is the gold standard of neuroanatomical assessment and affords a high degree of spatial precision when compared to other voxelwise methods (Kennedy et al., 2008); voxel-based morphometry (VBM; Ashburner and Friston, 2000) approaches, one the other hand, benefit from a finer spatial localizability. The contributions of both ROI- and voxel-based analyses have been critical in identifying the finding that age-related differences in white matter integrity are largely localized to the frontal cortex. However, these approaches are limited in their assessment of white matter anatomy in that a single ROI or voxel cluster (1) includes several different white matter tracts connecting any number of different cortical areas, and (2) covers only a fraction of a particular long white matter tract. Both of these limitations are addressed in diffusion tensor tractography because the tracts identified with this method can be more specific to an individual white matter tract (e.g., the uncinate fasciculus), and can assess the whole extent of a longitudinal tract. DTI tractography therefore offers not only the opportunity to map fiber tracts representative of the underlying anatomy (Burgel et al., 2006), but also allows for the ability to test specific hypotheses about age-related changes in white matter morphology along the length of specific fiber tracts. In the present study, we used a seed-based diffusion tensor tractography approach (Corouge et al., 2006; Mori and van Zijl, 2002) to investigate two predictions motivated by the myelodegeneration hypothesis.
First, we investigated the prediction that age-related white matter deficits should increase gradually from posterior to anterior brain regions. Developmental studies have shown that frontal and temporal association regions are the last ones to myelinate (Kinney et al., 1988; Sakuma et al., 1991). Given the assumption that the brain regions that mature last during development tend to decline first during aging—“last in, first out” (Raz, 2000)—one would expect that age-related white matter should be more pronounced in anterior compared to posterior brain regions. DTI studies using ROI and VBM approaches have generally reported greater age effects in frontal compared to primary posterior cortices, though age-related decline in white matter volume and integrity occurs throughout the brain (Head et al., 2004; Madden et al., 2007; Madden et al., 2006; O’Sullivan et al., 2001; Raz et al., 2005; Salat et al., 1999; Sullivan et al., 2006). While many of these previous studies have reported a general “anterior-posterior gradient” describing the pattern of age-related changes (Head et al., 2004; Madden et al., in press; Pfefferbaum et al., 2005), this model has not been directly investigated in either voxelwise or ROI methods. We test one specific prediction of this model, in that the gradient hypothesis is specific to certain fiber systems within cerebral regions where the anterior-posterior gradient has been previously observed, namely within frontal and parietal white matter. Tractography is well-suited to isolate these fiber systems and provides a means of directly testing the question of whether the age-related differences found in these frontal regions reflects a general anterior-posterior gradient within specific tracts connecting anterior and posterior regions, or instead reflects the selective vulnerability of frontal white matter. Given the debate about whether age-related cognitive decline is primarily due to frontal dysfunction (Moscovitch and Winocur, 1992; West, 1996) or to more widespread changes in the brain (Greenwood, 2000), this is an issue with important theoretical implications. If the anterior-posterior gradient is in fact demonstrable in specific white matter tracts, age effects should increase gradually from posterior to anterior sections of each fiber tract traversing the frontal lobe association regions. In contrast, if age-related decline is specific to frontal regions, age effects should increase abruptly at the point in which the fiber tract enters the frontal lobes.
Second, we investigated the prediction that the effects aging on white matter and their impact on cognitive performance should be stronger for radial diffusivity (RD) than for axial diffusivity (AD) measures. Evidence from post-mortem studies in primates suggests that the protracted age-related degeneration of white matter is at least partially related to changes in myelination, including increases in the number of dense inclusions, the formation of myelin balloons, or the formation of redundant myelin (Feldman and Peters, 1998; Peters and Sethares, 2002). While these morphological changes may underlie the observed age-related differences in white matter volume or integrity, in vivo evidence for myelodegeneration in humans is limited. Although most DTI studies have focused on fractional anisotropy (FA) as a summary measure of white matter integrity, there is evidence that two components of the diffusion signal, namely AD and RD, have different relations to cellular mechanisms of white matter deterioration. AD describes the principal eigenvector (λ1) and is assumed to contribute information regarding the integrity of axons (Glenn et al., 2003) or changes in extra-axonal/extracellular space (Beaulieu and Allen, 1994). In contrast, RD describes an average of the eigenvectors perpendicular to the principal direction ( [λ2 + λ3]/2 ) and is assumed to characterize changes associated with myelination or glial cell morphology (Song et al., 2003; Song et al., 2002; Song et al., 2005). This relationship has recently been extended to humans in a study by Schmierer and colleagues (2004), in which a combined diffusion imaging and histological assessment of unfixed brain tissue collected post mortem from multiple sclerosis (MS) patients showed that both FA and RD, but not AD, were significant predictors of myelin content. While this direct relationship between RD and myelin has yet to be extended to healthy adults, DTI studies in healthy older adult populations have generally found greater age-related declines in the medium and minor eigenvectors, indicating a decline in radial diffusivity (Bhagat and Beaulieu, 2004; Madden et al., in press; Sullivan et al., 2006; Sullivan et al., 2008; Vernooij et al., 2008). Furthermore, given that studies have shown that developmental maturation of white matter may primarily be driven by decreases in RD (Giorgio et al., 2008; Snook et al., 2005), it is reasonable to hypothesize that changes to white matter anatomy later in life are also a consequence of myelination, and maybe evidenced by increases in RD in fiber systems that are the latest to myelinate (Lebel et al., 2008). Thus, the myelodegeneration hypothesis predicts that age effects should be larger for RD and AD, and that these effects should be observed in all late-myelinating regions, including both frontal and temporal association cortices. Moreover, this hypothesis predicts that correlations between white matter integrity and cognitive performance in older adults should be stronger for RD than for AD measures.
In addition to testing the foregoing two predictions derived from the myelodegeneration hypothesis, a third goal of the study was to investigate the specificity of associations between the effects of aging on different white matter tracts and different cognitive measures. Given that (a) each cognitive function depends on a certain set of brain regions and corresponding white matter connections and (b) that the effects of aging across the brain show substantial individual differences (Glisky et al., 1995; Glisky et al., 2001), it is reasonable to expect that correlations between the effects of aging on white matter tracts and cognitive tasks should be specific rather than global. Examining this idea requires assessment of several different tracts and several different cognitive measures, but most previous DTI studies of aging have focused on a few white matter ROIs and a few cognitive measures (Bucur et al., 2007; Madden et al., 2004; Persson et al., 2006; Sullivan et al., 2001; Sullivan et al., 2006). Two studies investigated DTI-behavior correlations using larger set of cognitive tests (Grieve et al., 2007; O’Sullivan et al., 2001), but their conclusions regarding specificity are limited because they found significant age effects only in executive functions tests. To address this issue, we investigated cognitive performance using a standardized neuropsychological battery (Owen et al., 1996; Robbins et al., 1998) likely to yield reliable age effects on several different tasks, including tests of memory as well as executive functioning. We then correlated DTI measures and cognitive performance measures to identify tracts that were significant predictors of age-related differences in cognitive performance in older adults.
Methods
Participants
The participants were 20 older adults (12 female; M = 68.89 years, SD = 5.3 years,) and 20 younger adults (9 female; M = 20.04 years, SD = 2.5 years) with normal or corrected-to-normal vision, and no history of neurological or psychiatric disease. Written informed consent was obtained from each participant, and the study was approved by the Duke University Institutional Review Board. Younger adults were recruited from the Duke University community; older adults were community-dwelling individuals who were recruited from the greater Durham community. Older adults were screened for health problems and conditions that could affect blood flow (e.g., hypertension, medications affecting blood flow) using a questionnaire. The selected group of older participants performed well within the normal range in the Mini-mental Status Exam, as well as the normal age appropriate range on tests of cognitive function included in the Cambridge Neuropsychological Test Automated Battery (CANTAB), ensuring that they were cognitively healthy and free from dementia, with all imaging performed within 5 months of testing.
Behavioral Testing
Before scanning, participants in both the older and younger groups underwent neuropsychological assessment with the CANTAB battery (Table 1). Included were four tests associated with executive functioning (Intra-Extra Dimensional Set Shifting, Spatial Span, Spatial Working Memory, Rapid Visual Information Processing), two tests of visual memory performance (Paired-Associate Learning, Pattern Recognition Memory), and two processing speed tasks (Movement Time and Reaction Time).
Table 1.
Participant characteristics and neuropsychological data.
| YA (n = 20) M (SD) | OA (n = 20) M (SD) | |
|---|---|---|
| Age | 20.04 (2.85) | 68.89 (7.29) |
| Years of Education*** | 13.59 (1.70) | 17.47 (1.47) |
| Mini-Mental State Examination | n/a | 28.3 (1.5) |
| Executive Tasks | ||
| Spatial Working Memory | ||
| Between errors** | 7.40 (9.97) | 35.40 (24.35) |
| Strategy* | 25.00 (5.17) | 32.35 (6.98) |
| Spatial Span ** | 7.80 (1.01) | 5.65 (1.31) |
| Rapid Visual Information Processing** | 0.96 (0.03) | 0.91 (0.06) |
| Intra-Extra Dimensional Set Shifting | ||
| Stages completed | 9.00 (0.00) | 8.75 (0.64) |
| Total errors** | 10.35 (4.32) | 20.70 (12.72) |
| Memory Tasks | ||
| Paired Associate Learning* | 96.27 (4.14) | 92.08 (4.86) |
| Pattern Recognition Memory** | 2.60 (2.58) | 14.20 (8.11) |
| Speed Tasks | ||
| Movement time** | 316.83 (40.97) | 402.82 (72.78) |
| Reaction time** | 298.91 (39.05) | 376.09 (52.53) |
Note: YA, younger adults; OA, older adults; M, mean; SD, standard deviation. Age-related differences indicated by
= P < 0.05;
= P < 0.005;
= P < 0.001.
DTI Acquisition and Preprocessing
MRI data were acquired on a 3T General Electric (Milwaukee, WI) Signa human MRI scanner. The DT-MRI dataset was based on a single-shot EPI sequence (TR = 1700 ms, 50 contiguous slices of 2.0 mm thickness, FoV = 256 × 256 mm2, matrix size 128 × 128, voxel size 2 × 2 × 2 mm, b-value = 1000 s/mm2, 15 diffusion-sensitizing directions, 960 total images, total scan time approx. 5 min). The resulting images were skull-stripped in order to remove non-brain and ambient noise using the Brain Extraction Tool (Smith et al., 2002), and eddy-corrected to account for drifts in scanner acquisition. Diffusion tensors were calculated from the 15 diffusion weighted images based upon a typical simple least squares fit of the tensor model to the diffusion data (Basser et al., 2000). Diagonalization of the tensor yielded three voxel-specific eigenvalues (λ1 > λ2 > λ3), which represent diffusivities along the three principal directions of the tensor. These three eigenvalues were used to construct fiber tracts and the diffusion properties (RD, AD) discussed below.
Fiber Tracking
Diffusion fiber tracts were constructed using software distributed by Gerig and colleagues (http://www.ia.unc.edu/dev/), based on the method of Mori and colleagues (Mori and van Zijl, 2002; Xu et al., 2002), which applies a unit-step algorithm to tensor streamlines following the direction of greatest diffusivity (λ1) between seed and target ROIs (for a more detailed explanation, see Catani et al., 2002). The method consisted of four steps (see Fig. 1). First, seed and target ROIs for each tract of interest were drawn on the native space b0 (non-diffusion-weighted) image and fibers traversing seed and target regions were estimated by the software (Fig. 1A). Consistent with previous tractography studies using similar methods (Sullivan et al., 2006; Wakana et al., 2007), fiber tracking parameters included a minimum FA of 0.2, a fiber tracking threshold of 0.125 and an angle of maximum deviation of 35° Additional parameters including seed and target ROIs and minimum/maximum fiber length were determined specific to local fiber tract characteristics and standard anatomical landmarks; these are described for each fiber tract in Table 2. Fibers were then represented as polylines and reparameterized by cubic B-spline curves (Fig. 1B), which ensured an equidistant sampling along each fiber as well as consistent sampling for all fibers (Corouge et al., 2006). Third, after fiber estimation, mean tensor fibers were constructed from each set of fibers (Fig. 1C). Diffusion properties were then computed and reparametrized according to the distance from an established origin based upon a consistent anatomical landmark; diffusion properties were evaluated at points along the length of each fiber at cross sections. Critically, all fiber tracts remained in native space throughout fiber tracking procedure, and only after parameters were derived from the individual were values adjusted for normalized fiber length and averaged across age group. Fourth, after additional processing and statistical analysis (see below), group differences were transposed onto the mean tract for visualization (Fig. 1D).
Figure 1.

Methodology for assessing diffusion metrics along fiber tract lengths. (A) Seed (red) and target (green) regions were drawn on the b0 image in order to identify white matter tracts; in this example an axial view of the anterior cortex depicts a seed region around the midline and left and right ROIs in frontal cortex are used to elucidate fiber tracts passing through the genu of the corpus callosum; (B) identified extracted fiber tracts with outliers removed; (C) mean fibers were constructed by averaging the spatial characteristics of all fibers within a tract. (D) Linearly adjusted mean differences were assed via ANOVA and F-statistics were transposed back onto the mean tract for visualization.
Table 2.
Fiber Tracking heuristics.
| Fiber Tract | Seed ROI | Target ROI | Midpoint | IRR |
|---|---|---|---|---|
| Genu | anterior CC | frontopolar cortex | midline | 0.938 |
| Splenium | posterior CC | occipital cortex | midline | 0.927 |
| Uncinate fasciculus | temporal pole | inferior frontal cortex | frontotemporal border | L: 0.942; R: 0.836 |
| Cingulum bundle | posterior cingulate cortex | anterior cingulate cortex | level of anterior commissure | L: 0.881; R:0.824 |
| Inferior longitudinal fascicus | anterior temporal cortex | periventricular occipital cortex | occipitotemporal fissure | L: 0.913; R:0.892 |
Note: ROI, region of interest; IRR, intra-rater reliability, CC, corpus callosum
The resulting parameters included mean fractional anisotropy, axial diffusivity (λ1), and radial diffusivity ([λ2 +λ3]/2). To derive diffusion properties evident of consistent locations across subjects, we set anchor points at consistent anatomical loci for each tract of interest located along the path of the fiber tract (See Table 2). In order to ensure sampling from a uniform anatomical structure and not individual fibers deviating from the main axis of the tract, mean fibers were computed for each tract in each subject by averaging the spatial characteristics of all extracted polylines in a fiber tract, along an axis extending from the tract midline. Individual tractography fibers deviating more than 35° from the mean fiber were then excluded from analysis. In order to account for individual variability in fiber lengths, tract data were then linearly adjusted across subjects via linear interpolation according to at least 3 anatomical landmarks along the course of the fiber before group averages were calculated, and then sectioned into 10mm segments along the main axis of the tract.
Anatomical guidelines and termination heuristics for defining tracts of interest were determined by anatomical reference (Bassett, 1952; Curran, 1909; Duvernoy, 1999; Ebeling and von Cramon, 1992; Kier et al., 2004), and a diffusion tractography atlas (Wakana et al., 2004) and were supervised by an expert neuroanatomist (LEW). Seed and target ROIs for tractography are represented in Table 2. Additionally, our fiber tracking was performed by 2 raters; inter-rater reliability was assessed by performing repeated fiber tracking measurements on the same subset of 6 individuals randomly assigned for gender and group for each tract and raters were blind to age group of the data, such that tractography procedures did not differ between groups. Briefly, fiber tracts were first converted to binary volumetric information by assigning a value of 1 or 0, and difference images between raters were used to assess the spatial overlap in pixels between two raters. The Cohen’s kappa coefficient was calculated by K = (observed agreement − expected agreement)/(1 − expected agreement). The analysis was applied pair-wise between individual raters, providing an intra-rater reliability estimate for each tract (see Table 2). Previous studies using similar methods have described the strong intra-rater reliability of this approach (Wakana et al., 2007), indicating that the current methods provide a reliable estimate of between expert raters. All tracts met the fiber tracking parameters described above, except for one younger adult right UF and one older adult left UF, likely due to scanner artifact in this susceptible inferofrontal region. The remaining white matter structures traced in this study all showed high inter-rater reliability across all tracts, with average IRR scores within the “almost perfect” agreement (K > 0.80) set forth by Landis and Koch (1977). Additionally, we compared both the total number of extracted fibers as well as number of outliers (# of fibers before outlier removal - # fibers after outlier removal) on each fiber tract and found no significant effects of age (p < 0.05); there were no effects of gender on FA, RD, or AD across all tracts, which is consistent with previous findings (Salat et al., 1999; Sullivan et al., 2001).
Supplementary Voxelwise Validation
In order to validate our tractography results a follow-up voxelwise analysis was performed using Tract-Based Spatial Statistics (TBSS; Smith et al., 2006) module of FSL (Smith et al., 2004). TBSS is an attractive means of comparing tractography with voxel-based methods, in that the normalization used is particularly responsive to the underlying white matter architecture. In accordance with the standard TBSS pipeline, FA maps from all 40 subjects were normalized to the FMRIB58_FA standard space white matter template. A voxelwise analysis of the normalized FA maps was then completed in a two-sample (young, old) t-test in Statistical Parametric Mapping 5 (SPM5; http://www.fil.ion.ucl.ac.uk/spm/). Given that tracts within the current analysis observed an anterior-posterior gradient only when traversing frontal-parietal cortices (see below), we applied both a whole-brain WM as well as a frontal-parietal WM mask to the voxelwise analysis above. The whole brain mask comprised all white matter voxels in the FMRIB58_FA atlas with an FA value greater than 0.2; the frontal-parietal mask comprised a subset of those voxels located within the frontal and parietal lobe ROIs from the PickAtlas toolbox (http://www.fmri.wfubmc.edu/download.htm) in SPM5.
Statistical analyses
To investigate the prediction that age-related white matter deficits should gradually increase from posterior to anterior brain regions, we focused on the effects of aging along the y-axis of two tracts that follow an anterior-posterior trajectory and enter the frontal lobe: the cingulum bundle (CB) and frontal section of the uncinate fasciculus (UF). Temporal sections of this latter tract were excluded from trend analysis by removing points inferior to the fronto-temporal border, which also served as the midpoint landmark (i.e., anchor) for this fiber tract (see Table 2). Adjusted tract coordinates from the group means above were transposed linearly to Talairach coordinates, and lengths of each tract were divided into 10mm sections with respect to their position along the y-axis. To distinguish between gradual vs. abrupt changes in age effects, independent-samples t-test was performed at each point along a normalized fiber tract; trend analyses were performed on the resulting measure of age differences in FA (partial eta) along the anteroposterior extent of the fiber tract. Both linear and quadratic changes were tested simultaneously in the model. In this analysis, a linear trend represents a gradual change, a quadratic trend represents an abrupt change, and the intercept represents the main effect of age. Thus, a trend analysis can be useful in characterizing whether age-related differences along a tracts are global (intercept differences) or whether they differ along the tract gradually (linear term) or abruptly (quadratic term) along the anteroposterior extent of a longitudinal fiber tract. Trend analyses were repeated on t-statistics from the masked voxelwise analysis described above, averaging the t-statistic for each slice within the mask along the same anterior-posterior axis as in the above tractography-based analysis (see Figure S1).
To investigate the prediction that the effects aging on white matter and their impact on cognitive performance should be stronger for radial diffusivity (RD) than for axial diffusivity (AD) measures were performed two analyses. First, we performed age (younger vs. older) x diffusivity measure (RD vs. AD) ANOVAs on all sections of all tracts showing significant age effects on FA. Age group and diffusivity measures were used as fixed factors, subjects as a random factor, and gender as a covariate of interest. Additionally, RD and AD were evaluated independently for group effects, with gender again included as a covariate of interest. Second, using t-tests we tested whether the correlations between age-related white matter decline and age-related cognitive decline (see below) were greater when for RD than AD.
Finally, to investigate the specificity of associations between the effects of aging on different white matter tracts and different cognitive measures we correlated DTI measures and CANTAB measures. The goal of these analyses was to find tracts which act as predictors of cognitive performance in older adults; hence, only test scores and white matter tracts which showed both a significant age-related difference in FA (p < 0.01) and test performance (p < 0.05) were included in the analysis. Because age is positively correlated with white matter decline, we used a stepwise regression model in order to identify age-dependent changes in white matter-behavior relationships. The Age variable was forced into the regression model at the first step, and other predictor variables were entered into the model sequentially based on the strength of their relationship to the dependent variable, covaried for the effects of variables entered previously. Model estimation ended when no other variable met the criterion for entry (p = 0.5). Significant Age x FA interactions predicting task performance were identified and further evaluated for significant effects within older adults with Pearson’s r.
Results
Anterior-posterior trend analysis
Figure 2 shows age-related differences in FA (younger – older) along the length of five tracts: the genu and the splenium of the corpus callosum, the cingulum bundle (CB), the inferior longitudinal fasciculus (ILF), and the uncinate fasciculus (UF). Qualitative inspection of this figure suggests that the greatest age-related differences in FA (i.e., warmer colors in Figure 2) occurred mainly in anterior segments of longitudinal tracts traversing the frontal lobe. To investigate the prediction that age-related white matter deficits should gradually increase from posterior to anterior brain regions, we focused specifically on two tracts that follow an anterior-posterior trajectory and enter into the frontal lobes, the UF and CB. As illustrated by the trend analyses in Figure 4, in both left and right UF and in both left and right CB, group-related effect sizes from an Young > Older t-contrast increased linearly from posterior to anterior regions. To determine if the change was gradual or abrupt, linear and quadratic regressors were simultaneously tested. The intercept trend (p < 0.01) was significant for tracts, indicating a main effect of age. Importantly, the linear regressor was significant in all four tracts (left and right frontal UF, left and right CB), whereas the quadratic regressor was significant for none of them. Follow-up analyses based upon a masked voxelwise analysis confirmed these linear trends for voxels within frontal and parietal cortex (linear: t = 5.27, p < 0.01; quadratic: t = 1.13, p = n.s.), providing an important validation of the tractography results compared to more standard voxelwise analyses. Combined, these results support the prediction of the myelodegeneration hypothesis that age effects increase gradually from posterior to anterior regions rather than being specific to the frontal lobes.
Figure 2.

Age-related differences in FA, RD, and AD for tracts of interest. FA differences are shown along a tract; FA data were smoothed with a 6mm kernel and displayed upon mean tracts from a representative subject for the genu, UFs, CBs, ILFs, and splenium. RD and AD differences within these target sections are displayed in graphs corresponding to specific long association tracts. RD = radial diffusivity; AD = axial diffusivity; CB = cingulum bundle; UF = uncinate fasciculus; ILF = inferior longitudinal fasciculus. Metric dimensions: AD, RD: 10−3 mm2/s; * = P < 0.01; ** = P < 0.005; *** = P < 0.001.
Figure 4.

Trend analysis of the CB and frontal UF. Trend lines for both linear (solid) and quadratic (dashed) trends are represented over the y-axis component (Talairach coordinates) of each tract using the effect size (partial eta) based on a pairwise analysis at points along a tract. F statistics for best fit for both linear and quadratic terms are displayed below the data. Linear trends are significant for the left and right CB, and the left and right (frontal) UF. The vertical dashed line approximates the border between frontal and parietal cortex, according to the anterior border precentral sulcus. CB = cingulum bundle; UF = uncinate fasciculus; YA = young adult; OA = older adult.
Radial vs. axial diffusivity
Age-related differences in RD and AD for all tracts are reported in Table 3 and depicted in Figures 2 and 3. To investigate the prediction thatthe effects of aging are greater for RD for AD, we tested for Age (younger, older) x Diffusivity Measure (RD, AD) interactions. Significant interactions were found in the genu (F = 11.39; p < 0.005), bilateral CB (L: F = 6.39; p < 0.05; R: F = 5.90; p < 0.05) and bilateral UF (L: F = 5.69; p < 0.05; R: F = 5.49; p < 0.05), and in all cases age differences were greater for radial than axial diffusivity (Figure 3). In left and right ILF, the interaction did not reach significance, but the age effect was significant for RD but not for AD, consistent with the pattern displayed by the other tracts in late-myelinating regions.
Table 3.
Age differences in Fractional Anisotropy (FA), Radial Diffusivity (RD), and Axial Diffusivity (AD).
| FA | RD | AD | |||||||
|---|---|---|---|---|---|---|---|---|---|
| YA M (SD) | OA M (SD) | ηp | YA M (SD) | OA M (SD) | ηp | YA M (SD) | OA M (SD) | ηp | |
| Genu | 0.55 (0.04) | 0.50 (0.04)*** | 0.33 | 0.49 (0.04) | 0.54 (0.06)** | 0.22 | 1.27 (0.05) | 1.24 (0.06) | 0.09 |
| Splenium | 0.67 (0.04) | 0.63 (0.04)* | 0.15 | 0.54 (0.12) | 0.59 (0.11) | 0.05 | 1.78 (0.19) | 1.75 (0.17) | 0.01 |
| Left CB | 0.58 (0.04) | 0.56 (0.04)* | 0.17 | 0.46 (0.05) | 0.52 (0.04)** | 0.27 | 1.26 (0.09) | 1.25 (0.09) | 0.00 |
| Right CB | 0.55 (0.02) | 0.51 (0.04)** | 0.18 | 0.47 (0.03) | 0.51 (0.03)*** | 0.40 | 1.26 (0.08) | 1.23 (0.07) | 0.01 |
| Left UF‡ | 0.51 (0.05) | 0.46 (0.04)** | 0.21 | 0.51 (0.06) | 0.55 (0.07) | 0.10 | 1.23 (0.16) | 1.17 (0.08) | 0.04 |
| Right UF† | 0.51 (0.04) | 0.47 (0.03)** | 0.27 | 0.48 (0.03) | 0.54 (0.07)** | 0.24 | 1.19 (0.04) | 1.19 (0.06) | 0.00 |
| Left ILF | 0.57 (0.04) | 0.53 (0.03)** | 0.21 | 0.48 (0.03) | 0.55 (0.06)*** | 0.35 | 1.31 (0.07) | 1.36 (0.07) | 0.10 |
| Right ILF | 0.58 (0.04) | 0.54 (0.03)*** | 0.25 | 0.46 (0.02) | 0.50 (0.05)** | 0.25 | 1.29 (0.06) | 1.31 (0.06) | 0.03 |
Note: Metric dimensions: FA: dimensionless; AD, RD: 10−3 mm2/s;
= P < 0.01;
= P < 0.005;
= P < 0.001.
YA = young adult; OA = older adult; M = mean; SD = standard deviation; ηp = partial eta (effect size).
= N = 19 YAs, 20 OAs;
= N = 20 YAs, 19 OAs.
Figure 3.

Age-related differences in AD (A) and RD (B) represented upon mean tracts from a representative subject, demonstrating greater age-related effects for RD than AD. Color scales for RD have been reversed such that OA > YA differences are reflected by warmer colors. RD = radial diffusivity; AD = axial diffusivity.
Tract-Function Specificity
To investigate specific relations between the effects of aging on particular white matter tract and particular cognitive functions we focused fiber tracts that showed significant age-related decline in FA (see Table 3) and cognitive tasks that showed reliable age effects (see Table 1). Within older adults, a number of correlations between task performance and diffusion metrics were found and are displayed in Table 4 and Figure 5. As evidenced by the standard deviations in Table 1, data from younger adults’ performance showed a relatively low variance compared to older adults; consistent with other tractography studies of younger adults, diffusivity measures for these subjects also showed a similarly low variance in FA, AD, and RD values (see Table 3). It is therefore unsurprising that no significant relationship was observed between behavior and structure in this younger population. Consistent with the notion of functional specificity, tracts connecting frontal regions in older adults (e.g., genu, right UF) were highly correlated with performance on executive function tasks (Spatial Span, Spatial Working Memory, and Intra-Extra Dimensional Set Shifting), whereas tracts connecting more posterior regions (left CB, ILF, splenium) were highly correlated with performance on visual memory tests (Paired Associate Learning, and Pattern Recognition Memory).
Table 4.
Relationships between DTI metrics and cognitive performance in older adults.
| Pearson’s r | ||||
|---|---|---|---|---|
| tract | cognitive test | FA | RD | AD |
| Genu | Spatial Span | 0.57** | −0.41* | −0.18 |
| Right UF | Spatial Working Memory‡ | 0.57** | −0.37 | 0.18 |
| Spatial Working Memory – strategy | 0.52** | −0.40* | 0.03 | |
| Intra-Extra Dimensional Set Shifting‡ | 0.63*** | −0.38* | 0.21 | |
| L CB | Pattern Recognition Memory | 0.38* | −0.37* | 0.23 |
| Paired Associate Learning‡ | 0.47* | −0.45* | −0.06 | |
| L ILF | Paired Associate Learning‡ | 0.43* | −0.42* | −0.32 |
| Splenium | Pattern Recognition Memory | 0.44* | −0.53** | −0.46* |
Notes: = Task scores based on number of errors have directions of Pearson’s r flipped.
= P < 0.05;
= P < 0.01;
= P < 0.005
Figure 5.
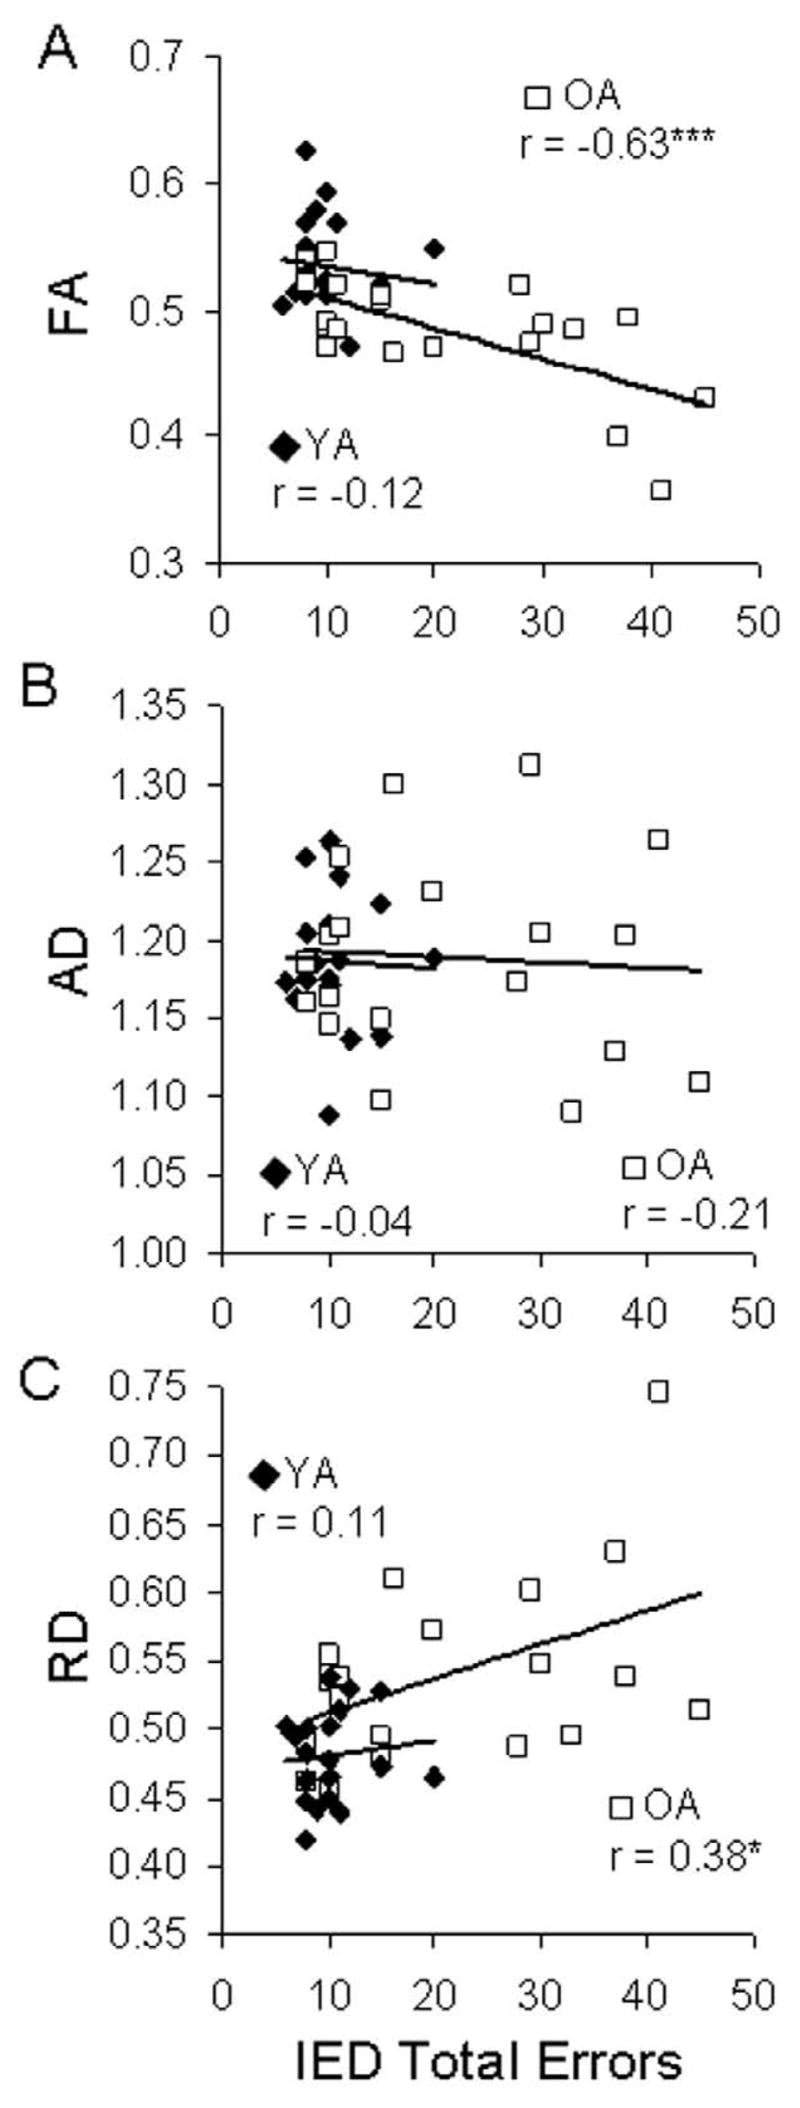
Representative correlation between diffusivity measures extracted from the right uncinate fasciculus and performance on the Intra-Extra Dimensional Set Shift (IED) task. Scatterplots show significant relationships between IED performance and FA and RD, but not AD. Metric dimensions: FA: dimensionless; AD, RD: 10−3 mm2/s. * = P < 0.05; *** = P < 0.005.
We also investigated how well RD and AD predict cognitive deficits associated with aging. As illustrated by Table 4, correlations were generally significant for RD but not for AD. Importantly, with the exception of two posterior tracts (left ILF and splenium), the correlations were significantly stronger for RD than for AD; t-tests showed greater behavior-diffusivity measure correlations for RD than AD in the genu (Spatial Span: t = 5.90, p < 0.01), right UF (Spatial Working Memory: t = 3.50, p < 0.01; Spatial Working Memory-strategy: t = 2.47, p < 0.05; Intra-Extra Dimensional set shifting: t = 3.97, p < 0.01) and left CB (Pattern Recognition Memory: t = 4.89, p < 0.01; Paired Associate Learning: t = 2.48, p < 0.05). In sum, the results suggests that the effect of aging on individual white matter tracts influences specific cognitive functions, and support the prediction of the myelodegeneration hypothesis that the effects aging on white matter and their impact on cognitive performance are stronger for RD than AD.
Discussion
Our results revealed three main findings. First, age-related white matter deficits within tracts traversing frontal and parietal cortices increased gradually, not abruptly, from posterior to anterior brain regions. Second, the effects of aging on white matter structure and their impact on cognitive performance were stronger for RD than for AD measures. Finally, results revealed that the effects of aging on particular white matter tracts had an impact on specific cognitive functions; in particular, anterior tracts were primarily associated with executive tasks and posterior tracts were mainly associated with visual memory tasks. Furthermore, the results show that relationships between cognitive performance and FA were generally mirrored in RD, but not AD. These findings support predictions based on the myelodegeneration hypothesis of aging and are discussed in separate sections below.
Anterior-Posterior Gradient
The first main finding of the study was that age-related white matter deficits increased gradually from posterior to anterior brain regions within specific white matter tracts. The anterior-posterior gradient was found within tracts that traverse frontal and parietal cortex (CB & UF), but not for tracts which traverse the temporal lobe (ILF). Thus, the data partially supports the general anterior-posterior gradient hypothesis in that it may be generalized to only those fiber systems within frontal and parietal lobes. This new finding of a linear gradient of change within fiber tracts traversing through and outside the frontal cortex does not support the frontal hypothesis of aging. Although this finding is consistent with the results of ROI-based DTI studies that have identified an increase in the age-related difference in FA from posterior to anterior regions (Bucur et al., 2007; Head et al., 2004; Salat et al., 2005), it adds to these findings by providing greater specificity to the previously described anterior-posterior gradient (Head et al., 2004; Madden et al., in press; Pfefferbaum et al., 2005) in specific tracts connecting the frontal lobe with more posterior cortices. As noted in the Introduction, ROI-based DTI analyses cannot distinguish among overlapping white matter fiber tracts within a given ROI, and do not normally sample the whole extent of long white matter fibers. In contrast, the tractography-based analyses employed in this study were able to isolate individual fiber tracts highly representative of white matter anatomy, and measure age effects along the whole extent of each tract.
Measuring age effects along the whole extent of each tract is particularly important for the goal of investigating anterior-posterior differences in age-related white matter decline because it allows one to (1) compare age effects on anterior vs. posterior sections of the same tract, as opposed to comparing different age effects on separate anterior vs. posterior tracts (e.g., genu vs. splenium), and (2) measure age effects continuously along each fiber tract. Because of these features, the current study was able to compare two possible patterns of anterior-posterior differences in age-related white matter decline: a gradual pattern vs. frontal-specific pattern. As illustrated by Figure 4, significant linear trends supported the idea of a gradual pattern, though only within specific white matter fiber tracts. In the cingulum bundle (CB), for example, age effects were greater for frontal than for posterior brain regions, and they decreased gradually from anterior frontal (e.g., y = 20) to posterior frontal (e.g., y = 0) to anterior parietal (e.g., y = −20) and to posterior parietal (y = −40) regions. This finding challenges the traditional idea that healthy cognitive aging is a frontal phenomenon (Moscovitch and Winocur, 1992; West, 1996) and suggest instead that age effects decrease gradually from anterior to posterior brain regions.
Importantly, these linear trends identified in our tractography analysis were replicated in a masked voxelwise analysis, in that an anterior-posterior gradient also described age-related differences throughout the frontal and parietal lobes. Thus, results of both tractography and voxelwise assessments provide greater specificity to the anterior-posterior gradient, localizing this effect to white matter connecting frontal and parietal cortices. Additionally, both tractography and voxelwise analyses (see Figure 2, S1) identified an exception to the anterior-posterior trend within temporal lobes (discussed below), suggesting that this trend does not generalize to temporal cortices. While future studies are needed to further evaluate the correspondence between analysis techniques, the identification of a linear trend within the voxel-based analysis nonetheless suggests further support for the anterior-posterior gradient within frontal and parietal cortices.
As noted in the Introduction, one possible explanation of the observed anterior-posterior gradient is the “first-in-last-out” hypothesis (Raz, 2000), which postulates that white matter decline during aging follows the reverse order of white matter maturation during childhood development. Evidence from developmental studies suggests that during childhood the maturation of both gray and white matter roughly follow a posterior-to-anterior gradient, with more anterior/frontal regions developing last (Giedd et al., 1999; Sowell et al., 2002). Furthermore, it is well established that during cortical maturation, white matter within posterior sensory areas develop first whereas anterior association areas develop at a later stage (Eluvathingal et al., 2007; Flechsig, 1901; Paus et al., 1999; Sowell et al., 2004; Yakovlev and Lecours, 1967). For example, primary visual cortex is one of the first regions to develop fully formed myelin sheaths, whereas anterior association regions begin myelination much later in development and continue to undergo myelination until the second or third decade of life (Hayakawa et al., 1991; Kinney et al., 1988). Additionally, the “last-in-first-out” hypothesis is also reflected by a rank ordering based on effect sizes for each tract for the age difference in FA (genu > R UF > L UF > R ILF > L ILF > R CB > L CB > splenium), and suggests the same general pattern consistent with the last-in, first-out hypothesis: tracts showing the largest effects in the current study are the same tracts that tend to develop later in the first decade of life (Dubois et al., 2008; Eluvathingal et al., 2007). For example, the occipito-temporal segment of the ILF showed a greater age effect in FA than more anterior regions of the fiber tract; the boundary between occipital and temporal cortices is a late-myelinating region (Flechsig, 1901), and hence, the first-in-last-out hypothesis—but not the gradient hypothesis—would predict early age-related white matter decline in this region.
The effects of age on white matter architecture are complex and cannot be completely explained by the anterior-posterior gradient. Notably, (1) not all fiber systems observe this pattern, and (2) age-related differences in RD (Figure 3) did not appear to observe the same anterior-posterior pattern as observed in FA (Figure 2). One explanation for this discrepancy may be that FA describes only a general pattern of age-related changes in white matter, and taken as individual components AD and RD may represent qualitatively different patterns not dependent on position along an anterior-posterior axis. A more precise description of age-related change necessitates both a greater spatial specificity to the previously described anterior-posterior gradient, as well as complimentary metrics of white matter health such as RD and AD. Therefore, a description of the whole-brain pattern of age-related changes may not be best described by the anteroposterior extent but instead by the developmental history of the region the tract traverses.
Radial vs. Axial Diffusivity
The second main finding of the study was the effects aging on white matter and their impacts on cognitive performance were stronger for RD than for AD measures (See Table 3 and Figures 2 and 3). Taken together with previous neurobiological studies (Song et al., 2005; Sun et al., 2007; Trip et al., 2006) and complementary findings in callosectomy patients (Concha et al., 2006) and MS (Schmierer et al., 2004) suggesting dissociations between RD/myelination and AD/axonal integrity, this finding suggests that age-related differences in FA are more likely driven by myelodegeneration than by a loss of axonal integrity. When compared directly, the age-related changes associated with AD to that of RD in the genu, CB (left and right), and UF (left and right) all showed significant Age x Diffusivity Measure interactions. Moreover, no white matter regions investigated herein showed significant differences in AD within the conservative constraints of the present study (p < 0.01). Thus, the current finding lends considerable support to the idea that age-related changes in white matter are largely driven by changes in myelination rather than by gross morphological changes in the axons themselves (Bartzokis, 2004). It should be noted that increases in RD likely reflects other systematic age-related changes in the characteristics of white matter tracts aside from demyelination, including reductions in the concentration of neuroglia and changes associated with gliosis (Beaulieu and Allen, 1994). While there has been no direct link between diffusivity measures as recorded from DTI and post mortem analysis of myelin content in healthy older adult humans, the observation from previous studies that oligodendrocytes and other myelin-supporting glia are particularly susceptible to the effects of aging (Bartzokis et al., 2004; Peters and Sethares, 2002) nonetheless suggests a link between RD and the health of myelin in the aging brain. Furthermore, a recent analysis of post mortem MS brain tissue has shown FA and RD—but not AD—to be significant predictors of myelin content (Schmierer et al., 2004), providing some of the most compelling support for the relationship between RD and myelin content. Future post mortem studies investigating the relationship between diffusivity measures and histological markers of myelin content (e.g., via myelin staining) within brain tissue from healthy older adults are necessary to provide further support for this hypothesis.
Previously, we discussed how the observed age differences in white matter integrity followed an anterior-posterior gradient and that this gradient could, in turn, be explained by last-in-first-out hypothesis of development and aging. The current pattern of age-related differences in RD can also be readily understood within this last-in-first-out framework. For example, developmental studies have shown that white matter near cortical association areas that develop later in maturation (Lebel et al., 2008) also shows the earliest age-related decline in myelination (Bartzokis, 2004; Raz et al., 1997; Yakovlev and Lecours, 1967). This idea is supported in the current results, with fibers near frontal and temporal association cortex showing the largest group differences in RD (See Table 3). Moreover, a rank ordering of the effect size in the group comparison of RD—(R CB > L ILF > L CB > R ILF > genu > R UF > L UF > splenium) makes clear the observation that this pattern of age-related decline may at least partially invert the sequence of myelination observed during childhood and development. While studies using larger age ranges will be necessary to test this idea directly, the current findings demonstrates the differences between generalized patterns of white matter decline (i.e., the anterior-posterior gradient), and patterns that may be more representative of the degree of myelination.
These results compliment recent DTI studies of infants (Gao et al., 2008) and young adults (Lebel et al., 2008) that demonstrate that many of the same frontal fiber systems (e.g., UF, CB) mature later in development than more posterior fiber systems (e.g., ILF). A similar pattern was shown within interhemispheric fiber systems, with the splenium finishing major development before the genu. Later-myelinating regions have been shown to have a greater prevalence of smaller axons, which have thinner myelin sheaths (Lamantia and Rakic, 1990) making them more vulnerable to the effects of age. Oligodendrocytes in these later regions have also been shown to support a greater number of myelin sheaths (~50) than oligodendrocytes in earlier-myelinating regions (10 or less), which may make those regions more susceptible to oxidation (Husain and Juurlink, 1995) and amyloid beta-protein neurotoxicity (Geula et al., 1998). While more work is necessary to provide a comprehensive in vivo analysis of these effects, the current results provide strong support for a primary myelin-dependent mechanism underlying this pattern of age-related changes in white matter.
In addition to the general effect of aging on RD vs. AD, results found RD to be a better predictor cognitive performance in older adults. In fact, most of the diffusivity-behavior correlations evaluated in the current study were significantly greater for RD than AD. This finding provides even further support for the myelodegenerative hypotheses of aging, in that the same behavioral correlations between performance and general white matter integrity (i.e., FA) were mirrored in correlations between performance and a measure of myelination (i.e., RD). While it is relatively well established that white matter plays a critical role in mediating cognitive performance (Wozniak and Lim, 2006), the current findings link these behaviors with a specific component of the diffusion imaging signal (RD) and the cellular structure it may represent (myelin). While further research is needed to validate these in vivo assessments of myelination (e.g., through the complementary use of other imaging methods such as magnetization transfer imaging), the current results offer strong support for the myelodegeneration hypothesis of aging (Bartzokis, 2004) and suggest a prominent role for this metric in future analyses of lifespan data.
Tract-Function Specificity
Finally, the study found that the effects of aging on particular white matter tracts had an impact on specific cognitive functions, with anterior tracts primarily associated with executive tasks and posterior tracts mainly associated with visual memory tasks. Within anterior tracts, FA and RD within the genu correlated significantly with Spatial Span, a measure of working memory ability. The fact that this correlation was observed only in older adults suggests the cross-hemispheric communication engendered by this tract may be important for maintaining cognitive performance in these subjects (Cabeza, 2002; Daselaar and Cabeza, 2005; Sullivan et al., 2006). Additionally, the right UF, which connects anterior temporal and infero-frontal regions, showed significant correlations with Spatial Working Memory and Intra-Extra Dimensional Set Shifting tasks, both measures of executive functioning. This structure likely plays a significant role in mediating executive and memory functions (Markowitsch, 1995), and recent DTI tractography studies have shown it to be degraded in neuropsychological patients who exhibit executive impairments (Price et al., 2008; Yasmin et al., 2008). In accord with previous functional imaging studies, the results thus demonstrate the importance of frontotemporal connectivity for successful performance in healthy aging (Daselaar et al., 2006; e.g., Grady et al., 1995; Gutchess et al., 2005).
Turning to tracts connecting posterior regions of the cerebrum, the CB, ILF, and splenium showed significant correlations with scores on the Paired Associate Learning and Pattern Recognition Memory tests. These tests use abstract figures to evaluate visual memory performance, which is functionally supported by the temporal, parietal and occipital regions connected by these tracts (Gould et al., 2003). Previous studies have shown paired associate learning to show significant age-related decline (Rabbitt and Lowe, 2000), and it is well established that older adults have more general impairments in visuospatial processing (Madden et al., 2006; Madden et al., 2002). The left CB showed a significant relationship with visual memory performance, and this finding provides further evidence that this white matter structure, and the cingulate cortex it traverses, subserve evaluative functions, such as monitoring sensory events in the service of spatial orientation and memory (Vogt et al., 1992).
All told, the observed relationships between white matter structure and cognitive performance are consistent with previous DTI studies using both younger and older adults. The present findings expand upon previous work by demonstrating that observed morphological changes attributable to distinct components of the diffusion signal may be an important mechanism of age-related cognitive decline. The results further suggest that the effects of aging on individual white matter tracts influence specific cognitive functions reliant on the distributed neural systems underlying successful performance.
Limitations of the Current Study
Though the method presented here represents a novel algorithm for assessing the effects of aging on long white mater association fibers, the findings from the current study must be qualified with some caveats. Although the pattern of age-related differences in the CB and UF show that both tracts demonstrate a linear gradient of change, the extent to which this trend extends to other fiber systems may be dependent on local anatomy, especially for tracts which do not observe an anterior-posterior trajectory. As noted above, the progression of white matter development over the lifespan is complex and cannot be fully characterized by a linear gradient. We show here neuroimaging evidence that the observed trends may be a consequence of a more specific underlying pathology, such as myelin degeneration. However, the inferences drawn from neuroimaging data largely rely on previous research, and it is possible that the observed changes in RD may be due to changes not in myelin but instead to the extracellular matrix within the white matter; DTI alone cannot differentiate with certainty between intracellular and extracellular morphological changes in brain tissue, nor between effects to neurons or to glia. It is likely that combinations of newer imaging methods will likely provide a more definitive explanation to the mechanism underling age-related changes in white matter in vivo. While previous methodological studies of white matter have demonstrated that DTI tractography provides fiber tracts that have been shown to be highly representative of the underlying white matter anatomy (Burgel et al., 2006; Wakana et al., 2007), newer sampling methods which are less susceptible to partial volume effects (Jensen et al., 2005) may improve the inferences made on DTI imaging data. More practically, current methods of characterizing well-known fiber systems using seed-based tractography are typically time-consuming and are susceptible to human errors during tract tracing; more recent techniques relying on automated classification algorithms of these fiber systems (O’Donnell and Westin, 2006) will likely improve the efficacy of this technique. As noted above, more work is necessary to describe the correspondence between deterministic (e.g., seed-based tractography) and probabilistic (e.g., TBSS) methods, as well as how well these methods characterize the complex architecture of white matter (Goodlett et al., 2008; Ronen et al., 2005). The success of future age-related studies of white matter structure will likely rely on the ability of tractography to compliment voxel-based analyses, and the extent to which these methods can dissociate tract-specific from regionally-specific effects. The present analysis nonetheless adds contribution to the current literature by carefully examining diffusion characteristics not only within particular fiber systems, but along the spatial trajectory of those fiber systems.
Conclusions
In summary, the DTI tractography findings presented here make three significant contributions to the literature characterizing age-related changes in white matter integrity. First, DTI tractography results support an anterior-posterior gradient in age-related white matter degradation within specific long-range white matter tracts traversing frontal and parietal cortex. This finding demonstrates a gradual age-related decline in white matter integrity along the anteroposterior extent of a tract, rather than a localized frontal degradation. Second, the age-related deficits in white matter integrity and their impact on cognitive performance were greater for RD than for AD, suggesting that the observed trends may reflect demyelination. Finally, cognitive performance in older adults was correlated with the integrity of specific white matter tracts throughout the cerebrum: frontal tracts were found to predict executive or working memory functions and more posterior white matter tracts were found to predict visual memory performance. Taken together the results characterize age-related changes in white matter integrity and their role in age-related cognitive decline.
Supplementary Material
Effects of age on fractional anisotropy values per slice from frontal to occipital brain regions, from a TBSS-based voxelwise analysis. Trend analysis yielded a significant linear-but not quadratic-anterior-posterior increase in age-related difference along the y-axis. The "*" denotes a "temporal bump" within the whole-brain mask, largely localized to the posterior temporal lobe and also reflected in the tractography of an age-related difference in FA for the ILF (see Figure 2).
Acknowledgments
This work was supported by a NIH grants AG19731 to RC and AG011622 to DJM. NAD was supported by NIA grant T32 AG000029. The authors would like to thank Amber Baptiste-Tarter forassistance in participant recruitment, Jared Stokes, Vanessa A. Thomas, Matthew Emery and Jamaur Bronner for assistance with data collection, and Josh Bizzell and James Kragel foranalysis support.
Footnotes
Publisher's Disclaimer: This is a PDF file of an unedited manuscript that has been accepted for publication. As a service to our customers we are providing this early version of the manuscript. The manuscript will undergo copyediting, typesetting, and review of the resulting proof before it is published in its final citable form. Please note that during the production process errors may be discovered which could affect the content, and all legal disclaimers that apply to the journal pertain.
References
- Ashburner J, Friston KJ. Voxel-based morphometry--the methods. Neuroimage. 2000;11:805–821. doi: 10.1006/nimg.2000.0582. [DOI] [PubMed] [Google Scholar]
- Bartzokis G. Age-related myelin breakdown: a developmental model of cognitive decline and Alzheimer’s disease. Neurobiol Aging. 2004;25:5–18. doi: 10.1016/j.neurobiolaging.2003.03.001. author reply 49–62. [DOI] [PubMed] [Google Scholar]
- Bartzokis G, Sultzer D, Lu PH, Nuechterlein KH, Mintz J, Cummings JL. Heterogeneous age-related breakdown of white matter structural integrity: implications for cortical “disconnection” in aging and Alzheimer’s disease. Neurobiol Aging. 2004;25:843–851. doi: 10.1016/j.neurobiolaging.2003.09.005. [DOI] [PubMed] [Google Scholar]
- Basser PJ, Pajevic S, Pierpaoli C, Duda J, Aldroubi A. In vivo fiber tractography using DT-MRI data. Magn Reson Med. 2000;44:625–632. doi: 10.1002/1522-2594(200010)44:4<625::aid-mrm17>3.0.co;2-o. [DOI] [PubMed] [Google Scholar]
- Bassett DL. A Stereoscopic Atlas of Human Anatomy. Portland: Sawyer’s Inc; 1952. [Google Scholar]
- Beaulieu C, Allen PS. Determinants of anisotropic water diffusion in nerves. Magn Reson Med. 1994;31:394–400. doi: 10.1002/mrm.1910310408. [DOI] [PubMed] [Google Scholar]
- Bhagat YA, Beaulieu C. Diffusion anisotropy in subcortical white matter and cortical gray matter: changes with aging and the role of CSF-suppression. J Magn Reson Imaging. 2004;20:216–227. doi: 10.1002/jmri.20102. [DOI] [PubMed] [Google Scholar]
- Bucur B, Madden DJ, Spaniol J, Provenzale JM, Cabeza R, White LE, Huettel SA. Age-related slowing of memory retrieval: Contributions of perceptual speed and cerebral white matter integrity. Neurobiol Aging. 2007 doi: 10.1016/j.neurobiolaging.2007.02.008. [DOI] [PMC free article] [PubMed] [Google Scholar]
- Burgel U, Amunts K, Hoemke L, Mohlberg H, Gilsbach JM, Zilles K. White matter fiber tracts of the human brain: three-dimensional mapping at microscopic resolution, topography and intersubject variability. Neuroimage. 2006;29:1092–1105. doi: 10.1016/j.neuroimage.2005.08.040. [DOI] [PubMed] [Google Scholar]
- Cabeza R. Hemispheric asymmetry reduction in older adults: the HAROLD model. Psychol Aging. 2002;17:85–100. doi: 10.1037//0882-7974.17.1.85. [DOI] [PubMed] [Google Scholar]
- Catani M, Howard RJ, Pajevic S, Jones DK. Virtual in vivo interactive dissection of white matter fasciculi in the human brain. Neuroimage. 2002;17:77–94. doi: 10.1006/nimg.2002.1136. [DOI] [PubMed] [Google Scholar]
- Concha L, Gross DW, Wheatley BM, Beaulieu C. Diffusion tensor imaging of time-dependent axonal and myelin degradation after corpus callosotomy in epilepsy patients. Neuroimage. 2006;32:1090–1099. doi: 10.1016/j.neuroimage.2006.04.187. [DOI] [PubMed] [Google Scholar]
- Corouge I, Fletcher PT, Joshi S, Gouttard S, Gerig G. Fiber tract-oriented statistics for quantitative diffusion tensor MRI analysis. Med Image Anal. 2006;10:786–798. doi: 10.1016/j.media.2006.07.003. [DOI] [PubMed] [Google Scholar]
- Curran EJ. A new association fiber tract in the cerebrum. With remarks on the fiber tract dissection of studying the brain. J Comp Neurol. 1909;19:645–656. [Google Scholar]
- Daselaar SM, Browndyke J, Cabeza R. Functional neuroimaging of cognitive aging. In: Cabeza R, Kingstone A, editors. Handbook of Functional Neuroimaging of Cognition. 2. MIT Press; 2006. [Google Scholar]
- Daselaar SM, Cabeza R. Age-related Changes in Hemispheric Organization. In: Cabeza R, Nyberg L, Park DC, editors. Cognitive Neuroscience of Aging. Oxford: Oxford University Press; 2005. [Google Scholar]
- Dubois J, Dehaene-Lambertz G, Perrin M, Mangin JF, Cointepas Y, Duchesnay E, Le Bihan D, Hertz-Pannier L. Asynchrony of the early maturation of white matter bundles in healthy infants: quantitative landmarks revealed noninvasively by diffusion tensor imaging. Hum Brain Mapp. 2008;29:14–27. doi: 10.1002/hbm.20363. [DOI] [PMC free article] [PubMed] [Google Scholar]
- Duvernoy H. The Human Brain, Surface, Blood Supply, and Three-Dimensional Sectional Anatomy. Vienna: Springer-Verlag; 1999. [Google Scholar]
- Ebeling U, von Cramon D. Topography of the uncinate fascicle and adjacent temporal fiber tracts. Acta Neurochir. 1992;115:143–148. doi: 10.1007/BF01406373. [DOI] [PubMed] [Google Scholar]
- Eluvathingal TJ, Hasan KM, Kramer L, Fletcher JM, Ewing-Cobbs L. Quantitative diffusion tensor tractography of association and projection fibers in normally developing children and adolescents. Cereb Cortex. 2007;17:2760–2768. doi: 10.1093/cercor/bhm003. [DOI] [PMC free article] [PubMed] [Google Scholar]
- Feldman ML, Peters A. Ballooning of myelin sheaths in normally aged macaques. J Neurocytol. 1998;27:605–614. doi: 10.1023/a:1006926428699. [DOI] [PubMed] [Google Scholar]
- Flechsig P. Developmental (myelogenetic) localisation of the cerebral cortex in the human subject. Lancet. 1901;2:1027–1029. [Google Scholar]
- Gao W, Lin W, Chen Y, Gerig G, Smith JK, Jewells V, Gilmore JH. Temporal and Spatial Development of Axonal Maturation and Myelination of White Matter in the Developing Brain. AJNR Am J Neuroradiol. 2008 doi: 10.3174/ajnr.A1363. [DOI] [PMC free article] [PubMed] [Google Scholar]
- Geula C, Wu CK, Saroff D, Lorenzo A, Yuan M, Yankner BA. Aging renders the brain vulnerable to amyloid beta-protein neurotoxicity. Nat Med. 1998;4:827–831. doi: 10.1038/nm0798-827. [DOI] [PubMed] [Google Scholar]
- Giedd JN, Blumenthal J, Jeffries NO, Castellanos FX, Liu H, Zijdenbos A, Paus T, Evans AC, Rapoport JL. Brain development during childhood and adolescence: a longitudinal MRI study. Nat Neurosci. 1999;2:861–863. doi: 10.1038/13158. [DOI] [PubMed] [Google Scholar]
- Giorgio A, Watkins KE, Douaud G, James AC, James S, De Stefano N, Matthews PM, Smith SM, Johansen-Berg H. Changes in white matter microstructure during adolescence. Neuroimage. 2008;39:52–61. doi: 10.1016/j.neuroimage.2007.07.043. [DOI] [PubMed] [Google Scholar]
- Glenn OA, Henry RG, Berman JI, Chang PC, Miller SP, Vigneron DB, Barkovich AJ. DTI-based three-dimensional tractography detects differences in the pyramidal tracts of infants and children with congenital hemiparesis. J Magn Reson Imaging. 2003;18:641–648. doi: 10.1002/jmri.10420. [DOI] [PubMed] [Google Scholar]
- Glisky EL, Polster MR, Routhieaux BC. Double dissociation between item and source memory. Neuropsychology. 1995;9:229–235. [Google Scholar]
- Glisky EL, Rubin SR, Davidson PS. Source memory in older adults: an encoding or retrieval problem? J Exp Psychol Learn Mem Cogn. 2001;27:1131–1146. doi: 10.1037//0278-7393.27.5.1131. [DOI] [PubMed] [Google Scholar]
- Goodlett CB, Fletcher PT, Gilmore JH, Gerig G. Group analysis of DTI fiber tract statistics with application to neurodevelopment. Neuroimage. 2008 doi: 10.1016/j.neuroimage.2008.10.060. [DOI] [PMC free article] [PubMed] [Google Scholar]
- Gould RL, Brown RG, Owen AM, ffytche DH, Howard RJ. fMRI BOLD response to increasing task difficulty during successful paired associates learning. Neuroimage. 2003;20:1006–1019. doi: 10.1016/S1053-8119(03)00365-3. [DOI] [PubMed] [Google Scholar]
- Grady CL, McIntosh AR, Horwitz B, Maisog JM, Ungerleider LG, Mentis MJ, Pietrini P, Schapiro MB, Haxby JV. Age-related reductions in human recognition memory due to impaired encoding. Science. 1995;269:218–221. doi: 10.1126/science.7618082. [DOI] [PubMed] [Google Scholar]
- Greenwood PM. The frontal aging hypothesis evaluated. J Int Neuropsychol Soc. 2000;6:705–726. doi: 10.1017/s1355617700666092. [DOI] [PubMed] [Google Scholar]
- Grieve SM, Williams LM, Paul RH, Clark CR, Gordon E. Cognitive aging, executive function, and fractional anisotropy: a diffusion tensor MR imaging study. AJNR Am J Neuroradiol. 2007;28:226–235. [PMC free article] [PubMed] [Google Scholar]
- Gutchess AH, Welsh RC, Hedden T, Bangert A, Minear M, Liu LL, Park DC. Aging and the neural correlates of successful picture encoding: frontal activations compensate for decreased medial-temporal activity. J Cogn Neurosci. 2005;17:84–96. doi: 10.1162/0898929052880048. [DOI] [PubMed] [Google Scholar]
- Hayakawa K, Konishi Y, Kuriyama M, Konishi K, Matsuda T. Normal brain maturation in MRI. Eur J Radiol. 1991;12:208–215. doi: 10.1016/0720-048x(91)90074-6. [DOI] [PubMed] [Google Scholar]
- Head D, Buckner RL, Shimony JS, Williams LE, Akbudak E, Conturo TE, McAvoy M, Morris JC, Snyder AZ. Differential vulnerability of anterior white matter in nondemented aging with minimal acceleration in dementia of the Alzheimer type: evidence from diffusion tensor imaging. Cereb Cortex. 2004;14:410–423. doi: 10.1093/cercor/bhh003. [DOI] [PubMed] [Google Scholar]
- Husain J, Juurlink BH. Oligodendroglial precursor cell susceptibility to hypoxia is related to poor ability to cope with reactive oxygen species. Brain Res. 1995;698:86–94. doi: 10.1016/0006-8993(95)00832-b. [DOI] [PubMed] [Google Scholar]
- Jensen JH, Helpern JA, Ramani A, Lu H, Kaczynski K. Diffusional kurtosis imaging: the quantification of non-gaussian water diffusion by means of magnetic resonance imaging. Magn Reson Med. 2005;53:1432–1440. doi: 10.1002/mrm.20508. [DOI] [PubMed] [Google Scholar]
- Kennedy KM, Erickson KI, Rodrigue KM, Voss MW, Colcombe SJ, Kramer AF, Acker JD, Raz N. Age-related differences in regional brain volumes: A comparison of optimized voxel-based morphometry to manual volumetry. Neurobiol Aging. 2008 doi: 10.1016/j.neurobiolaging.2007.12.020. [DOI] [PMC free article] [PubMed] [Google Scholar]
- Kier EL, Staib LH, Davis LM, Bronen RA. MR imaging of the temporal stem: anatomic dissection tractography of the uncinate fasciculus, inferior occipitofrontal fasciculus, and Meyer’s loop of the optic radiation. AJNR Am J Neuroradiol. 2004;25:677–691. [PMC free article] [PubMed] [Google Scholar]
- Kinney HC, Brody BA, Kloman AS, Gilles FH. Sequence of central nervous system myelination in human infancy. II. Patterns of myelination in autopsied infants. J Neuropathol Exp Neurol. 1988;47:217–234. doi: 10.1097/00005072-198805000-00003. [DOI] [PubMed] [Google Scholar]
- Lamantia AS, Rakic P. Cytological and quantitative characteristics of four cerebral commissures in the rhesus monkey. J Comp Neurol. 1990;291:520–537. doi: 10.1002/cne.902910404. [DOI] [PubMed] [Google Scholar]
- Landis JR, Koch GG. The measurement of observer agreement for categorical data. Biometrics. 1977;33:159–174. [PubMed] [Google Scholar]
- Lebel C, Walker L, Leemans A, Phillips L, Beaulieu C. Microstructural maturation of the human brain from childhood to adulthood. Neuroimage. 2008;40:1044–1055. doi: 10.1016/j.neuroimage.2007.12.053. [DOI] [PubMed] [Google Scholar]
- Madden DJ, Spaniol J, Bucur B, Whiting WL. Age-related increase in top-down activation of visual features. Q J Exp Psychol (Colchester) 2007;60:644–651. doi: 10.1080/17470210601154347. [DOI] [PMC free article] [PubMed] [Google Scholar]
- Madden DJ, Spaniol J, Costello MC, Bucur B, White LE, Cabeza R, Davis SW, Dennis NA, Provenzale JM, Huettel SA. Cerebral White Matter Integrity Mediates Adult Age Differences in Cognitive Performance. J Cogn Neurosci. doi: 10.1162/jocn.2009.21047. in press. [DOI] [PMC free article] [PubMed] [Google Scholar]
- Madden DJ, Spaniol J, Whiting WL, Bucur B, Provenzale JM, Cabeza R, White LE, Huettel SA. Adult age differences in the functional neuroanatomy of visual attention: A combined fMRI and DTI study. Neurobiol Aging. 2006 doi: 10.1016/j.neurobiolaging.2006.01.005. [DOI] [PMC free article] [PubMed] [Google Scholar]
- Madden DJ, Turkington TG, Provenzale JM, Denny LL, Langley LK, Hawk TC, Coleman RE. Aging and attentional guidance during visual search: functional neuroanatomy by positron emission tomography. Psychol Aging. 2002;17:24–43. doi: 10.1037//0882-7974.17.1.24. [DOI] [PMC free article] [PubMed] [Google Scholar]
- Madden DJ, Whiting WL, Huettel SA, White LE, MacFall JR, Provenzale JM. Diffusion tensor imaging of adult age differences in cerebral white matter: relation to response time. Neuroimage. 2004;21:1174–1181. doi: 10.1016/j.neuroimage.2003.11.004. [DOI] [PubMed] [Google Scholar]
- Markowitsch HJ. Which brain regions are critically involved in the retrieval of old episodic memory? Brain Res Brain Res Rev. 1995;21:117–127. doi: 10.1016/0165-0173(95)00007-0. [DOI] [PubMed] [Google Scholar]
- Meier-Ruge W, Ulrich J, Bruhlmann M, Meier E. Age-related white matter atrophy in the human brain. Ann N Y Acad Sci. 1992;673:260–269. doi: 10.1111/j.1749-6632.1992.tb27462.x. [DOI] [PubMed] [Google Scholar]
- Mori S, van Zijl PC. Fiber tracking: principles and strategies - a technical review. NMR Biomed. 2002;15:468–480. doi: 10.1002/nbm.781. [DOI] [PubMed] [Google Scholar]
- Moscovitch M, Winocur G. The neuropsychology of memory and aging. In: Craik FIM, Salthouse TA, editors. The Handbook of Aging and Cognition. Hillsdale, NJ: Lawrence Erlbaum Associates; 1992. pp. 315–372. [Google Scholar]
- O’Donnell L, Westin CF. High-dimensional white matter atlas generation and group analysis. Med Image Comput Comput Assist Interv Int Conf Med Image Comput Comput Assist Interv. 2006;9:243–251. [PubMed] [Google Scholar]
- O’Sullivan M, Jones DK, Summers PE, Morris RG, Williams SC, Markus HS. Evidence for cortical “disconnection” as a mechanism of age-related cognitive decline. Neurology. 2001;57:632–638. doi: 10.1212/wnl.57.4.632. [DOI] [PubMed] [Google Scholar]
- Owen AM, Morris RG, Sahakian BJ, Polkey CE, Robbins TW. Double dissociations of memory and executive functions in working memory tasks following frontal lobe excisions, temporal lobe excisions or amygdalo-hippocampectomy in man. Brain. 1996;119 ( Pt 5):1597–1615. doi: 10.1093/brain/119.5.1597. [DOI] [PubMed] [Google Scholar]
- Paus T, Zijdenbos A, Worsley K, Collins DL, Blumenthal J, Giedd JN, Rapoport JL, Evans AC. Structural maturation of neural pathways in children and adolescents: in vivo study. Science. 1999;283:1908–1911. doi: 10.1126/science.283.5409.1908. [DOI] [PubMed] [Google Scholar]
- Persson J, Nyberg L, Lind J, Larsson A, Nilsson LG, Ingvar M, Buckner RL. Structure-function correlates of cognitive decline in aging. Cereb Cortex. 2006;16:907–915. doi: 10.1093/cercor/bhj036. [DOI] [PubMed] [Google Scholar]
- Peters A, Moss MB, Sethares C. Effects of aging on myelinated nerve fibers in monkey primary visual cortex. J Comp Neurol. 2000;419:364–376. doi: 10.1002/(sici)1096-9861(20000410)419:3<364::aid-cne8>3.0.co;2-r. [DOI] [PubMed] [Google Scholar]
- Peters A, Sethares C. Aging and the myelinated fibers in prefrontal cortex and corpus callosum of the monkey. J Comp Neurol. 2002;442:277–291. doi: 10.1002/cne.10099. [DOI] [PubMed] [Google Scholar]
- Pfefferbaum A, Adalsteinsson E, Sullivan EV. Frontal circuitry degradation marks healthy adult aging: Evidence from diffusion tensor imaging. Neuroimage. 2005;26:891–899. doi: 10.1016/j.neuroimage.2005.02.034. [DOI] [PubMed] [Google Scholar]
- Price G, Cercignani M, Parker GJ, Altmann DR, Barnes TR, Barker GJ, Joyce EM, Ron MA. White matter tracts in first-episode psychosis: a DTI tractography study of the uncinate fasciculus. Neuroimage. 2008;39:949–955. doi: 10.1016/j.neuroimage.2007.09.012. [DOI] [PMC free article] [PubMed] [Google Scholar]
- Rabbitt P, Lowe C. Patterns of cognitive ageing. Psychol Res. 2000;63:308–316. doi: 10.1007/s004269900009. [DOI] [PubMed] [Google Scholar]
- Raz N. Aging of the Brain and Its Impact on Cognitive Performance: Integration of Structural and Functional Findings. In: Craik FIM, Salthouse TA, editors. The Handbook of Aging and Cognition. London: Lawrence Erlbaum; 2000. [Google Scholar]
- Raz N. The Aging Brain Observed in Vivo: Differential Changes and Their Modifiers. In: Cabeza R, Nyberg L, Park DC, editors. Cognitive Neuroscience of Aging. Oxford University Press; 2005. pp. 19–57. [Google Scholar]
- Raz N, Gunning FM, Head D, Dupuis JH, McQuain J, Briggs SD, Loken WJ, Thornton AE, Acker JD. Selective aging of the human cerebral cortex observed in vivo: differential vulnerability of the prefrontal gray matter. Cereb Cortex. 1997;7:268–282. doi: 10.1093/cercor/7.3.268. [DOI] [PubMed] [Google Scholar]
- Raz N, Lindenberger U, Rodrigue KM, Kennedy KM, Head D, Williamson A, Dahle C, Gerstorf D, Acker JD. Regional brain changes in aging healthy adults: general trends, individual differences and modifiers. Cereb Cortex. 2005;15:1676–1689. doi: 10.1093/cercor/bhi044. [DOI] [PubMed] [Google Scholar]
- Resnick SM, Pham DL, Kraut MA, Zonderman AB, Davatzikos C. Longitudinal magnetic resonance imaging studies of older adults: a shrinking brain. J Neurosci. 2003;23:3295–3301. doi: 10.1523/JNEUROSCI.23-08-03295.2003. [DOI] [PMC free article] [PubMed] [Google Scholar]
- Robbins TW, James M, Owen AM, Sahakian BJ, Lawrence AD, McInnes L, Rabbitt PM. A study of performance on tests from the CANTAB battery sensitive to frontal lobe dysfunction in a large sample of normal volunteers: implications for theories of executive functioning and cognitive aging. Cambridge Neuropsychological Test Automated Battery. J Int Neuropsychol Soc. 1998;4:474–490. doi: 10.1017/s1355617798455073. [DOI] [PubMed] [Google Scholar]
- Ronen I, Ugurbil K, Kim D. How Does DWI Correlate With White Matter Structures? MAGNETIC RESONANCE IN MEDICINE. 2005;54:317. doi: 10.1002/mrm.20542. [DOI] [PubMed] [Google Scholar]
- Sakuma H, Nomura Y, Takeda K, Tagami T, Nakagawa T, Tamagawa Y, Ishii Y, Tsukamoto T. Adult and neonatal human brain: diffusional anisotropy and myelination with diffusion-weighted MR imaging. Radiology. 1991;180:229–233. doi: 10.1148/radiology.180.1.2052700. [DOI] [PubMed] [Google Scholar]
- Salat DH, Kaye JA, Janowsky JS. Prefrontal gray and white matter volumes in healthy aging and Alzheimer disease. Arch Neurol. 1999;56:338–344. doi: 10.1001/archneur.56.3.338. [DOI] [PubMed] [Google Scholar]
- Salat DH, Tuch DS, Hevelone ND, Fischl B, Corkin S, Rosas HD, Dale AM. Age-related changes in prefrontal white matter measured by diffusion tensor imaging. Ann N Y Acad Sci. 2005;1064:37–49. doi: 10.1196/annals.1340.009. [DOI] [PubMed] [Google Scholar]
- Scahill RI, Frost C, Jenkins R, Whitwell JL, Rossor MN, Fox NC. A longitudinal study of brain volume changes in normal aging using serial registered magnetic resonance imaging. Arch Neurol. 2003;60:989–994. doi: 10.1001/archneur.60.7.989. [DOI] [PubMed] [Google Scholar]
- Schmierer K, Scaravilli F, Altmann DR, Barker GJ, Miller DH. Magnetization transfer ratio and myelin in postmortem multiple sclerosis brain. Ann Neurol. 2004;56:407–415. doi: 10.1002/ana.20202. [DOI] [PubMed] [Google Scholar]
- Smith SM, Jenkinson M, Johansen-Berg H, Rueckert D, Nichols TE, Mackay CE, Watkins KE, Ciccarelli O, Cader MZ, Matthews PM, Behrens TE. Tract-based spatial statistics: voxelwise analysis of multi-subject diffusion data. Neuroimage. 2006;31:1487–1505. doi: 10.1016/j.neuroimage.2006.02.024. [DOI] [PubMed] [Google Scholar]
- Smith SM, Jenkinson M, Woolrich MW, Beckmann CF, Behrens TE, Johansen-Berg H, Bannister PR, De Luca M, Drobnjak I, Flitney DE, Niazy RK, Saunders J, Vickers J, Zhang Y, De Stefano N, Brady JM, Matthews PM. Advances in functional and structural MR image analysis and implementation as FSL. Neuroimage. 2004;23(Suppl 1):S208–219. doi: 10.1016/j.neuroimage.2004.07.051. [DOI] [PubMed] [Google Scholar]
- Smith SM, Zhang Y, Jenkinson M, Chen J, Matthews PM, Federico A, De Stefano N. Accurate, robust, and automated longitudinal and cross-sectional brain change analysis. Neuroimage. 2002;17:479–489. doi: 10.1006/nimg.2002.1040. [DOI] [PubMed] [Google Scholar]
- Snook L, Paulson LA, Roy D, Phillips L, Beaulieu C. Diffusion tensor imaging of neurodevelopment in children and young adults. Neuroimage. 2005;26:1164–1173. doi: 10.1016/j.neuroimage.2005.03.016. [DOI] [PubMed] [Google Scholar]
- Song SK, Sun SW, Ju WK, Lin SJ, Cross AH, Neufeld AH. Diffusion tensor imaging detects and differentiates axon and myelin degeneration in mouse optic nerve after retinal ischemia. Neuroimage. 2003;20:1714–1722. doi: 10.1016/j.neuroimage.2003.07.005. [DOI] [PubMed] [Google Scholar]
- Song SK, Sun SW, Ramsbottom MJ, Chang C, Russell J, Cross AH. Dysmyelination revealed through MRI as increased radial (but unchanged axial) diffusion of water. Neuroimage. 2002;17:1429–1436. doi: 10.1006/nimg.2002.1267. [DOI] [PubMed] [Google Scholar]
- Song SK, Yoshino J, Le TQ, Lin SJ, Sun SW, Cross AH, Armstrong RC. Demyelination increases radial diffusivity in corpus callosum of mouse brain. Neuroimage. 2005;26:132–140. doi: 10.1016/j.neuroimage.2005.01.028. [DOI] [PubMed] [Google Scholar]
- Sowell ER, Thompson PM, Leonard CM, Welcome SE, Kan E, Toga AW. Longitudinal mapping of cortical thickness and brain growth in normal children. J Neurosci. 2004;24:8223–8231. doi: 10.1523/JNEUROSCI.1798-04.2004. [DOI] [PMC free article] [PubMed] [Google Scholar]
- Sowell ER, Trauner DA, Gamst A, Jernigan TL. Development of cortical and subcortical brain structures in childhood and adolescence: a structural MRI study. Dev Med Child Neurol. 2002;44:4–16. doi: 10.1017/s0012162201001591. [DOI] [PubMed] [Google Scholar]
- Sullivan EV, Adalsteinsson E, Hedehus M, Ju C, Moseley M, Lim KO, Pfefferbaum A. Equivalent disruption of regional white matter microstructure in ageing healthy men and women. Neuroreport. 2001;12:99–104. doi: 10.1097/00001756-200101220-00027. [DOI] [PubMed] [Google Scholar]
- Sullivan EV, Adalsteinsson E, Pfefferbaum A. Selective age-related degradation of anterior callosal fiber bundles quantified in vivo with fiber tracking. Cereb Cortex. 2006;16:1030–1039. doi: 10.1093/cercor/bhj045. [DOI] [PubMed] [Google Scholar]
- Sullivan EV, Pfefferbaum A. Diffusion tensor imaging and aging. Neurosci Biobehav Rev. 2006;30:749–761. doi: 10.1016/j.neubiorev.2006.06.002. [DOI] [PubMed] [Google Scholar]
- Sullivan EV, Rohlfing T, Pfefferbaum A. Quantitative fiber tracking of lateral and interhemispheric white matter systems in normal aging: Relations to timed performance. Neurobiol Aging. 2008 doi: 10.1016/j.neurobiolaging.2008.04.007. [DOI] [PMC free article] [PubMed] [Google Scholar]
- Sun SW, Liang HF, Schmidt RE, Cross AH, Song SK. Selective vulnerability of cerebral white matter in a murine model of multiple sclerosis detected using diffusion tensor imaging. Neurobiol Dis. 2007;28:30–38. doi: 10.1016/j.nbd.2007.06.011. [DOI] [PMC free article] [PubMed] [Google Scholar]
- Tang Y, Nyengaard JR. A stereological method for estimating the total length and size of myelin fibers in human brain white matter. J Neurosci Methods. 1997;73:193–200. doi: 10.1016/s0165-0270(97)02228-0. [DOI] [PubMed] [Google Scholar]
- Thomalla G, Glauche V, Koch MA, Beaulieu C, Weiller C, Rother J. Diffusion tensor imaging detects early Wallerian degeneration of the pyramidal tract after ischemic stroke. Neuroimage. 2004;22:1767–1774. doi: 10.1016/j.neuroimage.2004.03.041. [DOI] [PubMed] [Google Scholar]
- Trip SA, Wheeler-Kingshott C, Jones SJ, Li WY, Barker GJ, Thompson AJ, Plant GT, Miller DH. Optic nerve diffusion tensor imaging in optic neuritis. Neuroimage. 2006;30:498–505. doi: 10.1016/j.neuroimage.2005.09.024. [DOI] [PubMed] [Google Scholar]
- Vernooij MW, de Groot M, van der Lugt A, Ikram MA, Krestin GP, Hofman A, Niessen WJ, Breteler MM. White matter atrophy and lesion formation explain the loss of structural integrity of white matter in aging. Neuroimage. 2008;43:470–477. doi: 10.1016/j.neuroimage.2008.07.052. [DOI] [PubMed] [Google Scholar]
- Vogt BA, Finch DM, Olson CR. Functional heterogeneity in cingulate cortex: the anterior executive and posterior evaluative regions. Cereb Cortex. 1992;2:435–443. doi: 10.1093/cercor/2.6.435-a. [DOI] [PubMed] [Google Scholar]
- Wakana S, Caprihan A, Panzenboeck MM, Fallon JH, Perry M, Gollub RL, Hua K, Zhang J, Jiang H, Dubey P, Blitz A, van Zijl P, Mori S. Reproducibility of quantitative tractography methods applied to cerebral white matter. Neuroimage. 2007;36:630–644. doi: 10.1016/j.neuroimage.2007.02.049. [DOI] [PMC free article] [PubMed] [Google Scholar]
- Wakana S, Jiang H, Nagae-Poetscher LM, van Zijl PC, Mori S. Fiber tract-based atlas of human white matter anatomy. Radiology. 2004;230:77–87. doi: 10.1148/radiol.2301021640. [DOI] [PubMed] [Google Scholar]
- West RL. An application of prefrontal cortex function theory to cognitive aging. Psychol Bull. 1996;120:272–292. doi: 10.1037/0033-2909.120.2.272. [DOI] [PubMed] [Google Scholar]
- Wozniak JR, Lim KO. Advances in white matter imaging: a review of in vivo magnetic resonance methodologies and their applicability to the study of development and aging. Neurosci Biobehav Rev. 2006;30:762–774. doi: 10.1016/j.neubiorev.2006.06.003. [DOI] [PMC free article] [PubMed] [Google Scholar]
- Xu D, Mori S, Solaiyappan M, van Zijl PC, Davatzikos C. A framework for callosal fiber distribution analysis. Neuroimage. 2002;17:1131–1143. doi: 10.1006/nimg.2002.1285. [DOI] [PubMed] [Google Scholar]
- Yakovlev PI, Lecours AR. In: Regional Development of the Brain in Early Life. Minkowski A, editor. Boston: Blackwell Scientific; 1967. [Google Scholar]
- Yasmin H, Nakata Y, Aoki S, Abe O, Sato N, Nemoto K, Arima K, Furuta N, Uno M, Hirai S, Masutani Y, Ohtomo K. Diffusion abnormalities of the uncinate fasciculus in Alzheimer’s disease: diffusion tensor tract-specific analysis using a new method to measure the core of the tract. Neuroradiology. 2008 doi: 10.1007/s00234-007-0353-7. [DOI] [PubMed] [Google Scholar]
Associated Data
This section collects any data citations, data availability statements, or supplementary materials included in this article.
Supplementary Materials
Effects of age on fractional anisotropy values per slice from frontal to occipital brain regions, from a TBSS-based voxelwise analysis. Trend analysis yielded a significant linear-but not quadratic-anterior-posterior increase in age-related difference along the y-axis. The "*" denotes a "temporal bump" within the whole-brain mask, largely localized to the posterior temporal lobe and also reflected in the tractography of an age-related difference in FA for the ILF (see Figure 2).