Abstract
Transcriptional regulation is largely enacted by transcription factors (TFs) binding DNA. Large numbers of TF binding motifs have been revealed by ChIP-chip experiments followed by computational DNA motif discovery. However, the success of motif discovery algorithms has been limited when applied to sequences bound in vivo (such as those identified by ChIP-chip) because the observed TF–DNA interactions are not necessarily direct: Some TFs predominantly associate with DNA indirectly through protein partners, while others exhibit both direct and indirect binding. Here, we present the first method for distinguishing between direct and indirect TF–DNA interactions, integrating in vivo TF binding data, in vivo nucleosome occupancy data, and motifs from in vitro protein binding microarray experiments. When applied to yeast ChIP-chip data, our method reveals that only 48% of the data sets can be readily explained by direct binding of the profiled TF, while 16% can be explained by indirect DNA binding. In the remaining 36%, none of the motifs used in our analysis was able to explain the ChIP-chip data, either because the data were too noisy or because the set of motifs was incomplete. As more in vitro TF DNA binding motifs become available, our method could be used to build a complete catalog of direct and indirect TF–DNA interactions. Our method is not restricted to yeast or to ChIP-chip data, but can be applied in any system for which both in vivo binding data and in vitro DNA binding motifs are available.
An essential problem in molecular biology is the identification of DNA binding sites of transcription factors (TFs) in genomes. Small-scale experiments, such as DNase footprinting or EMSA, for identifying TF binding sites are laborious and not cost-effective for high-throughput studies. In recent years, the DNA binding specificities of TFs (for brevity, we use the term “motif” henceforth to mean a model of a TF's DNA binding specificity) have been characterized via high-throughput experimental technologies such as chromatin immunoprecipitation with microarray hybridization (ChIP-chip) (Ren et al. 2000; Iyer et al. 2001; Lieb et al. 2001) followed by computational motif discovery. Dozens of motif discovery algorithms have been developed thus far (Tompa et al. 2005), but their success in identifying motifs accurately has been limited. TF motifs are typically short and degenerate, which makes them difficult to distinguish from genomic background. An additional complication when considering in vivo TF binding data is that many factors do not act alone, but rather form complexes with other TFs and thus may bind DNA directly or indirectly, depending on the precise factors and environmental conditions.
Depending on the architecture of the TF complex, sequences bound by a complex may appear enriched in ChIP-chip experiments for all the participating TFs, although only one of them binds DNA directly. For example, the yeast TFs Mbp1 and Swi6 are known to form the MBF complex, which plays a crucial role in the regulation of the cell cycle (Koch et al. 1993). Swi6 binds Mbp1, and Mbp1 contacts DNA directly at ACGCGT sequences (Taylor et al. 2000). Another example is the yeast TF Dig1. Dig1 does not have an identifiable DNA binding domain, and a literature search does not reveal any evidence of Dig1 binding DNA directly. It is known, however, that Dig1 binds DNA indirectly as part of TF complexes together with Ste12 and Tec1 (Chou et al. 2006). In such cases where a TF does not bind DNA directly, the motifs one would expect to find enriched in a ChIP-chip experiment will correspond to interacting factors (Mbp1; Ste12 or Tec1) rather than the factor that was profiled (Swi6; Dig1).
Considering the situations above, it is not surprising that motif discovery algorithms often exhibit low accuracy on in vivo data. Especially when a TF is part of several complexes with different factors interacting directly with DNA, the sequences enriched in a ChIP-chip experiment may be a complex mixture of sequences that contain binding sites for the profiled factor and/or various interacting proteins.
Here, we analyzed 237 ChIP-chip data sets from Harbison et al. (2004) to determine the extent of direct versus indirect binding by TFs in the yeast Saccharomyces cerevisiae. For each ChIP-chip experiment, our method determines which motifs best explain the in vivo binding data (i.e., which motifs are significantly enriched in the ChIP-chip data set). To accurately infer direct interactions between TFs and DNA, DNA binding motifs that reflect the direct sequence preferences of TFs are needed. For this purpose, we utilized motifs for 139 yeast TFs generated from independent, in vitro protein binding microarray (PBM) experiments (Bulyk et al. 2001; Mukherjee et al. 2004; Berger et al. 2006) reported recently by Badis et al. (2008) and Zhu et al. (2009). All our analyses were performed using these 139 published, PBM-derived motifs; henceforth, we use the term “motif” to refer to PBM-derived motifs, unless otherwise indicated. Within living cells, TFs often compete with nucleosomes for DNA occupancy, so our approach also takes into account experimentally determined high-resolution, in vivo nucleosome positioning data (Lee et al. 2007).
We recovered many known cases of direct and indirect DNA binding by yeast TFs. In 61 of the 128 cases in which both ChIP-chip and PBM data are available (48%), the PBM-derived motif of the factor profiled in the ChIP-chip experiment is significantly enriched in the ChIP-chip data set. In the remaining data sets, the profiled factor is not significantly enriched, suggesting that either the ChIP-chip data are too noisy or the profiled TF might associate with DNA indirectly through interaction with other proteins. Some cases in which our analysis indicates indirect TF–DNA binding are supported by experimental evidence in the literature (e.g., Dig1 binds DNA indirectly through Ste12 or Tec1), while others are novel hypotheses. Our approach is not restricted to yeast data, but could be applied to metazoan ChIP data to improve identification of direct versus indirect TF targets.
Results
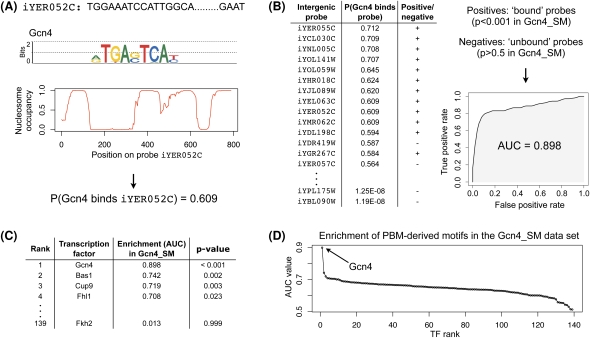
Our methodology is illustrated in Figure 1. Briefly, for each of 237 ChIP-chip data sets (Harbison et al. 2004), we compute the nucleosome-aware enrichment of each of the 139 TFs for which an in vitro, PBM-derived motif was available (Badis et al. 2008; Zhu et al. 2009). We report this enrichment as the area under a receiver operating characteristic (ROC) curve (AUC), which ranges from 0 to 1, with 1 corresponding to perfect enrichment. For each of the 237 ChIP-chip data sets, we sort the 139 TFs in decreasing order of their AUC values (Fig. 1C). To assess the significance of an AUC value for a particular motif, we calculate an empirical P-value by generating 1000 random motifs (see Methods) and then computing their AUC values for that ChIP-chip experiment. We consider a motif's AUC value to be significant in a ChIP-chip data set if it is at least 0.65 and has an associated P-value ≤ 0.001.
Figure 1.
Identification of highly enriched motifs in a ChIP-chip data set. We proceed in four steps: (A) For each TF with a PBM-derived motif (here, Gcn4) and each intergenic probe (here, iYER052c), we compute the probability that the TF binds that probe, as described in the Methods section. (B) For each TF (here, Gcn4) we rank all intergenic probes in decreasing order of the binding probability and then compute the enrichment of the motif in a ChIP-chip data set (here, Gcn4_SM) according to AUC. To calculate the AUC statistic, we defined the positive and negative sets to be the sets of intergenic regions with ChIP-chip P-values < 0.001 and >0.5, respectively, as calculated by Harbison et al. (2004). (C) For each ChIP-chip data set (here, Gcn4_SM), we ranked all TFs in decreasing order of their motif's AUC value. (D) We determine the significantly enriched motif(s) (here, Gcn4).
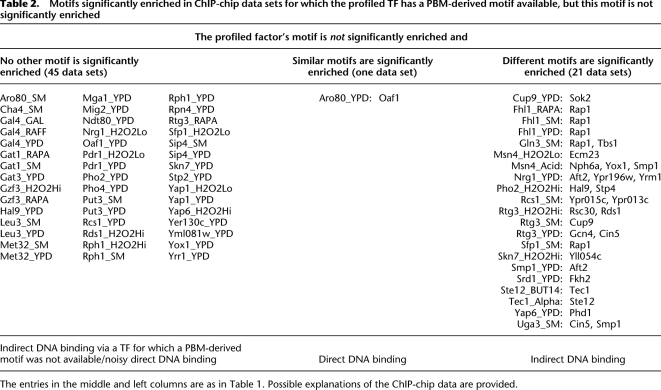
As an example, Figure 1D shows a plot of the AUC values of all PBM-derived motifs in the ChIP-chip data set Gcn4_SM. The motif of Gcn4 (the factor profiled in that ChIP-chip experiment) is the most highly enriched, with the second ranked motif having a significantly lower AUC value. Furthermore, the only significantly enriched motif (P-value ≤ 0.001) is that of Gcn4. Thus, in this case we conclude that the data set Gcn4_SM can be explained by direct DNA binding of the profiled factor. Surprisingly, many ChIP-chip data sets do not exhibit this behavior; i.e., the TF profiled in the ChIP-chip experiment is not significantly enriched (see Table 2, below). A number of these cases are described in more detail below. A complete list of AUC values and associated P-values for all 139 PBM-derived motifs in the 237 ChIP-chip experiments is available in Supplemental Table 1. A summary of direct and indirect TF–DNA interactions, inferred from our analysis of the 237 ChIP-chip data sets, is available in Supplemental Figure 1.
Table 2.
Motifs significantly enriched in ChIP-chip data sets for which the profiled TF has a PBM-derived motif available, but this motif is not significantly enriched
The entries in the middle and left columns are as in Table 1. Possible explanations of the ChIP-chip data are provided.
The rest of this section is organized into four main parts. The first three parts discuss three categories of ChIP-chip data sets: those for which the PBM-derived motif of the profiled factor is significantly enriched, as was true for Gcn4_SM (Table 1); those for which a PBM-derived motif of the profiled factor is available, but is not significantly enriched (Table 2); and those for which a PBM-derived motif for the profiled factor is not available (Table 3). For each of these three categories, we detail a few interesting cases where independent experimental data reported in the literature support our hypothesis of indirect TF–DNA interaction. In the fourth part, we discuss the utility of incorporating in vivo nucleosome occupancy data into our analysis, as compared with the use of either in vitro nucleosome data or no nucleosome data at all.
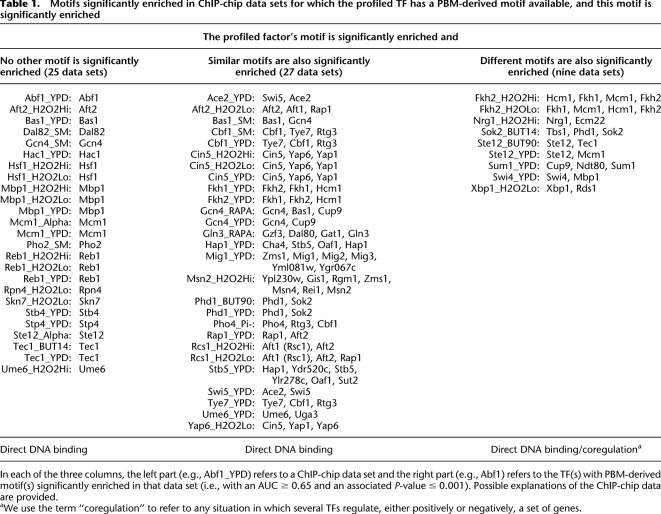
Table 1.
Motifs significantly enriched in ChIP-chip data sets for which the profiled TF has a PBM-derived motif available, and this motif is significantly enriched
In each of the three columns, the left part (e.g., Abf1_YPD) refers to a ChIP-chip data set and the right part (e.g., Abf1) refers to the TF(s) with PBM-derived motif(s) significantly enriched in that data set (i.e., with an AUC ≥ 0.65 and an associated P-value ≤ 0.001). Possible explanations of the ChIP-chip data are provided.
aWe use the term “coregulation” to refer to any situation in which several TFs regulate, either positively or negatively, a set of genes.
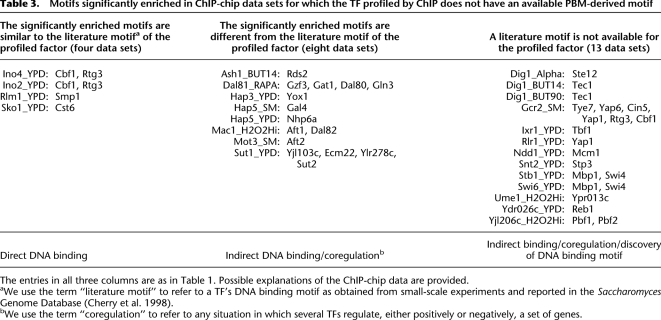
Table 3.
Motifs significantly enriched in ChIP-chip data sets for which the TF profiled by ChIP does not have an available PBM-derived motif
The entries in all three columns are as in Table 1. Possible explanations of the ChIP-chip data are provided.
aWe use the term “literature motif” to refer to a TF's DNA binding motif as obtained from small-scale experiments and reported in the Saccharomyces Genome Database (Cherry et al. 1998).
bWe use the term “coregulation” to refer to any situation in which several TFs regulate, either positively or negatively, a set of genes.
Fewer than half of the ChIP-chip data sets are readily explained by direct DNA binding of the profiled transcription factor
We first analyzed 128 ChIP-chip data sets for which a PBM-derived motif (Badis et al. 2008; Zhu et al. 2009) is available for the profiled factor. In fewer than half of these data sets the TF profiled in the ChIP-chip experiment is significantly enriched: in 25 cases the profiled TF is the only significantly enriched factor (Table 1, left column), in 27 cases the profiled factor and factors with similar DNA binding motifs are significantly enriched (Table 1, middle column), and in nine cases the profiled factor and factors with substantially different DNA binding motifs are significantly enriched (Table 1, right column).
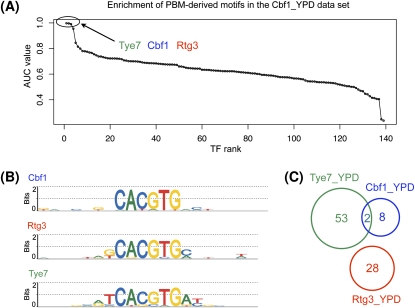
When the profiled TF is significantly enriched in the ChIP-chip data, we can be confident that the TF interacts directly with DNA in that condition. This is the case for ChIP-chip experiments of Abf1, Ace2, Aft2, Bas1, and 35 other TFs (Table 1). In most cases where more than one factor is significantly enriched, the enriched motifs are similar and their AUC values are almost identical. For example, in the Cbf1_YPD data set, three TFs have significant AUC values (Fig. 2A): Tye7 (AUC = 0.997), Cbf1 (AUC = 0.996), and Rtg3 (AUC = 0.991). In such cases, the enrichment of motifs for TFs other than the profiled factor may be due either to motif similarity or to an interaction between the factors. To determine whether a TF–TF interaction (here, Cbf1–Tye7, or Cbf1–Rtg3) is likely to occur, we computed the overlap between the sets of sequences bound in the ChIP-chip experiments for the TFs under consideration. If the sets of bound sequences have little or no overlap (as shown in Fig. 2C for the ChIP-chip data sets Tye7_YPD, Cbf1_YPD, and Rtg3_YPD), we conclude that the high AUC values for TFs other than the one profiled are due simply to motif similarity. This is the case for data set Cbf1_YPD: The high AUC values of Tye7 and Rtg3 are likely due to the similarity between the motifs of these two factors and the Cbf1 motif, and not to an indirect Cbf1–DNA interaction. Similar analyses for the other data sets in Table 1, middle column, showed that direct DNA binding of the profiled factor is the most likely explanation in all 27 cases.
Figure 2.
High-scoring motifs in the Cbf1_YPD ChIP-chip data set. (A) AUC values for the 139 PBM-derived motifs in the Cbf1_YPD data set. The x-axis shows the TF ranks, computed as in Figure 1C. (B) The three motifs that exhibit high AUC values in this data set: Tye7, Cbf1, and Rtg3. (C) Venn diagram showing the overlap among the sets of probes bound by Tye7, Cbf1, and Rtg3 in rich medium (YPD). Given the high similarity among the three motifs and the small overlap among the probes bound by the three factors, we do not consider this a case of indirect DNA binding by Cbf1.
In nine ChIP-chip experiments, the motifs of the significantly enriched TFs are not similar, although their AUC values are very close (Table 1, right column), suggesting that the enriched factors may be interacting, cooperating, or competing in the profiled conditions. Indeed, in seven of the nine cases, independent experimental evidence reported in the literature supports our conclusions of interaction, cooperation, or competition between significantly enriched factors and the factors profiled in the ChIP-chip experiments. The significant enrichment of Mcm1 in the ChIP-chip experiments of Fkh2 profiled in hyperoxic conditions can be explained by partial cooperation between the two factors, as described below in more detail. In the case of Sum1_YPD, Sum1 and Ndt80 have overlapping, yet distinct, sequence requirements for binding DNA, and they compete for binding to promoters containing the middle sporulation element (Pierce et al. 2003). Discussion of the other four cases supported by experimental evidence is available in the Supplemental material.
Mcm1 and Fkh2 partially cooperate in hyperoxic conditions
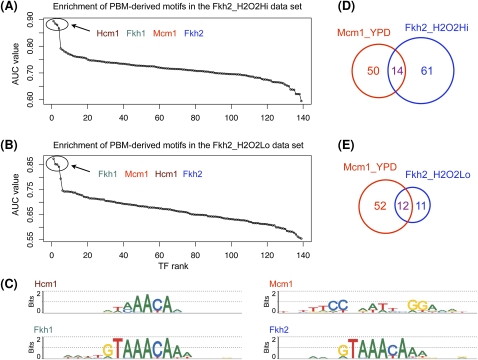
In the Fkh2_H2O2Hi and Fkh2_H2O2Lo data sets, we found four TFs with very high AUC values: Hcm1 (AUC = 0.894 and 0.851), Fkh1 (AUC = 0.885 and 0.874), Mcm1 (AUC = 0.880 and 0.852), and Fkh2 (AUC = 0.867 and 0.842). The motifs of Hcm1, Fhk1, and Fkh2 are very similar to each other, but different from that of Mcm1 (Fig. 3C). This suggests that the profiled factor Fkh2 and the apparently enriched Mcm1 interact or cooperate in highly and moderately hyperoxic media. Since the overlap between the probes bound by Fhk2 and Mcm1 is only partial (Fig. 3D,E), this case is probably best characterized as partial cooperation. Indeed, a literature search revealed extensive evidence for the cooperative DNA binding of Fkh2 and Mcm1 at promoters of cell-cycle genes (Hollenhorst et al. 2001).
Figure 3.
High-scoring motifs in the Fkh2_H2O2Hi and Fkh2_H2O2Lo ChIP-chip data sets. (A,B) AUC values for the 139 PBM-derived motifs in the two data sets. The x-axes show the TF ranks, computed as in Figure 1C. (C) Motifs significantly enriched in the two data sets. The DNA binding motif of Fkh2 was correctly identified as one of the significantly enriched motifs. In addition to Fkh2, the Hcm1, Fkh1, and Mcm1 motifs are also highly enriched. The Hcm1 and Fkh1 motifs are similar to the Fkh2 motif. Mcm1 is known to bind cooperatively with Fkh2 (Hollenhorst et al. 2001). (D,E) Venn diagrams showing the overlaps between the sets of probes bound by Fhk2 and Mcm1 in different environmental conditions.
Indirect TF–DNA interaction is suggested when the motif of the profiled TF is not significantly enriched in the ChIP-chip data
In 67 of the 128 ChIP-chip experiments for which a PBM-derived motif of the profiled factor is available, the motif is not significantly enriched in the corresponding ChIP-chip data set (Table 2). In 45 of the 67 cases, we found no motifs that explain the ChIP-chip data (Table 2, left column). At least two possible reasons could explain such cases: (1) the profiled factor binds DNA directly, but the ChIP-chip data are too noisy for this TF to appear significantly enriched, or (2) the profiled factor associates with DNA indirectly via a TF for which we did not have a PBM-derived motif available. The former might be true for data sets such as Azf1_YPD, Rds1_H2O2Hi, Sfp1_H2O2Lo, Skn7_YPD, Yap1_YPD, or Yap6_H2O2Hi, in which the profiled factor is one of the most enriched, although not enough to not pass our stringent significance criteria (AUC ≥ 0.65; P ≤ 0.001).
For one additional data set—Aro80_YPD—the only significantly enriched TF is Oaf1, a factor with a DNA binding motif similar to that of the profiled factor, Aro80 (Table 2, middle column). Given the similarity between the Aro80 and Oaf1 motifs, and the fact that the sets of sequences bound in the ChIP-chip experiments of these two factors do not overlap at all, we do not consider this to be a case of indirect DNA binding by Aro80.
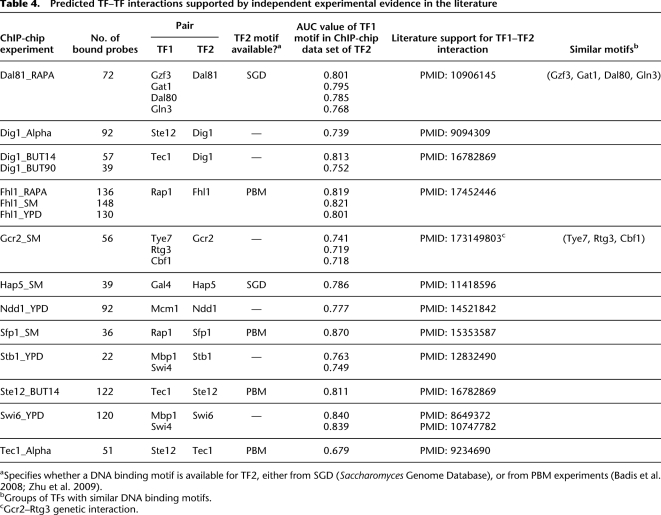
In the remaining 21 cases, the profiled TF does not pass the significance criteria, but factors with different DNA binding motifs do (Table 2, right column). In these cases, the ChIP-chip data might be explained by indirect association between DNA and the profiled TF, mediated by one of the factors whose motifs are significantly enriched. Supplemental Table 2 shows all the cases where our analysis indicates that a TF may bind DNA indirectly through another TF. Some interactions (Table 4, see below) are supported by independent experimental results reported in the literature, while the majority of the interactions represent novel predictions that remain to be verified in future laboratory experiments. We describe in more detail below examples for which independent experimental evidence in the literature supports the hypothesis of indirect DNA binding.
Table 4.
Predicted TF–TF interactions supported by independent experimental evidence in the literature
aSpecifies whether a DNA binding motif is available for TF2, either from SGD (Saccharomyces Genome Database), or from PBM experiments (Badis et al. 2008; Zhu et al. 2009).
bGroups of TFs with similar DNA binding motifs.
cGcr2–Rtg3 genetic interaction.
Sfp1 and Fhl1 are two factors that may bind DNA indirectly, in each case through Rap1
The PBM-derived motif of Sfp1 exhibits low enrichment in the Sfp1_SM data set, which suggests that it may not bind DNA directly, but rather as part of a TF complex. Our analysis suggests that Sfp1 binds DNA indirectly by interaction with Rap1. The Rap1 motif is the most highly enriched in the Sfp1_SM data set, with an AUC value of 0.870. The Sfp1 motif is ranked 44th, with much lower enrichment (AUC = 0.740) and an insignificant P-value (P = 0.597). Sfp1 is required for nutrient-dependent regulation of ribosome biogenesis (Fingerman et al. 2003) and cell size (Cipollina et al. 2008). Additionally, Sfp1 has been shown to regulate ribosomal protein (RP) gene transcription (Fingerman et al. 2003). It is not currently known whether binding of Sfp1 to RP gene promoters occurs through direct interaction with DNA or indirectly through other proteins such as Rap1 (Marion et al. 2004), an activator involved in many processes in S. cerevisiae, including transcriptional activation of RP genes (Mager and Planta 1990). Our data suggest the latter hypothesis is very likely, with Sfp1 binding RP promoters indirectly through Rap1.
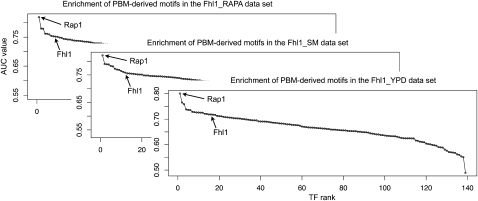
Fhl1 is another factor that may bind DNA indirectly in vivo, as part of a complex with Rap1 (and also possibly Ifh1 [Schawalder et al. 2004; Wade et al. 2004]). Fhl1 was profiled by ChIP-chip after treatment with rapamycin (RAPA), in starvation medium (SM), and in rich medium (YPD) (Fig. 4). In all three data sets, the only significantly enriched motif corresponds to Rap1 (AUC = 0.819, 0.821, and 0.801; P ≤ 0.001 in all three cases), while the Fhl1 motif ranks 10th, 12th, and 16th, with AUC values much lower than those of the Rap1 motif (AUC = 0.751, 0.758, and 0.718) and P-values that do not pass our significance threshold (P = 0.077, 0.082, and 0.114). Both Fhl1 and Rap1 associate with promoters of RP genes (Zhao et al. 2006), but Fhl1 does not appear to bind DNA directly. Rudra et al. (2005, 2007) showed that Fhl1 does not bind RP promoters directly in vitro, despite the fact that ChIP experiments clearly demonstrated that Fhl1 associates with these promoters in vivo. These investigators also found that deletion of the putative DNA binding domain of Fhl1 does not cause a significant growth defect, while mutation of a different domain (the forkhead-associated domain, which interacts with Ifh1) leads to severe defects in ribosome synthesis and growth. Additional evidence for the indirect DNA binding of Fhl1 through Rap1 comes from the work of Wade et al. (2004), who showed that although Fhl1 interacts almost exclusively with RP promoters, it does not associate with eight of the nine RP promoters that did not bind Rap1 in vivo. Furthermore, Wade et al. showed that at two of the three RP promoters tested by ChIP, the peaks of Fhl1 and Rap1 ChIP enrichment coincided. These independent experimental results support our conclusion that Fhl1 likely binds DNA indirectly in the examined culture conditions, most likely through interaction with Rap1.
Figure 4.
An example of indirect DNA association by a TF. The Rap1 motif is the only significantly enriched motif in all three Fhl1 ChIP-chip data sets: Fhl1_RAPA, Fhl1_SM, and Fhl1_YPD. The Fhl1 motif has only moderate AUC values and associated P-values that do not pass our significance criteria. We infer that in such cases many sequences identified as “bound” in the ChIP-chip experiments are actually indirectly bound by the profiled factor (here, Fhl1) through an interacting factor (here, Rap1).
Direct and indirect TF–DNA interactions can be revealed in the absence of a DNA binding motif for the profiled factor
Of the 237 ChIP-chip experiments we examined, 109 correspond to TFs for which a PBM-derived motif was not available. Although some of these factors have consensus DNA binding motifs reported in the literature, we chose not to include them in our analysis because such motifs are usually built from a small number of high-affinity DNA binding sites and may not correctly characterize medium- or low-affinity sites, which have been suggested to be abundant in vivo (Tanay 2006). Though a PBM-derived motif is not available for these factors, we can still analyze the AUC values of the 139 PBM-derived motifs to detect whether any of these motifs are significantly enriched.
In 25 of the 109 ChIP-chip data sets, we found at least one PBM-derived motif significantly enriched (Table 3). For four data sets (Table 3, left column), the significantly enriched PBM-derived motifs are similar to the DNA binding motifs of the profiled factors, as obtained from small-scale experimental studies and reported in the Saccharomyces Genome Database (Cherry et al. 1998); in these cases, the most likely explanation for the ChIP-chip data is direct DNA binding of the profiled factor. In the remaining 21 cases (Table 3, middle and right columns), indirect association between DNA and the profiled factor is a more likely explanation of the ChIP-chip data. Indeed, in several cases we found independent experimental evidence in the literature that confirms our hypothesis of indirect DNA association of the profiled TFs in certain environmental conditions (Table 4). We discuss in detail some of these cases below. A complete list of predicted TF–TF interactions is available in Supplemental Table 2.
Ste12 and Tec1 bind DNA either directly or indirectly, depending on the environmental condition
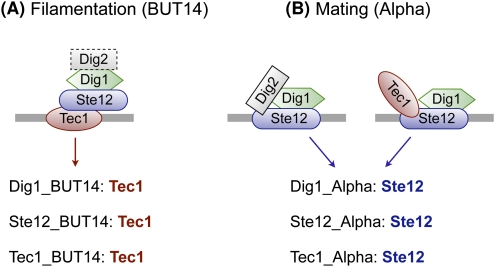
Our approach can recapitulate situations where a TF binds DNA either directly or indirectly, depending on the in vivo conditions. This is the case for Ste12 and Tec1, TFs involved in two distinct developmental programs: mating and filamentation (Chou et al. 2006). Chou and colleagues have shown that during mating—a process induced by treatment with alpha pheromone—promoters of mating genes are bound mostly by Ste12–Dig1–Dig2, but also by the Ste12–Tec1–Dig1 complex, with Ste12 binding DNA directly. During filamentation—a program induced by butanol treatment—promoters of most filamentation genes are bound by the Tec1–Ste12–Dig1 complex, with Tec1 binding DNA directly (Chou et al. 2006).
We analyzed the ChIP-chip data sets of Ste12, Tec1, and Dig1 in three environmental conditions: BUT14 (treatment with butanol for 14 h), YPD (rich medium), and Alpha (treatment with alpha pheromone). As shown in Figure 5, our results are consistent with current knowledge about complexes involved in regulation of mating and filamentation: Ste12 is the only significantly enriched factor in all three experiments performed in the Alpha condition, and Tec1 is the only significantly enriched factor in all three experiments performed in the BUT14 condition. In YPD, the Ste12 and Tec1 motifs are each enriched in their respective data sets. Dig1 is not currently known to bind DNA directly, but only through Ste12 or Tec1 during mating or filamentation, respectively; thus, it is not surprising that no motif was significantly enriched in the Dig1_YPD data set.
Figure 5.
Direct and indirect DNA binding by Ste12 and Tec1. Ste12 and Tec1 are both involved in two developmental processes: filamentation (induced by treatment with butanol, as in the BUT14 condition) and mating (induced by treatment with the alpha pheromone, as in the Alpha condition). (A) During filamentation, the Tec1-Ste12–Dig1 complex binds DNA through Tec1. Our method correctly identifies Tec1 as the only significantly enriched TF in the ChIP-chip experiments where filamentation occurs. (B) During mating, the Ste12–Dig1–Dig2 and Ste12–Tec1–Dig 1 complexes bind DNA through Ste12. Our method correctly identifies Ste12 as the only significantly enriched TF in the ChIP-chip experiments where mating occurs.
Our method performs best when using in vivo nucleosome occupancy data
The results described thus far were obtained by integrating in vivo nucleosome occupancy data with in vivo and in vitro TF binding data. When nucleosome occupancy data are not available, one might simply consider all DNA sites to be accessible for TF binding. We performed such an analysis on the yeast ChIP-chip data sets and found that using nucleosome occupancy information significantly improves the results of our analysis. More precisely, in 60% of the ChIP-chip data sets in which a significantly enriched motif was found (Supplemental Table 4), the maximum AUC value is higher when nucleosome occupancy information is used than when it is not used. For example, the AUC value for the Rap1 motif in the Rap1_YPD data set is 0.929 when using nucleosome data, and 0.895 when nucleosome occupancy data are not used. In contrast, in 71% of the data sets in which no motif was found to be significantly enriched (Supplemental Table 5), the maximum AUC value decreased when nucleosome occupancy data were used, which suggests that any observed motif enrichment may have been due to motif matches that are nonfunctional.
We also tested our method using in vitro nucleosome sequence preference data (Kaplan et al. 2009). As expected, the overall results were slightly better than when not using any nucleosome data at all, but worse than when using in vivo data. Furthermore, for a number of TFs the results were worse when using in vitro nucleosome data than no nucleosome data at all. For example, in the cases of Abf1, Rap1, and Reb1, factors that have been shown to remodel chromatin around their binding sites (Angermayr et al. 2003; Yarragudi et al. 2004; Kaplan et al. 2009), the AUC values are lower when using in vitro data (Abf1 AUC: 0.935; Rap1 AUC: 0.865; Reb1 AUCs: 0.840, 0.957, 0.916) than when not using nucleosome data (Abf1 AUC: 0.967; Rap1 AUC: 0.894; Reb1 AUCs: 0.852, 0.982, 0.952, respectively). Since nucleosome depletion around the binding sites of these TFs in vivo can be attributable to their own action, and not to the general properties of the DNA sequence, it is not surprising that for these TFs we get worse results using in vitro nucleosome data.
Discussion
In this study, we present a systematic method to distinguish between direct and indirect TF–DNA interactions by integrating three different types of genomic data sets: ChIP-chip data on in vivo TF occupancy; PBM data on direct, in vitro DNA binding motifs of TFs; and in vivo, genomic nucleosome occupancy data. Some TFs appear to be associated with genomic sites in vivo primarily by direct DNA binding, while other TFs seem capable of binding genomic regions in vivo either directly or indirectly. Notably, of the 128 ChIP-chip data sets for which a PBM-derived motif was available for the profiled factor, fewer than half could be explained as being primarily due to direct DNA binding by the profiled factor. Moreover, the in vivo binding of a number of TFs appears to be attributable to indirect association with the genome via at least one potential interacting TF.
A caveat of our approach is that it assumes the DNA binding specificity of a TF in vivo will be the same as the specificity observed in a PBM experiment. We analyzed 21 TFs for which the PBM-derived motifs were not significantly enriched in the ChIP experiments but for which in vivo experimentally determined motifs were reported in the Saccharomyces Genome Database (Cherry et al. 1998), to determine whether the low enrichment may be due to the TFs having different specificities in vivo. As shown in Supplemental Table 3, the in vivo motifs match the PBM-derived motifs, which suggests that the specificity of these TFs is similar in vivo and in vitro.
Previous to our study, Zhu et al. (2009) analyzed a number of ChIP-chip data sets to determine whether the profiled TFs bind DNA directly or indirectly. However, their methodology is very different from ours: For a given TF and a given intergenic sequence, Zhu and colleagues scored the sequence by summing PBM median signal intensities for each 8-mer, considering all the 8-mers with a PBM enrichment score above some threshold. In contrast, we score DNA sequences using a physically principled approach derived from GOMER (Granek and Clarke 2005), which takes into account the entire range of DNA binding affinities of the TF and thus avoids imposing thresholds on putative binding sites. Furthermore, our method can incorporate nucleosome occupancy data in a principled manner, for a more accurate distinction between direct and indirect in vivo TF–DNA interactions. Finally, we infer, and report in Table 4 and Supplemental Table 2, TF–TF interactions likely responsible for indirect DNA binding.
Liu et al. (2006) developed a method that uses nucleosome occupancy in addition to DNA binding motifs to improve detection of in vivo TF–DNA interactions. Nonetheless, Liu and colleagues incorporated nucleosome data by assuming an inhibitory effect of nucleosome occupancy and using a user-defined weight for this inhibitory effect (see Supplemental material). Moreover, Liu and colleauges applied their method to just one TF, Leu3, chosen specifically because it is known to bind DNA directly and does not have any known cofactors. Our method is much more general, and so it can be used for any TF, regardless of whether it binds DNA directly; furthermore, we were able to identify numerous cases of indirect DNA binding and associated TF–TF interactions.
The yeast ChIP-chip experiments of Harbison et al. (2004) were performed in rich medium (YPD) and 13 other culture conditions (see Methods). However, the nucleosome occupancy data used in our analysis were available only for yeast grown in YPD conditions. To analyze the importance of using nucleosome data in the same environmental condition as the ChIP-chip data, we considered a recent study by Shivaswamy et al. (2008), who reported nucleosome occupancy data for yeast grown in YPD before and after heat shock treatment (which corresponds to the YPD and HEAT conditions in the ChIP-chip data sets). Shivaswamy et al. (2008) showed that for some TFs, matches to their DNA binding motifs (MacIsaac et al. 2006) are more accessible in HEAT than in YPD. However, we found that in both of these conditions, functional DNA binding sites are in general more accessible than neighboring DNA sites (Supplemental Fig. 2), supporting our incorporation of nucleosome occupancy data in our analysis. Nevertheless, it would be preferable to use nucleosome occupancy data for yeast grown in the same environmental (and genetic) conditions as the yeast profiled by ChIP-chip. In the future, as additional high-resolution nucleosome occupancy data are generated for yeast grown in other culture conditions, such occupancy data could be easily incorporated into our analysis to provide more precise predictions of direct versus indirect binding events in the genome.
The approach described in this study is not restricted to yeast or to ChIP-chip data, but could be applied to the analysis of ChIP-seq (Johnson et al. 2007) or ChIP-PET (Wei et al. 2006) data sets for TFs in other organisms, including metazoans. With the generation of diverse PBM data sets for hundreds of metazoan TFs (Berger et al. 2008; Badis et al. 2009; Grove et al. 2009), this approach may not only distinguish direct versus indirect genomic TF binding events in vivo, but also suggest the identities of the interacting TFs.
Methods
ChIP-chip data
We used the yeast ChIP-chip data from Harbison et al. (2004), who performed 352 ChIP experiments for 207 TFs under different environmental conditions: YPD (rich medium), Acid (acidic medium), Alpha (alpha factor pheromone treatment), BUT14 (butanol treatment for 14h), BUT90 (butanol treatment for 90 min), GAL (galactose medium), H2O2Hi (highly hyperoxic), H2O2Lo (mildly hyperoxic), HEAT (elevated temperature), Pi- (phosphate deprived medium), RAFF (raffinose medium), RAPA (nutrient deprived), SM (amino acid starvation), and THI- (vitamin deprived). We use the notation TF_cond to refer to the ChIP-chip experiment for transcription factor “TF” under environmental condition “cond.” For each ChIP-chip data set, we defined the “bound” intergenic probes to be those with a P-value < 0.001. We restricted our analysis to the 237 (out of 352) data sets that contained at least 10 probes bound at P < 0.001.
PBM-derived DNA binding motifs
Badis et al. (2008) and Zhu et al. (2009) used universal PBMs (Berger et al. 2006) to determine high-resolution in vitro DNA binding specificity data for 139 TFs. They reported PBM-derived motifs for these TFs as position weight matrices (PWMs). We used all 89 PWMs of Zhu et al. (2009) and 50 additional PWMs from Badis et al. (2008).
Nucleosome positioning data
We used in vivo nucleosome positioning information from Lee et al. (2007) to compute, for each DNA site S, the probability that the site is occupied by a nucleosome. Lee et al. used micrococcal nuclease digestion followed by microarray analysis to derive a high-resolution map of nucleosome occupancy across the whole yeast S. cerevisiae genome. From this map we extracted, for every fourth position in the genome, the logarithm of the ratio between the signal intensity of nucleosomal DNA versus genomic DNA at that position, and then interpolated the data to obtain 1-bp resolution data. Next, we applied a logistic transformation to the log-ratio values to obtain, for each position in the genome, the probability of that position being occupied by a nucleosome (see Supplemental material for details).
Given a site S = S1…SW of width W and the probability of nucleosome occupancy at each position i in the site, we can compute the probability of site S being occupied by a nucleosome, or, alternatively, the probability of site S being free of nucleosomes:
 |
Each term P(Si+1 free | Si free) can be written as:
 |
where N is set to 147, the average nucleosome width.
Scoring a DNA sequence according to a PWM
We scored DNA sequences using a model similar to GOMER (Granek and Clarke 2005). Other models such as MatrixREDUCE (Foat et al. 2006) or TRAP (Roider et al. 2007) could also be used to compute the probability that a TF with a particular PWM binds a DNA sequence. However, both MatrixREDUCE and TRAP use parameters that need to be trained on the ChIP-chip data. Since we want to use the model to test how well certain motifs explain the ChIP-chip data, training those motifs on the data themselves would not be appropriate.
Let T denote a TF, and φ denote the PWM describing the DNA binding motif of T: φ(b,j) = the probability of finding base b at location j within the binding site (b ∈ {A, C, G, T} and 1 ≤ j ≤ W, where W is the width of the motif). Let φ0 denote the background model, a 0th-order Markov model trained on all intergenic sequences in yeast.
Given a DNA site S = S1S2…SW, we score it according to the PWM and background models, and use the ratio of the two scores as an approximation for the dissociation constant  . Next, using the fact that Kd(T,S) = [T] · [S]/[T · S], we can write the probability that TF T binds DNA site S as:
 |
where the concentration of free TF, [T], is set to the dissociation constant for the site with the optimal PWM score, as in the GOMER model (Granek and Clarke 2005).
For a DNA sequence X longer than the motif width W, the probability that TF T binds X is:
 |
Incorporating nucleosome positioning information
So far we assumed that the probability that a TF binds a DNA site depends only on the specificity of the factor for that particular site, which is a good assumption in the case of in vitro experiments. In vivo, however, many DNA regions are occupied by nucleosomes and thus are not accessible for binding by a TF. To take this into account, we first need to rewrite Equation 3 to include information about the accessibility of site S:
 |
The second equality follows from the assumption that sites occupied by nucleosomes have zero probability of being accessed by TFs. Although a few TFs have been observed to bind nucleosomal DNA, our assumption is true for the vast majority of factors.
Taking into account nucleosome occupancy information, Equation 4 can be rewritten as Equation 6, where P(Xi…Xi+W-1 free) is derived from the in vivo nucleosome occupancy data.
 |
Given a DNA sequence, a PBM-derived motif, and the nucleosome occupancy information over that sequence, we use Equation 6 to compute the probability that the TF binds that sequence, as shown in Figure 1A for TF Gcn4 and intergenic region iYER052C.
Analyzing data from a ChIP-chip experiment
We use the probability that a TF T binds a DNA sequence X to score every intergenic probe present on the microarrays used in the ChIP-chip experiments (Harbison et al. 2004). For example, Figure 1B shows the probability of TF Gcn4 binding each yeast intergenic region. Next, for any particular ChIP-chip experiment we define two sets of intergenic probes: the positive set (i.e., the set of “bound” probes), which contains all the probes with a P-value < 0.001, and the negative set (i.e., the set of “unbound” probes), which contains all the probes with a P-value > 0.5, as calculated by Harbison et al. (2004); we did not consider probes with intermediate P-values. Using the positive and negative sets from each ChIP-chip experiment, and the probabilities that TF T binds each of the probes, we compute the enrichment of the PBM-derived motif for TF T in the ChIP-chip data by an AUC value. For each ChIP-chip experiment TF_cond we computed the AUC values of the 139 DNA binding motifs derived from PBM data.
Computing the statistical significance of AUC values
To assess whether the AUC value computed for a PBM-derived motif in a particular ChIP-chip data set is significant, we proceeded in three steps: (1) We randomly generated 1000 motifs by permuting the nucleotides in each column of the initial motif; (2) for each random motif, we computed its AUC value in the given ChIP-chip data set; and (3) we used the 1000 AUC values to compute an empirical P-value for the AUC of the real motif. We consider an AUC value significant if it is at least 0.65 (i.e., it explains the ChIP-chip data to some extent) and has an associated P-value ≤ 0.001 (i.e., at most one of the 1000 random motifs has an AUC value equal to or greater than the AUC value of the real motif).
Acknowledgments
We thank C. Zhu and K. Byers for sharing pre-publication yeast PBM data, and R.P. McCord for helpful discussion and critical reading of the manuscript. This work was funded by grants from NIH (R01 HG003985, R01 HG003420) to M.L.B., and by an NSF CAREER award (0347801), an Alfred P. Sloan Research Fellowship, and grants from NIH (P50 GM081883-01, R01 ES015165-01) and DARPA (HR0011-08-1-0023, HR0011-09-1-0040) to A.J.H.
Footnotes
[Supplemental material is available online at http://www.genome.org.]
Article published online before print. Article and publication date are at http://www.genome.org/cgi/doi/10.1101/gr.094144.109.
References
- Angermayr M, Oechsner U, Bandlow W. Reb1p-dependent DNA bending effects nucleosome positioning and constitutive transcription at the yeast profilin promoter. J Biol Chem. 2003;278:17918–17926. doi: 10.1074/jbc.M301806200. [DOI] [PubMed] [Google Scholar]
- Badis G, Chan ET, van Bakel H, Pena-Castillo L, Tillo D, Tsui K, Carlson CD, Gossett AJ, Hasinoff MJ, Warren CL, et al. A library of yeast transcription factor motifs reveals a widespread function for Rsc3 in targeting nucleosome exclusion at promoters. Mol Cell. 2008;32:878–887. doi: 10.1016/j.molcel.2008.11.020. [DOI] [PMC free article] [PubMed] [Google Scholar]
- Badis G, Berger MF, Philippakis AA, Talukder S, Gehrke AR, Jaeger SA, Chan ET, Metzler G, Vedenko A, Chen X, et al. Diversity and complexity in DNA recognition by transcription factors. Science. 2009;324:1720–1723. doi: 10.1126/science.1162327. [DOI] [PMC free article] [PubMed] [Google Scholar]
- Berger MF, Philippakis AA, Qureshi AM, He FS, Estep PW, III, Bulyk ML. Compact, universal DNA microarrays to comprehensively determine transcription-factor binding site specificities. Nat Biotechnol. 2006;24:1429–1435. doi: 10.1038/nbt1246. [DOI] [PMC free article] [PubMed] [Google Scholar]
- Berger MF, Badis G, Gehrke AR, Talukder S, Philippakis AA, Pena-Castillo L, Alleyne TM, Mnaimneh S, Botvinnik OB, Chan ET, et al. Variation in homeodomain DNA binding revealed by high-resolution analysis of sequence preferences. Cell. 2008;133:1266–1276. doi: 10.1016/j.cell.2008.05.024. [DOI] [PMC free article] [PubMed] [Google Scholar]
- Bulyk ML, Huang X, Choo Y, Church GM. Exploring the DNA-binding specificities of zinc fingers with DNA microarrays. Proc Natl Acad Sci. 2001;98:7158–7163. doi: 10.1073/pnas.111163698. [DOI] [PMC free article] [PubMed] [Google Scholar]
- Cherry JM, Adler C, Ball C, Chervitz SA, Dwight SS, Hester ET, Jia Y, Juvik G, Roe T, Schroeder M, et al. SGD: Saccharomyces Genome Database. Nucleic Acids Res. 1998;26:73–79. doi: 10.1093/nar/26.1.73. [DOI] [PMC free article] [PubMed] [Google Scholar]
- Chou S, Lane S, Liu H. Regulation of mating and filamentation genes by two distinct Ste12 complexes in Saccharomyces cerevisiae. Mol Cell Biol. 2006;26:4794–4805. doi: 10.1128/MCB.02053-05. [DOI] [PMC free article] [PubMed] [Google Scholar]
- Cipollina C, van den Brink J, Daran-Lapujade P, Pronk JT, Porro D, de Winde JH. Saccharomyces cerevisiae SFP1: At the crossroads of central metabolism and ribosome biogenesis. Microbiology. 2008;154:1686–1699. doi: 10.1099/mic.0.2008/017392-0. [DOI] [PubMed] [Google Scholar]
- Fingerman I, Nagaraj V, Norris D, Vershon AK. Sfp1 plays a key role in yeast ribosome biogenesis. Eukaryot Cell. 2003;2:1061–1068. doi: 10.1128/EC.2.5.1061-1068.2003. [DOI] [PMC free article] [PubMed] [Google Scholar]
- Foat BC, Morozov AV, Bussemaker HJ. Statistical mechanical modeling of genome-wide transcription factor occupancy data by MatrixREDUCE. Bioinformatics. 2006;22:e141–e149. doi: 10.1093/bioinformatics/btl223. [DOI] [PubMed] [Google Scholar]
- Granek JA, Clarke ND. Explicit equilibrium modeling of transcription-factor binding and gene regulation. Genome Biol. 2005;6:R87. doi: 10.1186/gb-2005-6-10-r87. [DOI] [PMC free article] [PubMed] [Google Scholar]
- Grove CA, De Masi F, Barrasa MI, Newburger DE, Alkema MJ, Bulyk ML, Walhout AJ. A multiparameter network reveals extensive divergence between C. elegans bHLH transcription factors. Cell. 2009;138:314–327. doi: 10.1016/j.cell.2009.04.058. [DOI] [PMC free article] [PubMed] [Google Scholar]
- Harbison CT, Gordon DB, Lee TI, Rinaldi NJ, MacIsaac KD, Danford TW, Hannett NM, Tagne JB, Reynolds DB, Yoo J, et al. Transcriptional regulatory code of a eukaryotic genome. Nature. 2004;431:99–104. doi: 10.1038/nature02800. [DOI] [PMC free article] [PubMed] [Google Scholar]
- Hollenhorst PC, Pietz G, Fox CA. Mechanisms controlling differential promoter-occupancy by the yeast forkhead proteins Fkh1p and Fkh2p: Implications for regulating the cell cycle and differentiation. Genes & Dev. 2001;15:2445–2456. doi: 10.1101/gad.906201. [DOI] [PMC free article] [PubMed] [Google Scholar]
- Iyer VR, Horak CE, Scafe CS, Botstein D, Snyder M, Brown PO. Genomic binding sites of the yeast cell-cycle transcription factors SBF and MBF. Nature. 2001;409:533–538. doi: 10.1038/35054095. [DOI] [PubMed] [Google Scholar]
- Johnson DS, Mortazavi A, Myers RM, Wold B. Genome-wide mapping of in vivo protein-DNA interactions. Science. 2007;316:1497–1502. doi: 10.1126/science.1141319. [DOI] [PubMed] [Google Scholar]
- Kaplan N, Moore IK, Fondufe-Mittendorf Y, Gossett AJ, Tillo D, Field Y, LeProust EM, Hughes TR, Lieb JD, Widom J, et al. The DNA-encoded nucleosome organization of a eukaryotic genome. Nature. 2009;458:362–366. doi: 10.1038/nature07667. [DOI] [PMC free article] [PubMed] [Google Scholar]
- Koch C, Moll T, Neuberg M, Ahorn H, Nasmyth K. A role for the transcription factors Mbp1 and Swi4 in progression from G1 to S phase. Science. 1993;261:1551–1557. doi: 10.1126/science.8372350. [DOI] [PubMed] [Google Scholar]
- Lee W, Tillo D, Bray N, Morse RH, Davis RW, Hughes TR, Nislow C. A high-resolution atlas of nucleosome occupancy in yeast. Nat Genet. 2007;39:1235–1244. doi: 10.1038/ng2117. [DOI] [PubMed] [Google Scholar]
- Lieb JD, Liu X, Botstein D, Brown PO. Promoter-specific binding of Rap1 revealed by genome-wide maps of protein-DNA association. Nat Genet. 2001;28:327–334. doi: 10.1038/ng569. [DOI] [PubMed] [Google Scholar]
- Liu X, Lee CK, Granek JA, Clarke ND, Lieb JD. Whole-genome comparison of Leu3 binding in vitro and in vivo reveals the importance of nucleosome occupancy in target site selection. Genome Res. 2006;16:1517–1528. doi: 10.1101/gr.5655606. [DOI] [PMC free article] [PubMed] [Google Scholar]
- MacIsaac KD, Wang T, Gordon DB, Gifford DK, Stormo GD, Fraenkel E. An improved map of conserved regulatory sites for Saccharomyces cerevisiae. BMC Bioinformatics. 2006;7:113. doi: 10.1186/1471-2105-7-113. [DOI] [PMC free article] [PubMed] [Google Scholar]
- Mager WH, Planta RJ. Multifunctional DNA-binding proteins mediate concerted transcription activation of yeast ribosomal protein genes. Biochim Biophys Acta. 1990;1050:351–355. doi: 10.1016/0167-4781(90)90193-6. [DOI] [PubMed] [Google Scholar]
- Marion RM, Regev A, Segal E, Barash Y, Koller D, Friedman N, O'Shea EK. Sfp1 is a stress- and nutrient-sensitive regulator of ribosomal protein gene expression. Proc Natl Acad Sci. 2004;101:14315–14322. doi: 10.1073/pnas.0405353101. [DOI] [PMC free article] [PubMed] [Google Scholar]
- Mukherjee S, Berger MF, Jona G, Wang XS, Muzzey D, Snyder M, Young RA, Bulyk ML. Rapid analysis of the DNA-binding specificities of transcription factors with DNA microarrays. Nat Genet. 2004;36:1331–1339. doi: 10.1038/ng1473. [DOI] [PMC free article] [PubMed] [Google Scholar]
- Pierce M, Benjamin KR, Montano SP, Georgiadis MM, Winter E, Vershon AK. Sum1 and Ndt80 proteins compete for binding to middle sporulation element sequences that control meiotic gene expression. Mol Cell Biol. 2003;23:4814–4825. doi: 10.1128/MCB.23.14.4814-4825.2003. [DOI] [PMC free article] [PubMed] [Google Scholar]
- Ren B, Robert F, Wyrick JJ, Aparicio O, Jennings EG, Simon I, Zeitlinger J, Schreiber J, Hannett N, Kanin E, et al. Genome-wide location and function of DNA binding proteins. Science. 2000;290:2306–2309. doi: 10.1126/science.290.5500.2306. [DOI] [PubMed] [Google Scholar]
- Roider HG, Kanhere A, Manke T, Vingron M. Predicting transcription factor affinities to DNA from a biophysical model. Bioinformatics. 2007;23:134–141. doi: 10.1093/bioinformatics/btl565. [DOI] [PubMed] [Google Scholar]
- Rudra D, Zhao Y, Warner JR. Central role of Ifh1p–Fhl1p interaction in the synthesis of yeast ribosomal proteins. EMBO J. 2005;24:533–542. doi: 10.1038/sj.emboj.7600553. [DOI] [PMC free article] [PubMed] [Google Scholar]
- Rudra D, Mallick J, Zhao Y, Warner JR. Potential interface between ribosomal protein production and pre-rRNA processing. Mol Cell Biol. 2007;27:4815–4824. doi: 10.1128/MCB.02062-06. [DOI] [PMC free article] [PubMed] [Google Scholar]
- Schawalder SB, Kabani M, Howald I, Choudhury U, Werner M, Shore D. Growth-regulated recruitment of the essential yeast ribosomal protein gene activator Ifh1. Nature. 2004;432:1058–1061. doi: 10.1038/nature03200. [DOI] [PubMed] [Google Scholar]
- Shivaswamy S, Bhinge A, Zhao Y, Jones S, Hirst M, Iyer VR. Dynamic remodeling of individual nucleosomes across a eukaryotic genome in response to transcriptional perturbation. PLoS Biol. 2008;6:e65. doi: 10.1371/journal.pbio.0060065. [DOI] [PMC free article] [PubMed] [Google Scholar]
- Tanay A. Extensive low-affinity transcriptional interactions in the yeast genome. Genome Res. 2006;16:962–972. doi: 10.1101/gr.5113606. [DOI] [PMC free article] [PubMed] [Google Scholar]
- Taylor IA, McIntosh PB, Pala P, Treiber MK, Howell S, Lane AN, Smerdon SJ. Characterization of the DNA-binding domains from the yeast cell-cycle transcription factors Mbp1 and Swi4. Biochemistry. 2000;39:3943–3954. doi: 10.1021/bi992212i. [DOI] [PubMed] [Google Scholar]
- Tompa M, Li N, Bailey TL, Church GM, De Moor B, Eskin E, Favorov AV, Frith MC, Fu Y, Kent WJ, et al. Assessing computational tools for the discovery of transcription factor binding sites. Nat Biotechnol. 2005;23:137–144. doi: 10.1038/nbt1053. [DOI] [PubMed] [Google Scholar]
- Wade JT, Hall DB, Struhl K. The transcription factor Ifh1 is a key regulator of yeast ribosomal protein genes. Nature. 2004;432:1054–1058. doi: 10.1038/nature03175. [DOI] [PubMed] [Google Scholar]
- Wei CL, Wu Q, Vega VB, Chiu KP, Ng P, Zhang T, Shahab A, Yong HC, Fu Y, Weng Z, et al. A global map of p53 transcription-factor binding sites in the human genome. Cell. 2006;124:207–219. doi: 10.1016/j.cell.2005.10.043. [DOI] [PubMed] [Google Scholar]
- Yarragudi A, Miyake T, Li R, Morse RH. Comparison of ABF1 and RAP1 in chromatin opening and transactivator potentiation in the budding yeast Saccharomyces cerevisiae. Mol Cell Biol. 2004;24:9152–9164. doi: 10.1128/MCB.24.20.9152-9164.2004. [DOI] [PMC free article] [PubMed] [Google Scholar]
- Zhao Y, McIntosh KB, Rudra D, Schawalder S, Shore D, Warner JR. Fine-structure analysis of ribosomal protein gene transcription. Mol Cell Biol. 2006;26:4853–4862. doi: 10.1128/MCB.02367-05. [DOI] [PMC free article] [PubMed] [Google Scholar]
- Zhu C, Byers K, McCord R, Shi Z, Berger M, Newburger D, Saulrieta K, Smith Z, Shah M, Radhakrishnan M, et al. High-resolution DNA binding specificity analysis of yeast transcription factors. Genome Res. 2009;19:556–566. doi: 10.1101/gr.090233.108. [DOI] [PMC free article] [PubMed] [Google Scholar]


