

Abstract
Objectives. We examined how Hispanic parents' income and education, combined with their nativity status, influenced the body mass index (BMI) of their children, compared with non-Hispanic White children and their parents.
Methods. We used data from the Early Childhood Longitudinal Study, Kindergarten Class of 1998–99 to estimate linear growth curve models of children's initial BMI in kindergarten and change in BMI through fifth grade. Socioeconomic status was measured by logged household income and parental educational attainment (less than high school, high school graduate, some college, college graduate or higher).
Results. Parental education was negatively associated with children's BMI (baseline and growth) for non-Hispanic White children. Among Hispanic children, the association of parental education with growth in BMI was negative but much weaker. The weak effect of parental education was not explained by the presence of immigrants in the Hispanic population. Income was strongly negatively associated with children's BMI in kindergarten among children of Hispanic and White natives, but positively associated among Hispanic immigrant families.
Conclusions. The positive income–BMI association among Hispanic immigrant children might reflect cultural differences that immigrant parents carry with them from their countries of origin.
In the United States and other more developed countries, lower socioeconomic status (SES)—particularly parental education—is often associated with overweight or obesity among children.1,2 It is therefore puzzling that SES does not appear to have a consistent relationship with children's health outcomes, such as overweight, among Hispanics. In a study of Mexican American adolescents, parental education was unrelated to obesity.3 In a study of Hispanic 3-year-olds, maternal education and household income were unrelated to obesity.4 In another study of younger children (aged 2–9 years), poverty was associated with overweight among Whites but not among Mexican Americans.5
Several studies have speculated that the lack of a significant SES gradient for Hispanic health outcomes might be a result of the large proportion of immigrants in the US Hispanic community. If the SES gradient for immigrant Hispanics were different from those for US-born Hispanics and US-born non-Hispanic Whites, the immigrant pattern could weaken the results when all Hispanics are pooled together. However, little work on Hispanic children has examined SES and body mass index (BMI; defined as weight in kilograms divided by height in meters squared) separately by the nativity status of the parents, even though 60% of Hispanic children in the United States have at least 1 immigrant parent.6 The SES gradient for the children of immigrants could differ from that for the children of natives because (1) parental education, a commonly used indicator of SES, may not have the same meaning for immigrants as for natives, especially if parents' schooling took place outside the United States, and (2) cultural differences carried by immigrant parents from their countries of origin that associate social position with obesity may influence BMI among their children.7
We hypothesized that the relationship between SES and overweight is positive for the children of immigrants, particularly when income is used as an indicator of SES. Parental education has typically been used as an indicator of SES even though income has been shown to be an independent correlate of health.8 Among immigrant families in particular, income provides a better indication of purchasing power than education because recently arrived immigrants are less able than natives to translate their educational attainment into earnings.9,10 After subtracting the effects of educational attainment, we expected that higher-income immigrant families might be more likely to indulge their children with food than would native families with similar resources.
To assess this hypothesis, we analyzed a nationally representative sample of non-Hispanic White children of natives, Hispanic children of immigrants, and Hispanic children of natives. The research used growth curve models to estimate the relationship between 2 indicators of SES—parental education and family income—and children's BMI at baseline (kindergarten) and growth in BMI between kindergarten and fifth grade. We further assessed whether the relationship of BMI with education and income varied significantly by Hispanic origin and immigrant status.
METHODS
To estimate baseline levels and rates of growth in BMI, we used data from the Early Childhood Longitudinal Study, Kindergarten Class of 1998–99 (ECLS-K).11 Conducted by the National Center for Education Statistics, the ECLS-K followed a nationally representative sample of roughly 21 000 children from kindergarten through fifth grade. BMI measurements were collected from the children during the spring and fall of kindergarten and first grade and during the fall of third and fifth grades, resulting in up to 6 BMI measurements per child. ECLS-K staff assessed children's height and weight with a Shorr Board (Shorr Productions, Olney, Maryland) and a digital scale at each wave of data collection and recorded the data. Like many longitudinal data collections, the ECLS-K has some missing values. In particular, 22% of the respondents were missing key information on parent's nativity status. To address this issue, we filled in missing values by using a strategy based on sequential regression multivariate imputation adopted by the imputation software IVEware (Survey Research Center, Institute for Social Research, University of Michigan, Ann Arbor).
We estimated 5 distinct values for each missing data point and then substituted those values for the missing data to form 5 different data sets, all of which were used to generate 5 sets of multivariate results. We combined the results into 1 set of regression coefficients and standard errors. In this analysis, we did not impute the dependent variable (i.e., BMI). The growth curve modeling technique used in this study accommodates missing values for the dependent variable at a given time point quite easily because it allows for varying numbers of waves of data and individualized collection schedules for each child.12 In other words, children with fewer than 6 BMI measurements can still be used in the analysis.
The analytic sample (n = 12 696) was limited to non-Hispanic White (hereafter “White”) children with native-born parents (n = 9429) and Hispanic children, of whom 2046 were the children of immigrants and 1221 were the children of US-born natives. Over two thirds (69%) of the Hispanic children were of Mexican descent, 9% were Puerto Rican, 3% were Cuban, and the remaining 19% fell into the category “other Hispanic.” For the multivariate analyses, each child contributed up to 6 measurements of BMI, resulting in multiple records per child. The final analytic sample included 57 862 observations: 43 317 contributed by White children, 9380 by Hispanic children with at least 1 foreign-born parent, and 5165 by Hispanic children, both of whose parents were US born.
Measures
BMI and obesity.
We used raw BMI as the dependent variable rather than BMI z score or percentile ranking because raw BMI score has been found to be optimal for measuring adiposity change (because it is less correlated with change over time than other measures of adiposity).13 The weighted average kindergarten BMI for each group under study was 16.2 (SD = 0.030), 16.8 (SD = 0.070) and 16.6 (SD = 0.083) for White children, Hispanic children from immigrant families, and Hispanic children from native families, respectively.
Socioeconomic status and control variables.
Both family income (log transformed) and the highest level of education of parents or the responsible adult in the household (less than high school, some college, and college graduate or higher vs high school graduate) were used as indicators of SES. Well over one third (37%) of the White children in the sample lived in families headed by a college graduate. Comparable figures for children living in Hispanic immigrant families and Hispanic native families were 11% and 15%, respectively. The average yearly family income in this sample was roughly $61 000 for White families, $28 000 for Hispanic immigrant families, and $41 000 for Hispanic native families. In addition, control variables included sex (male = 1, female = 0), prematurity status (< 38 weeks gestation), and the number of children in the household.
Analysis
Mean differences in children's BMI were examined across racial/ethnic groups and varying levels of SES. The association of BMI with SES was also assessed within each racial/ethnic group. To more fully examine the relationship between SES and children's BMI, we used growth curve modeling techniques. Growth curve models are well suited for modeling baseline levels and the direction and magnitude of change in a developmental outcome measure such as BMI.12,14,15 The models simultaneously estimated effects for level-1 units (the multiple observations for each child across age) and level-2 units (the children). The level-1 model fitted BMI as a function of age across the observations for each child:
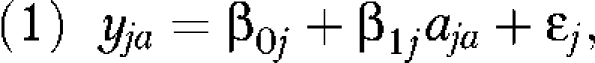 |
where yja was the BMI of child j at age a (measured in months).
The level-2 model fitted the level-1 intercepts and coefficients across all individuals as a function of children's fixed characteristics:
 |
where HISP took the form of a dichotomous variable indicating Hispanic ethnicity, or a set of dummy variables indicating Hispanic children of foreign-born parents or Hispanic children of native-born parents, respectively.
SES represents the socioeconomic indicators; a set of dummy variables indicating the highest educational attainment of the parent or the log transformed yearly family income. Zj represents a vector of control variables.
We used Equation 2 (β0j) to estimate the associations of child-level factors with the children's baseline BMI in kindergarten (the “intercept” model) and Equation 3 (β1j) to estimate their associations with growth in BMI (the “slope” model). We assessed associations between BMI and parental education for Hispanic and White children with growth curve models adjusted for the full set of control variables. Interactions between Hispanic ethnicity and parental education were used to examine the difference in effect for Hispanic versus White children (Model 1). We then compared the associations between Hispanic children of immigrants, Hispanic children of natives, and White children of natives using a set of interaction terms between nativity groups and parental education (model 2). Predicted values of BMI baseline and annual growth (monthly growth was multiplied by 12 to obtain predicted annual growth) were graphed to more easily examine the education gradient. Further analysis substituted logged family income for parental education into model 1 to explore the independent role of family income on BMI at baseline and growth (model 3). We assessed whether the relationship between income and BMI remained after accounting for parental education by including the set of education and nativity interactions (model 4).
RESULTS
Figure 1 presents the unadjusted means of kindergarten children's BMI at varying levels of SES measurements (parental education and family income) by racial/ethnic and nativity categories. Across most levels of education, Hispanic children had significantly higher BMI than did White children. An exception occurred at the lowest level of education (parent not a high school graduate), where BMI did not differ significantly between Whites and Hispanics regardless of parental nativity status. A similar pattern occurred when family income was used as an SES indicator, with Hispanic children having higher levels of BMI than did Whites across group-specific income terciles. At the highest level of family income, BMI among the children of immigrants was significantly higher than among both White children and children from native Hispanic families (mean difference = 0.48; P < .001). There were no other significant differences between the 2 groups of Hispanic children at any other level of family income or parental education.
FIGURE 1.

Mean body mass index (BMI) measured in spring among kindergarten children, by ethnicity and (a) parental education and (b) tertiles of family income: Early Childhood Longitudinal Study, Kindergarten Class of 1998–99, United States.
Note. Predicted values are based on coefficients from model 2, which compared a set of interaction terms between nativity groups and parental education. Hatched lines represent standard errors. When the standard error bars overlap, the difference between 2 means is not statistically significant. Where the bars do not overlap, a t test was conducted.
We next examined the relationship between baseline BMI and SES within each of the racial/ethnic and nativity groups. Among White children, BMI was negatively associated (P < .05) with both parental education and family income, thus supporting prior research. Among Hispanic children, the results were less clear. Parental education was negatively associated with BMI among Hispanic children of immigrants but was unrelated to kindergarten BMI among Hispanic children of natives. Showing nearly the opposite pattern, income tercile was unrelated to BMI among Hispanic children of immigrants but significantly negatively associated with BMI among Hispanic children of natives.
Table 1 presents the intercept (β0j) and slope (β1j) coefficients for a series of 4 linear growth curve models. Model 1 served to replicate prior research results by testing whether the SES gradient was weaker for Hispanic children than for White children. In addition to the control variables (sex, number of children in the household, and prematurity status), Model 1 included Hispanic ethnicity (with White children as the reference category), parental education (with high school graduate as the reference category), and the interaction between parental education and Hispanic ethnicity (which allowed the effect of parental education to vary by ethnicity). The education coefficients (main effects) estimated the education effects for White children (the reference category for ethnicity), and the interaction effects estimated the difference in the effects of education for Hispanic versus White children.
TABLE 1.
Growth Curve Models of Body Mass Index (BMI) From Kindergarten Through Fifth Grade: Early Childhood Longitudinal Study, Kindergarten Class of 1998–1999
| Model 1 |
Model 2 |
Model 3 |
Model 4 |
|||||
| Baseline BMI, B0j (SE) | Growth in BMI, B1j (SE) | Baseline BMI, B0j (SE) | Growth in BMI, B1j (SE) | Baseline BMI, B0j (SE) | Growth in BMI, B1j (SE) | Baseline BMI, B0j (SE) | Growth in BMI, B1j (SE) | |
| Intercept | 16.186† (0.045) | 0.068† (0.001) | 16.186† (0.045) | 0.068† (0.001) | 16.702† (0.200) | 0.121† (0.006) | 16.376† (0.214) | 0.096† (0.007) |
| Education | ||||||||
| < High school | 0.101 (0.106) | 0.009*** (0.003) | 0.101 (0.106) | 0.009*** (0.003) | 0.085 (0.107) | 0.007* (0.003) | ||
| Some college | −0.030 (0.052) | −0.008† (0.002) | −0.030 (0.052) | −0.008† (0.002) | −0.023 (0.052) | −0.007† (0.002) | ||
| College | −0.231† (0.048) | −0.019† (0.001) | −0.231† (0.048) | −0.019† (0.001) | −0.214† (0.051) | −0.017† (0.002) | ||
| Income | −0.057*** (0.018) | −0.006† (0.001) | −0.019 (0.02) | −0.003† (0.001) | ||||
| Hispanic children from immigrant household | 0.457† (0.083) | 0.006** (0.002) | −0.188 (0.386) | −0.050† (0.012) | −0.293 (0.408) | −0.033*** (0.012) | ||
| Immigrant household × < high school | 0.142 (0.148) | −0.009** (0.004) | 0.175 (0.149) | −0.007 (0.004) | ||||
| Immigrant household × some college | 0.018 (0.136) | 0.004 (0.004) | −0.013 (0.137) | 0.003 (0.004) | ||||
| Immigrant household × college | 0.046 (0.149) | 0.007 (0.004) | −0.020 (0.154) | 0.003 (0.004) | ||||
| Immigrant household × income | 0.076** (0.038) | 0.006† (0.001) | 0.076* (0.040) | 0.004*** (0.001) | ||||
| Hispanic children from a native household | 0.330† (0.099) | 0.001 (0.003) | 0.515 (0.496) | −0.040** (0.016) | 0.955* (0.541) | −0.025 (0.017) | ||
| Native household × < high school | −0.189 (0.215) | −0.005 (0.007) | −0.244 (0.218) | −0.003 (0.007) | ||||
| Native household × some college | 0.008 (0.143) | 0.008* (0.004) | 0.028 (0.144) | 0.007 (0.004) | ||||
| Native household × college | 0.098 (0.172) | 0.012** (0.005) | 0.160 (0.182) | 0.010* (0.005) | ||||
| Native household × income | −0.015 (0.047) | 0.005*** (0.002) | −0.062 (0.052) | 0.003 (0.002) | ||||
| All Hispanic children | 0.405† (0.067) | 0.004** (0.002) | ||||||
| All Hispanic children × < high school | 0.116 (0.136) | −0.007* (0.004) | ||||||
| All Hispanic children × some college | 0.000 (0.102) | 0.005* (0.003) | ||||||
| All Hispanic children × college | 0.066 (0.114) | 0.009** (0.003) | ||||||
| All Hispanic children × income | ||||||||
| Controls | ||||||||
| Gender (Male=1) | 0.079** (0.032) | 0.080** (0.032) | 0.080** (0.032) | 0.080** (0.032) | ||||
| Born premature (Premature=1) | −0.264† (0.043) | −0.262† (0.043) | −0.265† (0.043) | −0.263† (0.043) | ||||
| No. of children in household | −0.098† (0.015) | −0.099† (0.015) | −0.096† (0.015) | −0.099† (0.015) | ||||
Note. The reference category is non-Hispanic White children and high school education in all models. Model 2 substitutes a set of dummy variables indicating parental nativity status for the Hispanic indicator, as well as parent nativity × parental education interaction effects. Model 3 removes parental nativity × parental education interaction effects and substitutes parental nativity × ln(family income) interaction effects. Model 4 builds on model 3 by adding the education interactions from model 2; this model has the most parsimonious fit, allowing the effects of income and education to vary by parental nativity status. Goodness-of-fit (Akaike information criterion and −2 log-likelihood, respectively) is as follows: for model 1, 214 404 and 214 356; for model 2, 214 406 and 214 344; for model 3, 214 527 and 214 489; and for model 4, 214 393 and 214 319. Variance components are not presented but are available on request. For coefficients β0j and β0j, see Methods section.
*P < .10; **P < .05; ***P < .01; †P < .001.
The main effects of Hispanic ethnicity in both the intercept and slope models were positive and significant, indicating that Hispanic children of parents with a high school education tended to have significantly higher BMIs in kindergarten and to gain significantly more weight over time than did their White counterparts. In addition, the main effects of education were significant and negative, indicating that higher levels of parental education were significantly associated with lower baseline and slower growth in BMI among White children. The interaction terms (Hispanic × parental education) in the intercept model (β0j) were not significant individually or as a group, indicating no difference in the SES gradient in baseline BMI between Hispanic and White children. However, in the slope model (β1j), the interaction terms were significant and positive at higher levels of parental education, indicating a flatter education gradient in growth in BMI for Hispanic children than for White children. For example, the monthly rate of growth in BMI for White children with high school–educated parents was 0.068, but it was almost one third less (0.049, or 0.068 − 0.019) at the highest level of education. In contrast, the comparable figures for Hispanic children were 0.072 (0.068 + 0.004) and 0.061 ([0.072 − 0.019] + 0.009), a reduction of only 15%.
We next assessed whether the relatively flat education gradient occurred among all Hispanic children or was confined to children of immigrants. We replaced the dummy variable indicating Hispanic ethnicity with 2 dichotomous variables representing the children of Hispanic immigrants and the children of Hispanic natives. The addition of the block of interaction terms to the intercept model was not significant, but the addition of the interaction terms to the growth model was significant (F6,1000 = 2.72; P < .05). Predicted values were generated by plugging into the models various combinations of values for racial/ethnic and nativity group, parental education, and family income while setting all the other variables to zero. (Thus, the predicted values were for girls with no siblings who were not born prematurely. The decision to set all control variables to zero was an arbitrary choice. This choice determined the overall level of the predicted values, but it had no effect on the predicted differences among groups.) Figure 2 shows the predicted values based on Model 2, with children's BMI during kindergarten and the rate of growth through fifth grade.
FIGURE 2.

Association of parental education and children's nativity with (a) baseline body mass index (BMI) in kindergarten and (b) predicted annual growth in BMI through the fifth grade: Early Childhood Longitudinal Study, Kindergarten Class of 1998–99, United States.
Note. Predicted values are based on coefficients from model 2, which compared a set of interaction terms between nativity groups and parental education. Hatched lines represent standard errors. When the standard error bars overlap, the difference between 2 means is not statistically significant. Where the bars do not overlap, a t test was conducted.
If children from immigrant families were masking a negative-sloping education gradient among all Hispanic children, we would expect to find a negative gradient among Hispanic children of natives once they were separated from children in immigrant families. This did not occur. The gradient sloped in the opposite direction among Hispanic children of natives, whereby parental education was positively associated with both baseline and annual growth in BMI. Thus, the relatively flat relationship between education and growth in BMI that we observed among Hispanic children (model 1) was not explained by the presence of children of immigrants among Hispanics.
To determine whether these findings held when income was used as the indicator of SES, we substituted logged family income for parental education for both the main and interaction terms (Model 3). The results for White children were consistent with the results on education. Higher levels of family income were associated with lower baseline BMI and slower growth in BMI. However, the interaction between children of Hispanic immigrant and family income was significant and positive in the intercept and growth models. Figure 3 shows the predicted baseline BMI and the annual growth in BMI for the 3 racial/ethnic and nativity groups. The line representing baseline BMI among the children of Hispanic immigrants shows an upward trajectory that is significantly higher than that of the line for the children of Hispanic natives. This is consistent with the idea that income may act differently among immigrant families than among native families.
FIGURE 3.

Association of family income and children's nativity with (a) baseline body mass index (BMI) in kindergarten and (b) predicted annual growth in BMI through fifth grade: Early Childhood Longitudinal Study, Kindergarten Class of 1998–99, United States.
Note. Predicted values based on coefficients from model 3, which compared a set of interaction terms between nativity groups and family income. Hatched lines represent standard errors. Log transformed family income was converted to dollars. When the standard error bars overlap, the difference between 2 means is not statistically significant. Where bars do not overlap, a t test was conducted at 3 family income points: $15 000, $35 000, and $65 000.
Turning to the growth model, the rate of growth declined steeply for White children, but it was relatively flat for the children of immigrants. The predicted rate of growth in BMI among Hispanic children of natives declined slightly at higher levels of income. Additional analyses (not shown) indicated that the difference in the rate of BMI growth between Hispanic children of natives and children of immigrants was marginally significant at higher levels of income. In other words, among the children of Hispanic immigrants, family income was positively associated with higher initial BMI, but it was not associated with growth in BMI.
Finally, we assessed whether the positive (or flat) relationship between income and baseline BMI among Hispanic children of immigrants remained after accounting for parental education. We added parental education and the interaction of ethnicity and nativity with parental education to the model (Model 4). The main effect of income on baseline BMI (i.e., the effect for White children) was reduced in absolute value and lost statistical significance after parental education was controlled, probably reflecting the correlation between education and income among White children of natives. However, the interaction between income and children of immigrants remained significant and positive in both the intercept and growth models, and the interaction between parental education and Hispanic children of natives was not significant. This suggests that the relatively flat SES gradient that we observed for Hispanic children of immigrants in Model 3 is associated specifically with income and not parental education.
DISCUSSION
Weak or nonexistent links between parental socioeconomic indicators and children's overweight are a common finding in the literature on Hispanic children's health. One could interpret the lack of an SES gradient in a positive light, as an indication of lower health inequality within groups. However, since Hispanic children, the largest group of children of immigrants, are more likely to be overweight than other children on average, the lack of an SES gradient suggests that even if Hispanics experience upward mobility, health improvements may not accompany these economic gains. Hispanics are projected to comprise 24.4% of the US population by 2050.16 Without intervention, the continued high prevalence of overweight, combined with lack of an SES gradient on children's weight, could have serious implications for the overall health of the future US population even if Hispanics continue to follow a path of upward economic mobility.17
In this study, we assessed the possibility that associations between SES and child overweight may have been obscured in analyses that failed to differentiate by nativity status or that relied on parental education and not income as indicators of SES. Consistent with prior research on children's health, we found a negative relationship between parental education and children's BMI in kindergarten and subsequent growth in BMI for White children, but a much weaker negative effect of education on growth in BMI among Hispanic children. However, the results further suggested that the weak effect of parental education on Hispanic children's BMI is not explained by the large proportion of immigrants among Hispanics.
We had hypothesized that the education gradient would be flatter among Hispanic children of immigrants because of greater measurement error associated with educational attainment among immigrant parents, particularly among those who received their education outside the United States. However, when we disaggregated Hispanic children by parental nativity, we found the education gradient on growth in BMI to be flatter for Hispanic children of natives rather than for the children of immigrants. For the children of immigrants, the education gradient was not significantly different from that for non-Hispanic White children.
Despite the unexpected findings concerning parental education, we found support for our hypotheses concerning income. As expected, among the children of Hispanic and White natives, we found a strong negative effect of income on children's BMI in kindergarten once education was controlled for; among the children of Hispanic immigrants, however, there was a positive effect of income. As we have argued both in the introduction to this report and elsewhere,7 the positive income gradient might reflect cultural differences that immigrant parents carry with them from their countries of origin. In many Latin American countries, higher levels of income and education are associated with higher levels of obesity among children,18–22 and immigrant parents might carry with them the feeding practices associated with their income levels in their home countries.3 Indeed, the gradient tends to be positive in some Latin American countries, including among Mexican children.21
Country-level differences in the SES gradient can be understood more generally within the nutrition transition framework. Described by Popkin et al.19,20 and supported by other research,23–25 the nutrition transition is a worldwide historical process occurring over the past 2 decades and involving shifts in food consumption and physical activity patterns. In less-developed (pretransition) countries, obesity tends to be relatively rare and concentrated among the upper and middle classes, because they are less likely to be engaged in physical labor and are wealthy enough to purchase higher-protein, higher-calorie foods. As economic development proceeds, however, and is accompanied by rising incomes, urbanization, and increasing availability of inexpensive, high-caloric foods, obesity increases and shifts from disproportionately afflicting the upper and middle classes to being a burden of the poor.
The positive relationship between parental income and the baseline BMI of Hispanic children of immigrants may be a function of rapid social mobility. Among kindergarten-age Hispanic children of immigrants, however, education and income appear to operate in opposing directions. One idea is that, regarding healthy weight in children, education (but not income) is associated with acculturation toward upper-middle-class White norms in the United States. Educational attainment taps into multiple dimensions of SES related not only to the accumulation of human capital such as skills, training, and credentials, but also to social class origins and personal attributes related to coping strategies and cognitive abilities.26–29 All such dimensions are likely to affect immigrants' exposure to, acceptance of, and ability to take advantage of new ideas about nutrition and health. On the other hand, income, more than education, provides an indication of purchasing power among immigrant families. Among Hispanics, rapid increases in income may bring about different consumption patterns and indulgent child-feeding practices unless higher incomes are accompanied by higher levels of education and US upper-middle-class norms about children's weight. More research on the relationships of education, income, and rapid income mobility with feeding practices and perceptions of healthy weight among Hispanic parents would be helpful.
The research presented here has limitations. First, like all longitudinal data sets, the ECLS-K has missing data. We addressed this shortcoming by using multiple imputation techniques; we found similar results using both imputed and nonimputed data. Second, the data we used do not include measures of intergenerational economic mobility or parents' perceptions of healthy weight, and they provide only limited detail about feeding practices and activity patterns (these items are available only for the fifth-grade data). This limited our ability to evaluate some of our interpretations of the findings. In addition, the analyses would have been enhanced had we also examined the relationships between parental income and education and children's BMI in Mexico and other Latin American countries that tend to send immigrants to the United States, but this was beyond the scope of our study. Finally, the study would have been enhanced by analyses of Hispanic subgroups (Mexicans, Cubans, etc.). Although there is some information on the specific Hispanic groups in the data, there were not enough cases in each group to allow separate analyses.
Despite these limitations, our findings point to the possibility that lack of an education gradient with respect to BMI among Hispanic children may be attributed to the large presence of immigrant parents among the US Hispanic population. Further, the positive relationship between parental income and BMI among Hispanic children of immigrants might suggest that even if Hispanics experience upward mobility, health improvements may not accompany these economic gains.
Acknowledgements
This research was supported by a Young Scholars grant provided by the Foundation for Child Development. The Center for Family and Demographic Research at Bowling Green State University has core funding from The Eunice Kennedy Shriver National Institute of Child Health & Human Development (R24HD050959-01).
We thank the 3 anonymous reviewers for helpful comments.
Human Participant Protection
This project was approved by the Bowling Green State University Office of Research Compliance (no. H05E081FX4) with a secure data agreement with the National Center for Education Statistics (no. 001211535).
References
- 1.Gordon-Larsen P, Adair LS, Popkin BM. Ethnic differences in physical activity and inactivity patterns and overweight status. Obes Res 2002;10(3):141–149 [DOI] [PubMed] [Google Scholar]
- 2.Sobal J, Stunkard AJ. Socioeconomic-status and obesity: a review of the literature. Psychol Bull 1989;105:260–275 [DOI] [PubMed] [Google Scholar]
- 3.Goldman N, Kimbro RT, Turra CM, Pebley AR. Socioeconomic gradients in health for white and Mexican-origin populations. Am J Public Health 2006;96(12):2186–2193 [DOI] [PMC free article] [PubMed] [Google Scholar]
- 4.Whitaker RC, Orzol SM. Obesity among US urban preschool children: relationships to race, ethnicity, and socioeconomic status. Arch Pediatr Adolesc Med 2006;160(6):578–584 [DOI] [PubMed] [Google Scholar]
- 5.Wang Y, Zhang Q. Are American children and adolescents of low socioeconomic status at increased risk of obesity? Changes in the association between overweight and family income between 1971 and 2002. Am J Clin Nutr 2006;84:707–716 [DOI] [PubMed] [Google Scholar]
- 6.Glick JE, Van Hook J. Through children's eyes: families and households of Latino children in the United States. Rodríguez H, Menjivar C, Latinas/os in the United States: Changing the Face of América. New York, NY: Springer; 2008:72–86 [Google Scholar]
- 7.Van Hook J, Balistreri KS. Immigrant generation, socioeconomic status, and economic development of countries of origin: a longitudinal study of body mass index among children. Soc Sci Med 2007;65:976–989 [DOI] [PubMed] [Google Scholar]
- 8.Schnittker J. Education and the changing shape of the income gradient in health. J Health Soc Behav 2004;45:286–305 [DOI] [PubMed] [Google Scholar]
- 9.Chen E, Martin AD, Matthews KA. Socioeconomic status and health: do gradients differ within childhood and adolescence? Soc Sci Med 2006;62:2161–2170 [DOI] [PubMed] [Google Scholar]
- 10.Waters M, Eschbach K. Immigration and racial and ethnic inequality in the United States. Annu Rev Sociol 1995;21:419–446 [Google Scholar]
- 11.ECLS-K First Through Fifth Grade Restricted-Use Data Files and Electronic Codebooks [CD-ROM]. Washington, DC: US Dept of Education, National Center for Education Statistics; 2006. NCES publication 2006-033 [Google Scholar]
- 12.Singer JD, Willett JB. Applied Longitudinal Data Analysis: Modeling Change and Event Oc currence. New York, NY: Oxford University Press; 2003 [Google Scholar]
- 13.Cole TJ, Faith MS, Pietrobelli A, Heo M. What is the best measure of adiposity change in growing children: BMI, BMI%, BMI z-score or BMI? Eur J Clin Nutr 2005;59:419–425 [DOI] [PubMed] [Google Scholar]
- 14.Raudenbush SW, Bryk AS. Hierarchical Linear Models: Applications and Data Analysis Methods. 2nd ed.Newbury Park, CA: Sage; 2002 [Google Scholar]
- 15.Heo M, Faith MS, Mott JW, Gorman BS, Redden DT, Allison DB. Hierarchical linear models for the development of growth curves: an example with body mass index in overweight/obese adults. Stat Med 2003;22:1911–1942 [DOI] [PubMed] [Google Scholar]
- 16.Larsen LJ. The Foreign-Born Population in the United States: 2003. Washington, DC: US Census Bureau; 2004. Current Population Reports P20-551 [Google Scholar]
- 17.Myers D. Immigrants and Boomers: Forging a New Social Contract for the Future of America. New York, NY: Russell Sage Foundation; 2007 [Google Scholar]
- 18.Monteiro CA, Conde WL, Lu B, Popkin BM. Obesity and inequities in health in the developing world. Int J Obes Relat Metab Disord 2004;28:1181–1186 [DOI] [PubMed] [Google Scholar]
- 19.Popkin BM. The nutrition transition and obesity in the developing world. J Nutr 2002;131:871S–973S [DOI] [PubMed] [Google Scholar]
- 20.Popkin BM, Gordon-Larsen P. The nutrition transition: worldwide obesity dynamics and their determinants. Int J Obes Relat Metab Disord 2004;28(suppl 3):S2–S9 [DOI] [PubMed] [Google Scholar]
- 21.Ridaura R, Barquera S, Prado B, Rivera J. Preventing obesity in Mexican children and adolescents. Oria M, Sawyer K, Joint US-Mexico Workshop on Preventing Obesity in Children and Youth of Mexican Origin: Summary. Washington, DC: National Academy Press; 2007:81–127 [Google Scholar]
- 22.Wang Y. Cross-national comparison of childhood obesity: the epidemic and the relationship between obesity and socioeconomic status. Int J Epidemiol 2001;30(5):1129–1136 [DOI] [PubMed] [Google Scholar]
- 23.Drewnowski A, Popkin BM. The nutrition transition: new trends in the global diet. Nutr Rev 1997;55(2):31–43 [DOI] [PubMed] [Google Scholar]
- 24.Leatherman TL, Goodman A. Coca-colonization of diets in the Yucatan. Soc Sci Med 2005;61(4):833–846 [DOI] [PubMed] [Google Scholar]
- 25.Melgar-Quinonez HR, Kaiser LL. Relationship of child-feeding practices to overweight in low-income Mexican-American preschool-aged children. J Am Diet Assoc 2004;104(7):1110–1119 [DOI] [PubMed] [Google Scholar]
- 26.Bowles S, Gintis H. Schooling in Capitalist America: Educational Reform and the Contradictions of Economic Life. New York, NY: Basic Books; 1976 [Google Scholar]
- 27.Folkman S, Lazarus RS. An analysis of coping in a middle-aged community sample. J Health Soc Behav 1980;21:219–239 [PubMed] [Google Scholar]
- 28.Wheaton B. Stress, personal coping resources, and psychiatric symptoms: an investigation of interactive models. J Health Soc Behav 1983;24:208–229 [PubMed] [Google Scholar]
- 29.Manton KG, Stallard E. Medical demography: interaction of disability dynamics and mortality. Martin LG, Samuel H, Preston SH, Demography of Aging Washington, DC: National Academy Press; 1994:217–278 [Google Scholar]