Abstract
RNA polymerase II (Pol II) must overcome the barriers imposed by nucleosomes during transcription elongation. We have developed an optical tweezers assay to follow individual Pol II complexes as they transcribe nucleosomal DNA. Our results indicate that the nucleosome behaves as a fluctuating barrier that locally increases pause density, slows pause recovery, and reduces the apparent pause-free velocity of Pol II. The polymerase, rather than actively separating DNA from histones, functions instead as a ratchet that rectifies nucleosomal fluctuations. We also obtain direct evidence that transcription through a nucleosome involves transfer of the core histones behind the transcribing polymerase via a transient DNA loop. The interplay between polymerase dynamics and nucleosome fluctuations provides a physical basis for regulation of eukaryotic transcription.
During transcription elongation in eukaryotes, RNA polymerase II must overcome the transcriptional barriers imposed by nucleosomes in chromatin. In vitro, a single nucleosome is sufficient to halt or greatly slow transcription by Pol II (1–5), and factors that restrict transcriptional backtracking relieve nucleosome-induced pauses and arrests, suggesting that the influence of the nucleosome is mediated through polymerase backtracking (4). Pol II also affects nucleosomal dynamics: depletion and turnover of histones are seen in actively transcribed genes in vivo (6, 7), and histones are often transferred behind transcribing polymerases in vitro (2). However, the mechanisms underlying the mutual influence between nucleosome and polymerase are not well understood.
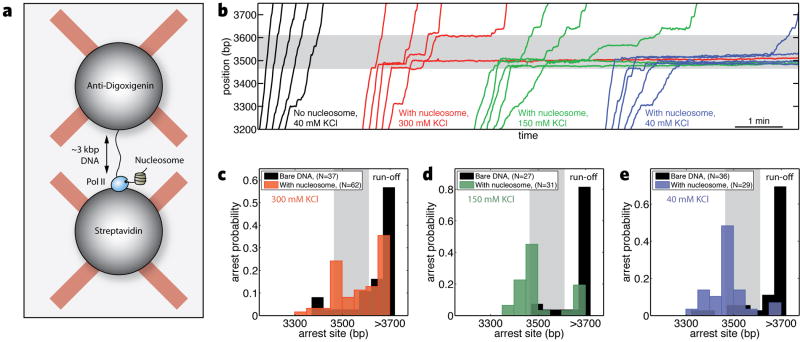
Here a dual-trap optical tweezers assay revealed real-time trajectories of individual Pol II complexes as they transcribed through single nucleosomes. A tether was created between two trapped beads—one attached to a stalled polymerase, the other to the upstream DNA (Figure 1a and Supporting Material). Addition of ribonucleotide triphosphates induced the polymerase to move towards the nucleosomal positioning sequence (NPS), causing the force between the two beads to decrease. The position of the polymerase was calculated by fitting the measured force to the worm-like chain formula of DNA elasticity (8).
Figure 1. Transcription through a nucleosome.
(a) Geometry for the dual-trap optical tweezers experiments. (b) Representative trajectories of individual transcribing polymerases with or without the nucleosome at different ionic strengths. (c), (d), and (e) Probability of arrest or termination as a function of polymerase position on the DNA template at 300, 150, and 40 mM KCl respectively. Arrest is defined as a pause that lasts longer than 20 minutes or until the tether breaks. Data for transcription of bare DNA is in solid black, and nucleosome data is in semi-translucent colors. The shaded region represents the NPS.
In the absence of a nucleosome, polymerases generally proceeded to the end of the DNA template, interrupted only by a few short pauses (Figure 1b, black traces). When we pre-loaded a single core nucleosome onto the template, Pol II showed pronounced changes in its dynamics, ranging from one or two pauses to complete arrest at the nucleosome (Figure 1b, colored traces). We observed a marked decrease in the frequency of nucleosomal arrest with increasing ionic strength (Figure 1c–e) (2, 5). The influence of ionic strength on arrest parallels a decrease in the mechanical stability of the nucleosome with salt, but does not correlate with changes in the dynamics of transcription on bare DNA (Supporting Material). Because a majority of polymerases were able to pass the nucleosome at 300 mM KCl, we conducted more detailed studies of nucleosomal transcription at this ionic strength.
To establish whether the nucleosome affected pause entry, we counted all pauses of at least 2 s and recorded their positions on the DNA template (Figure 2a). The nucleosome locally increased the probability of Pol II to enter a paused state approximately threefold, from 0.0079±0.002 bp−1 on bare DNA to a peak of 0.022±0.004 bp−1 at the nucleosome. The effect on pause density was strongest before the polymerase reached the dyad axis of the nucleosome (Figure 2a) (5). Pause durations at the nucleosome were highly variable among trajectories and within a given trajectory. A comparison of the cumulative distributions of the pause durations shows that the nucleosome biases the polymerase towards longer pauses (p< 0.001, Figure 2b), increasing the median pause duration from 4.3 s on bare DNA to 8.1 s at the nucleosome. Thus, the nucleosome slows the underlying pause recovery mechanism of the polymerase. Finally, pause-free velocity at the NPS was reduced from 17.5±2 bp/s on bare DNA to 10.5±3 bp/s in the presence of a nucleosome (Figure 2c and Supporting Material).
Figure 2. Effect of the nucleosome on transcription dynamics.
In each subplot, only traces that passed the NPS are considered. (a) Pause density with a nucleosome (dashed red line) and on bare DNA (solid black line). The pink shaded area represents the predicted pause density confidence interval at the nucleosome based on the model presented in the text. The gray shaded region is the confidence interval for pause density on bare DNA used in the model. Error bars are SEM. (b) Cumulative distributions of pause durations with (solid red line) and without (solid black line) a nucleosome present. Theoretical cumulative distributions for nucleosomal (pink dashed line) and non-nucleosomal (gray dashed line) pauses. (c) Pause-free velocities with (pink) and without (gray) a nucleosome with fits to normal distributions (solid lines). The predicted values based on the diffusive model with and without a nucleosome are shown as red and black circles, respectively.
Many transcriptional pauses of Pol II on bare DNA are associated with backtracking of the enzyme along the DNA template (9–11). Pauses end when the polymerase diffusively realigns the dislocated 3′ end of the transcript with its active site and resumes elongation. The probability density of pause durations, ψ(t), is equivalent to the distribution of first-passage times for return to the origin of a Poisson stepper that takes integral steps along a one-dimensional lattice (12, 13), and is given by:
where I1 is the modified Bessel function of the first kind, and kf and kb are the forward and backward stepping rates, respectively, during a backtrack (see Figure 3). These rates depend on force according to:
where k0 is the intrinsic zero-force stepping rate of Pol II diffusion along DNA during a backtrack, and d is the distance to the transition state for a step (taken here to be 0.5 bp). For small forces, ψ(t) reduces to the t−3/2 power-law dependence previously reported (9). We maintained the applied force (F) between 4–8 pN at the NPS and fit the cumulative distribution corresponding to ψ(t) to the pause durations on bare DNA to determine k0 = 0.33± 0.05 s−1 (Figure 2b); thus our data confirms that pause recovery occurs through a diffusive mechanism that is slow relative to elongation.
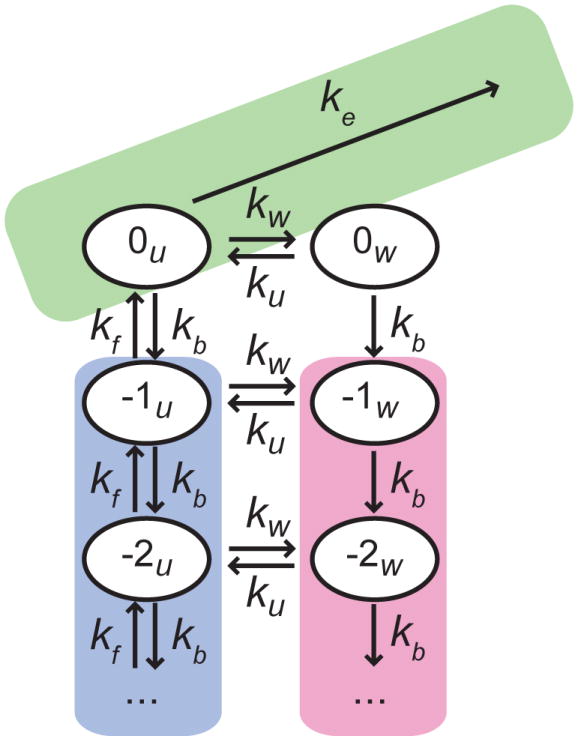
Figure 3. Kinetic model of transcription through a nucleosome.

The green area corresponds to on-pathway elongation (ke). The pink and blue areas represent off-pathway paused states where Pol II is backtracked; negative numbers indicate how many bases Pol II has backtracked from the elongation competent state, denoted by 0. The label u refers to the nucleosome being locally unwrapped (blue area), while w denotes the states where the nucleosome is wrapped in front of Pol II (pink area).
A backtracked polymerase cannot actively separate downstream nucleosomal DNA from the surface of the histones because it possesses no energy source. Moreover, the DNA downstream of a backtracked polymerase can stochastically rewrap around the histones, restricting Pol II from diffusing back to the 3’ end of the nascent RNA to resume transcription, thereby increasing pause durations. Because local nucleosomal fluctuations are fast relative to the diffusive stepping rate k0 (14), the nucleosome reaches fast local equilibrium between each backtracking step. Thus, we expect pause durations on nucleosomal DNA to be drawn from the same distribution as on bare DNA, but with a net forward stepping rate reduced by a factor corresponding to the fraction of time the local nucleosomal DNA is unwrapped, , where kw and ku are the rates of local wrapping and unwrapping of the DNA around the histones, respectively:
Using the value of k0 determined above, the cumulative distribution of pause durations in the presence of a nucleosome at 300 mM KCl is correctly fit by the diffusive backtracking model when γu = 0.48 ± 0.05, indicating that nucleosomal DNA is locally unwrapped half of the time immediately downstream of a polymerase.
During active transcription, forward elongation competes kinetically with pausing. Therefore, the increased pause density at a nucleosome can be used to infer changes in the net elongation rate, allowing us to discriminate between two possible scenarios: one in which Pol II can only elongate against a locally unwrapped nucleosome (Figure 3), and another in which the polymerase can advance by actively unwrapping nucleosomal DNA (Figure S11). We first examine the predictions of the model where Pol II passively waits for unwrapping fluctuations of the nucleosome (Figure 3). Here, pause density at the nucleosome has a similar form as on bare DNA, except with a dependence on γu (Supporting Material):
We are able to verify the net irreversible elongation rate ke by fitting the observed pause density on bare DNA to the above expression; we find ke = 16 ± 5 s−1, in agreement with our measurements of pause-free velocity (Figure 2c). Using this value of ke, along with the values of kb and γu obtained above, the model predicts a nucleosomal pause density of 0.017 ± 0.006 bp−1 for pauses longer than 2 s, a number that matches well our experimental measurements (Figure 2a).
The alternative scenario, in which the polymerase can actively open a wrapped nucleosome and elongate through it with a rate ke,w (Figure S11), predicts a smaller pause density (Supporting Material):
This prediction does not fit the observed peak value in pause density (above 0.02 bp−1) unless ke,w = 0 s−1, which simplifies to the scheme shown in Figure 3.
Local wrapping of the nucleosome prevents elongation, and because these nucleosomal fluctuations are very fast, the associated transcriptional delays are below the temporal resolution of our instrument. Instead, they have an impact on the apparent pause-free velocity of Pol II, reducing it to (Supporting Material). Based on our measurement of pause-free velocity on bare DNA (17.5±2 bp/s), the model predicts an apparent pause-free velocity on nucleosomal DNA of 8.4±1 bp/s, in close agreement with our experimental measurement of 10.5±3 bp/s (Figure 2c). Thus, during both backtracking and elongation, Pol II does not actively unwrap nucleosomal DNA, but instead waits for fluctuations that locally unwrap the nucleosome to advance, consistent with ratcheting mechanisms proposed for transcription elongation (15, 16).
It has been proposed that a transient DNA loop (17, 18) might allow the histones of a partially unwrapped nucleosome to contact DNA behind the polymerase and remain associated with the DNA after transcription (2, 4, 5, 17). The probability of forming such a thermally-induced DNA loop should be sensitive to forces as low as 0.2 pN (19). We designed a construct that stops the polymerase in a mechanically stable conformation after it has passed the nucleosome (Supporting Material); this strategy allowed us to obtain force-extension curves of the transcribed DNA to determine the dependence of histone transfer on applied force.
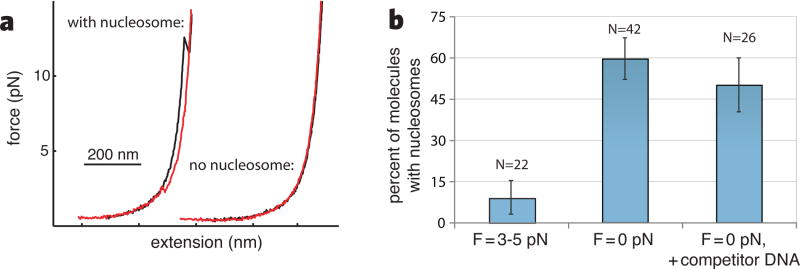
We monitored transcription of the nucleosomal region at forces between 3–5 pN, then pulled on the transcribed DNA when Pol II reached the end of the template. Very few molecules displayed nucleosome unwrapping transitions (2 of 22) despite marked pausing at the NPS; instead, most showed monotonic force-extension curves, indicating that no nucleosome was present behind the polymerase (Figure 4a). In contrast, when transcription proceeded in bulk before tether formation so that the DNA template was not under tension during transcription, a significant fraction of complexes showed nucleosomes upstream of the polymerase (25 of 42, p< 0.0001), indicating that histone transfer had occurred (Figure 4b). Histone transfer was not significantly affected by an eight-fold excess (50 ng/μL) of competitor DNA (13 of 26, p< 0.0025), a concentration sufficient to capture displaced histones (17). We conclude that histones are transferred in cis to DNA upstream of Pol II upon nucleosomal transcription, as the looping model proposes, and that tension inhibits formation of the looped intermediate necessary for transfer. This interpretation is consistent with the reduction in pause density as the polymerase advances through the NPS (Figure 2a), because either the histones detach from the DNA, are transferred to DNA upstream of the enzyme, or are pushed to a lower-affinity (i.e. higher γu) downstream sequence.
Figure 4. Histone transfer during transcription.
(a) Force-extension curves of transcribed DNA. Pulling curves are shown in black and relaxation curves in red. (b) Frequency of histone transfer as a function of applied force during transcription.
Regulation of elongation and pausing is of great importance for co-transcriptional processes such as alternative splicing (20, 21). Indeed, a large number of genes from different species are regulated during elongation by extended pausing, including many important developmental and heat-shock induced genes (22–28). Because nucleosomes are located at ubiquitous, well-defined positions in the genome and act as general repressors of transcription, they constitute a potential scaffold for regulation of transcription elongation. Our study indicates that modulation of the wrapping/unwrapping equilibrium of DNA around the histone octamer constitutes the physical basis for regulation of transcription through nucleosomal DNA.
Supplementary Material
Footnotes
This manuscript has been accepted for publication in Science. This version has not undergone final editing. Please refer to the complete version of record at http://www.sciencemag.org/. The manuscript may not be reproduced or used in any manner that does not fall within the fair use provisions of the Copyright Act without the prior, written permission of AAAS.
References
- 1.Izban MG, Luse DS. Genes Dev. 1991;5:683. doi: 10.1101/gad.5.4.683. [DOI] [PubMed] [Google Scholar]
- 2.Kireeva ML, et al. Mol Cell. 2002;9:541. doi: 10.1016/s1097-2765(02)00472-0. [DOI] [PubMed] [Google Scholar]
- 3.Walter W, Kireeva ML, Studitsky VM, Kashlev M. J Biol Chem. 2003;278:36148. doi: 10.1074/jbc.M305647200. [DOI] [PubMed] [Google Scholar]
- 4.Kireeva ML, et al. Mol Cell. 2005;18:97. doi: 10.1016/j.molcel.2005.02.027. [DOI] [PubMed] [Google Scholar]
- 5.Bondarenko VA, et al. Mol Cell. 2006;24:469. doi: 10.1016/j.molcel.2006.09.009. [DOI] [PubMed] [Google Scholar]
- 6.Widmer RM, et al. EMBO J. 1984;3:1635. doi: 10.1002/j.1460-2075.1984.tb02022.x. [DOI] [PMC free article] [PubMed] [Google Scholar]
- 7.Thiriet C, Hayes JJ. Genes Dev. 2005;19:677. doi: 10.1101/gad.1265205. [DOI] [PMC free article] [PubMed] [Google Scholar]
- 8.Bustamante C, Marko JF, Siggia ED, Smith S. Science. 1994;265:1599. doi: 10.1126/science.8079175. [DOI] [PubMed] [Google Scholar]
- 9.Galburt EA, et al. Nature. 2007;446:820. doi: 10.1038/nature05701. [DOI] [PubMed] [Google Scholar]
- 10.Komissarova N, Kashlev M. Proc Natl Acad Sci USA. 1997;94:1755. doi: 10.1073/pnas.94.5.1755. [DOI] [PMC free article] [PubMed] [Google Scholar]
- 11.Komissarova N, Kashlev M. J Biol Chem. 1997;272:15329. doi: 10.1074/jbc.272.24.15329. [DOI] [PubMed] [Google Scholar]
- 12.Feller W. An Introduction to Probability Theory and Its Applications. 2. Vol. 2. John Wiley & Sons Inc; New York: 1971. pp. 59–65. [Google Scholar]
- 13.Depken M, Galburt EA, Grill SW. Biophys J. 2009;96:2189. doi: 10.1016/j.bpj.2008.12.3918. [DOI] [PMC free article] [PubMed] [Google Scholar]
- 14.Li G, Levitus M, Bustamante C, Widom J. Nature Struct Mol Biol. 2005;12:46. doi: 10.1038/nsmb869. [DOI] [PubMed] [Google Scholar]
- 15.von Hippel P, Delagoutte E. Cell. 2001;104:177. doi: 10.1016/s0092-8674(01)00203-3. [DOI] [PubMed] [Google Scholar]
- 16.Bar-Nahum G, et al. Cell. 2005;120:183. doi: 10.1016/j.cell.2004.11.045. [DOI] [PubMed] [Google Scholar]
- 17.Studitsky VM, Clark DJ, Felsenfeld G. Cell. 1994;76:371. doi: 10.1016/0092-8674(94)90343-3. [DOI] [PubMed] [Google Scholar]
- 18.Studitsky VM, Kassavetis GA, Geiduschek EP, Felsenfeld G. Science. 1997;278:1960. doi: 10.1126/science.278.5345.1960. [DOI] [PubMed] [Google Scholar]
- 19.Yan J, Kawamura R, Marko JF. Phys Rev E. 2005;71:61905. doi: 10.1103/PhysRevE.71.061905. [DOI] [PubMed] [Google Scholar]
- 20.Nogues G, Kadener S, Cramer P, Bentley D, Kornblihtt AR. J Biol Chem. 2002;277:43110. doi: 10.1074/jbc.M208418200. [DOI] [PubMed] [Google Scholar]
- 21.de la Mata M, et al. Mol Cell. 2003;12:525. doi: 10.1016/j.molcel.2003.08.001. [DOI] [PubMed] [Google Scholar]
- 22.Rougvie AE, Lis JT. Cell. 1988;54:795. doi: 10.1016/s0092-8674(88)91087-2. [DOI] [PubMed] [Google Scholar]
- 23.Krumm A, Meulia T, Brunvand M, Groudine M. Genes Dev. 1992;6:2201. doi: 10.1101/gad.6.11.2201. [DOI] [PubMed] [Google Scholar]
- 24.Strobl LJ, Eick D. EMBO J. 1992;11:3307. doi: 10.1002/j.1460-2075.1992.tb05409.x. [DOI] [PMC free article] [PubMed] [Google Scholar]
- 25.Plet A, Eick D, Blanchard JM. Oncogene. 1995;10:319. [PubMed] [Google Scholar]
- 26.Bentley DL, Groudine M. Nature. 1986;321:702. doi: 10.1038/321702a0. [DOI] [PubMed] [Google Scholar]
- 27.Brown SA, Imbalzano AN, Kingston RE. Genes Dev. 1996;10:1479. doi: 10.1101/gad.10.12.1479. [DOI] [PubMed] [Google Scholar]
- 28.Core L, Lis J. Science. 2008;319:1791. doi: 10.1126/science.1150843. [DOI] [PMC free article] [PubMed] [Google Scholar]
- 29.The authors wish to thank Eric Galburt, Yongli Zhang and Maria Kireeva for helpful advice, as well as David King, Jason Choy, and Stephan Grill for technical assistance, and Jacqueline Wittmeyer for her gift of plasmids for histone proteins. C. B. is supported by NIH Grant GM32543.
Associated Data
This section collects any data citations, data availability statements, or supplementary materials included in this article.


