

Abstract
Genotype-imputation methods provide an essential technique for high-resolution genome-wide association (GWA) studies with millions of single-nucleotide polymorphisms. For optimal design and interpretation of imputation-based GWA studies, it is important to understand the connection between imputation error and power to detect associations at imputed markers. Here, using a 2 × 3 chi-square test, we describe a relationship between genotype-imputation error rates and the sample-size inflation required for achieving statistical power at an imputed marker equal to that obtained if genotypes at the marker were known with certainty. Surprisingly, typical imputation error rates (∼2%–6%) lead to a large increase in the required sample size (∼10%–60%), and in some African populations whose genotypes are particularly difficult to impute, the required sample-size increase is as high as ∼30%–150%. In most populations, each 1% increase in imputation error leads to an increase of ∼5%–13% in the sample size required for maintaining power. These results imply that in GWA sample-size calculations investigators will need to account for a potentially considerable loss of power from even low levels of imputation error and that development of additional genomic resources that decrease imputation error will translate into substantial reduction in the sample sizes needed for imputation-based detection of the variants that underlie complex human diseases.
Main Text
The genotype-imputation strategy for case-control genetic association studies provides an economical way of assessing many more genetic markers for disease association than have actually been measured in any particular association study.1–5 In this approach, case and control individuals are first genotyped for markers densely spread across the human genome. The measured genotypes are then combined with high-resolution genotypic data from genomic databases for imputation of the genotypic status of study individuals at markers investigated in the database but not in the study sample. This imputation relies on the principle that two haplotypes identical in genotype at nearby SNP markers are likely to share intervening chromosomal stretches identically by descent. Thus, if a haplotype in a densely genotyped database sample is identical to a haplotype in a more sparsely genotyped study sample for markers that overlap between the study and the database, then one can impute the study haplotype with high resolution by copying the haplotype from the database.
Methods relying on genotype imputation have proven effective for identifying high-risk disease-associated genetic variants, in part because they dramatically increase the number of markers that can be directly tested for association in comparison to earlier tag-SNP designs.6–10 However, the imputation strategy utilizes in its association tests estimated genotypes that are not known with certainty, and errors in imputed genotypes might potentially compromise the power of an imputation-based association test. For example, at a biallelic marker, consider a disease-susceptibility allele of small effect that has a true frequency of 0.3 in cases and 0.2 in controls. If the probability that imputation recovers the true allele is 0.9, then the frequency of the disease allele among imputed genotypes will be (0.3)(0.9) + (0.7)(0.1) = 0.34 in cases and (0.2)(0.9) + (0.8)(0.1) = 0.26 in controls. Imputation error converts an allele-frequency difference of 0.3 − 0.2 = 0.1 between cases and controls into a smaller difference of 0.34 − 0.26 = 0.08. As a result, for the imputed genotypes, one might require a larger sample size in order to determine that allele frequencies differ between cases and controls, as compared to the smaller sample size that would be required if the true genotypes were known.
Although recent studies have found that imputation error rates are generally low,11–15 it is possible that even low error rates could have considerable effects on downstream analyses. How does the error inherent in genotype imputation reduce the power of an association study when alleles at the true disease SNP are imputed rather than known? An answer to this question is important to the design and interpretation of imputation-based association studies. Relating imputation error and power would assist investigators in calculating sample sizes required for detecting disease variants at loci whose genotypes are imputed, as well as in determining whether imputation studies in particular populations are likely to be underpowered. Additionally, a relationship between imputation error and power would aid in the development of resources for genomic studies. For example, use of such a relationship could assist in the identification of populations in whom existing resources produce high error rates that limit the potential for practical mapping of risk variants with imputation strategies.
The problem of connecting imputation error to power is similar to a corresponding problem in the context of tag SNPs. In the imputation context, the loss of information as a result of imputation error at a disease-susceptibility locus can obscure the association between the locus and disease. In the tag-SNP context, the loss of information as a result of using a tag SNP rather than the true disease SNP has an analogous effect. In both situations, missing information about the correct genotypes at the true disease-susceptibility locus contributes to a loss of power for detecting disease association.
For the tag-SNP context, consider two loci, a SNP causally associated with disease and a nearby tag SNP. If the r2 correlation statistic for linkage disequilibrium (LD) between the tag SNP and the disease SNP is equal to c, then a chi-square test statistic for disease association at the true disease SNP in a case-control sample of total size N has approximately the same asymptotic distribution under the alternative hypothesis of disease association as the corresponding chi-square statistic at the tag SNP in a case-control sample of size N/c.16 Thus, the “sample-size inflation factor” required in using the tag SNP in an association study rather than the true disease SNP is ∼1/c.
Motivated by this result, investigators have proposed multiple versions of an r2 correlation statistic between the imputed genotypes at a SNP and the true genotypes.17–19 Such statistics, which are sometimes used for identifying markers imputed with high accuracy in imputation-based genome-wide association (GWA) studies,6,20 have been viewed as conceptually analogous to the r2 statistic for LD between a tag-SNP and a disease SNP, but they have not been shown to be mathematically equivalent to it. In the imputation context for a biallelic SNP with alleles A and B, the correlation between true and imputed genotypes is a function of a 3 × 3 table, in which each of three possible true genotypes (AA, AB, BB) has one of three possible imputations. In the tag-SNP context, however, if the disease SNP has alleles A and B and the tag SNP has alleles C and D, then the corresponding table is a 2 × 2 table, containing entries for the counts of the four possible haplotypes (AC, AD, BC, BD). Although the close analogy between the tag SNP and imputation contexts suggests that the relationship between imputation error and power is similar to that observed between power and LD with a tag SNP, at present the connection between imputation r2 statistics and power remains informal.
Here, in order to investigate the mathematical relationship between imputation error and power, we adapt a method developed for evaluating the relationship between genotyping error and power.21,22 Our approach does not use an r2 statistic, and unlike the inflation factor in the tag-SNP context, which depends only on the LD between the tag and disease SNPs, the corresponding inflation factor in the imputation context is a function of nine parameters. Consider two 2 × 3 chi-square tests of association, examining the relationship between the three possible genotypes of a biallelic marker and case-control status. The first test uses the true genotypes of the marker, whereas the second test uses genotypes measured with the possibility of imputation error. Suppose that k is the ratio of the number of controls to the number of cases. Denote by MAFcontrols the frequency of the minor allele in controls, and by MAFcases the frequency of this same allele in cases. Thus, 0 ≤ MAFcontrols ≤ 1/2 and 0 ≤ MAFcases ≤ 1. We label the minor allele in controls by A, the major allele in controls by B, genotype AA by 1, AB by 2, and BB by 3. For i, j ∈ {1, 2, 3}, we let ɛij be the probability that genotype i is imputed as genotype j. Because for each i, only six error parameters must be considered: ɛ12, ɛ13, ɛ21, ɛ23, ɛ31, and ɛ32.
Gordon et al.21 and Kang et al.22 determined the relationship between the two 2 × 3 chi-square test statistics at a locus, showing that the test statistic for association between true genotype and disease in a sample of size N has the same asymptotic distribution as the test statistic for association between imputed genotype and disease in a sample of size Nf, in which f ≥ 1 is a rational function of ɛ12, ɛ13, ɛ21, ɛ23, ɛ31, ɛ32, k, MAFcases, and MAFcontrols that represents the sample-size inflation factor. Thus, if a sample size of at least N is required for achieving a specified level of power when genotype is measured without error, then a sample size of at least Nf is required for achieving the same power when genotype is imputed with error. We use a special case of the formula for f, assuming k = 1, so that a study has an equal number of cases and controls. We also assume that Hardy-Weinberg proportions are satisfied separately in cases and controls. With these assumptions, the sample-size inflation factor due to imputation error can be written as f = g/g∗, defining g and g∗ as in equations 1 and A.1 of Kang et al.22 and matching our notation to that of Kang et al., with the substitutions P01 = , P02 = 2MAFcases(1 − MAFcases), P03 = (1 − MAFcases)2, P11 = , P12 = 2MAFcontrols(1 − MAFcontrols), and P13 = (1 − MAFcontrols)2.
To evaluate the sample-size inflation factor f at levels of imputation error appropriate for typical association studies, we first estimated the six error parameters by using genotypes of 426 individuals in 29 diverse populations. Employing reference panels of phased haplotypes based on ∼2,000,000 SNPs in 210 HapMap Phase II individuals together with ∼500,000 SNPs from a worldwide study,23 we imputed individual genotypes at markers that were included in the reference data but not in the worldwide study. For each population, we repeated the imputations underlying Figure 7 of Huang et al.,19 using the same procedure that was used by Huang et al.,19 to obtain an imputed data set of 513 markers. This set consisted of probabilistic imputations relying on the subset of reference individuals that, among seven choices in the work of Huang et al.,19 produced the highest imputation accuracy for that population. The genotypes of Pemberton et al.,24 which update those reported by Conrad et al.,25 were treated as true genotypes of the 513 markers for measurement of ɛij. For each population, at each marker, the minor and major alleles were determined only with the use of the “true” genotype data from that population. If each allele had a frequency of 50%, then the minor allele was assigned at random.
Treating the 426 individuals as unaffected, we classified 218,345 true genotypes (426 × 513, excluding missing data) by category, and for each population, we estimated ɛ12, ɛ13, ɛ21, ɛ23, ɛ31, and ɛ32. Each true genotype was categorized as follows: 1, minor allele homozygote; 2, heterozygote; 3, major allele homozygote. Considering all true genotypes in a population at all 513 markers, denote the number of true genotypes of types 1, 2, and 3 by n1, n2, and n3, respectively. For each population, n1, the smallest of the three quantities, was at least 70, so that at least 70 true genotypes were used in estimating each error parameter. For n1, n2, and n3, the medians across populations were 411, 1967, and 3679, respectively.
To incorporate the uncertainty inherent in imputing a genotype, we obtained posterior probabilities of imputing types 1, 2, and 3. Considering the ni genotypes of type i, denote the posterior probability that genotype ℓ was imputed to have type j by qijℓ. For each i, j ∈ {1, 2, 3}, i ≠ j, we computed ɛij for the population as . The “overall imputation error rate,” a weighted average of the ɛij that evaluates the total fraction of alleles imputed incorrectly, was calculated as .
For each population, Figure 1 displays the estimated values of ɛij. In most populations, the highest imputation error rate is ɛ12, indicating that, conditional on true genotype, the highest-probability error is misclassification of a minor allele homozygote as a heterozygote. The next highest error rate is usually ɛ13 or ɛ23, reflecting misclassification probabilities for minor allele homozygotes or heterozygotes, respectively, as major allele homozygotes. Misclassification probabilities for major allele homozygotes or heterozygotes as minor allele homozygotes (ɛ31 and ɛ21, respectively) are generally low.
Figure 1.
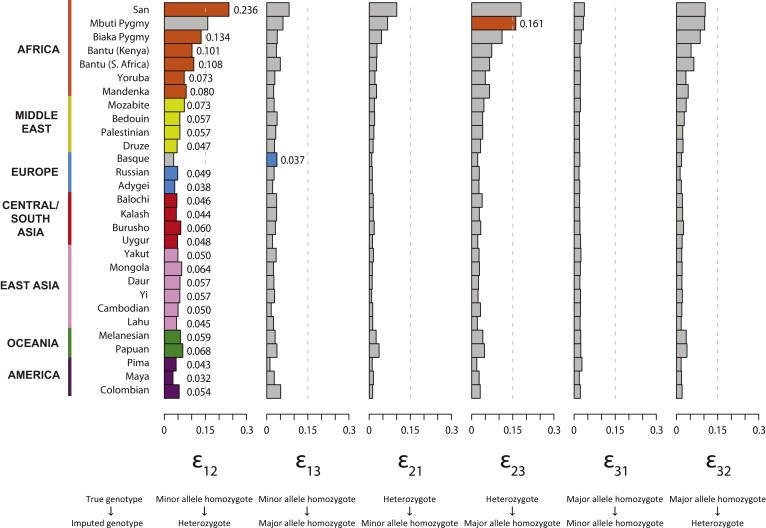
Genotype Misclassification Rates at Imputed Loci, in Each of 29 Populations
Each bar plot presents a particular error rate ɛij, in which ɛij represents the probability that genotype i is imputed as genotype j (1, minor allele homozygote; 2, heterozygote; 3, major allele homozygote). For each population, the greatest of the six error rates is shown in a color characteristic of the geographic region of the population. For convenience in interpreting the figure, the vertical dashed line indicates 15% error. The values plotted in the figure appear together with the overall imputation error rate in Table S1.
Treating the estimated values of ɛij as parametric values, for each population, we evaluated the sample-size inflation factor f for various choices of the unknown MAFcases and MAFcontrols. Because the difference δ = MAFcases − MAFcontrols can be viewed as a measure of the magnitude of the association at a disease locus, we reparametrized f in terms of δ and MAFcontrols. Thus, using observed levels of imputation error, we examined the properties of f across the range of possible frequencies for the disease allele in cases and controls (Figure 2). For most choices of the parameter values in most populations, the inflation factor f lies between 1.1 and 1.6. For most African populations, consistent with their higher imputation error rates, f is considerably greater than in other populations, ranging from 1.3 to 2.5 for most choices of the parameter values. The inflation factor is especially high in the San and Mbuti Pygmy populations, in which nearly all choices examined for δ and MAFcontrols produce f ≳ 1.7. Disease alleles are difficult to detect when |δ| is small, and Figure 2 demonstrates that for several populations, the sample-size inflation factor is greatest for small |δ|, particularly when the disease locus has a low minor allele frequency of MAFcontrols = 0.05.
Figure 2.
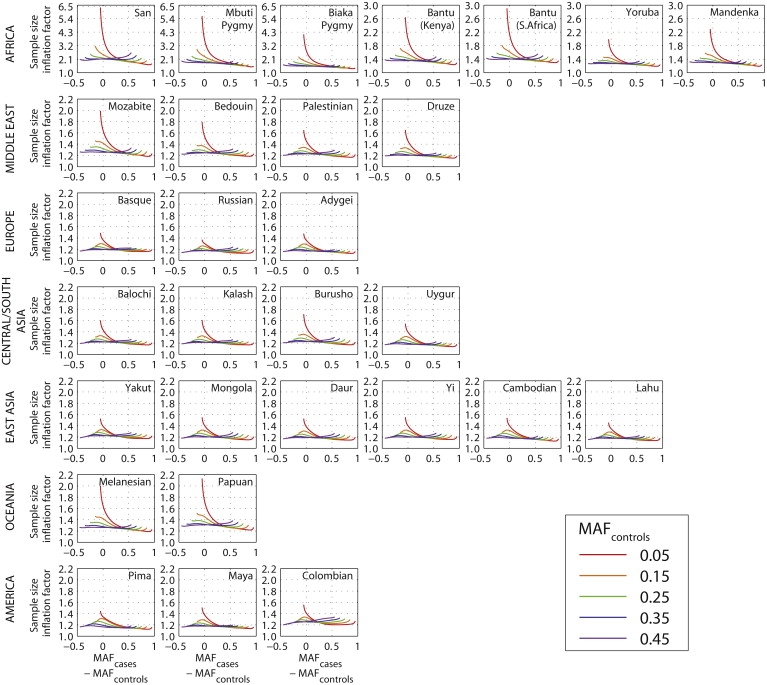
Sample-Size Inflation Factor f Required for Maintaining Statistical Power at Imputed Loci, as a Function of the True Difference in the Frequency of the Minor Allele between Cases and Controls
Each plot utilizes the estimated imputation error rates in Figure 1 for a specific population. For each population, the inflation factor is plotted for five choices of the true minor allele frequency in controls (0.05, 0.15, 0.25, 0.35, and 0.45). Note that MAFcontrols ranges from 0 to 0.5, whereas MAFcases, representing the frequency in cases of the minor allele in controls, ranges from 0 to 1. We used a step size of 0.001 for MAFcases and disregarded points with MAFcases = MAFcontrols.
Because the parameters MAFcases and MAFcontrols are unknown in actual association studies, for each population, conditional on the imputation error parameters ɛij, we examined the minimal and maximal values of the sample-size inflation factor f across the range of possible values for MAFcases and MAFcontrols (Figure 3). For most non-African populations, across most of the range of possible values for the minor allele frequency in controls, the minimal f is typically in the range of 1.1–1.2 and the maximum is typically in the range of 1.2–1.6, indicating that the extra sample size required for maintaining power is usually at least 10%–20% and at most 20%–60%. The maximal f is generally greater for low values of MAFcontrols.
Figure 3.
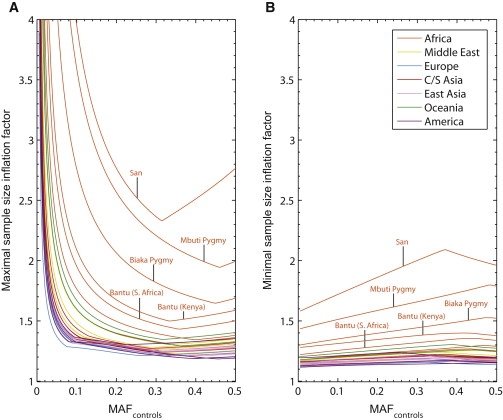
Maximal and Minimal Sample-Size Inflation Factors at Imputed Loci as Functions of the True Minor Allele Frequency in Controls, in Each of 29 Populations
For each value of MAFcontrols from 0.005 to 0.5 with a step size of 0.005, the value plotted is the maximal or minimal value of the inflation factor f obtained across choices of MAFcases ranging from 0 to 1 with a step size of 0.001 (MAFcases ≠ MAFcontrols). Graphs for individual populations are color-coded by geographic region.
(A) Maximal sample-size inflation factor.
(B) Minimal sample-size inflation factor.
Upon examining the minimal and maximal sample-size inflation factor across the range of disease allele frequencies (Figure 3), we observe that the values are greatest in populations with the highest imputation error rates (Figure 1). Figure 4 quantifies this observation, illustrating the relationships with overall imputation error rate of the minimal and maximal values of f. A linear regression of the minimal sample-size inflation factor on overall imputation error rate when MAFcontrols is fixed at 0.3, forced through the point at which no imputation errors occur and therefore no sample-size inflation occurs, provides a close fit for most populations, with the exceptions of the San and Mbuti Pygmy populations. The slope for this regression is 6.911, and the corresponding regression for the maximal sample-size inflation factor has a slope of 10.177. Excluding the San and Mbuti Pygmy populations, the slopes of the regressions for the minimal and maximal sample-size inflation factors decrease to 6.203 and 8.836, respectively (Figure S1, available online). The regression slopes generally lie between 5 and 13 when MAFcontrols is fixed at various values across its range, with the San and Mbuti Pygmy populations either included or excluded (Figures S1 and S2). These values have the interpretation that each 1% increase in overall imputation error rate translates to an increase of ∼5%–13% in the sample size required for maintaining power.
Figure 4.
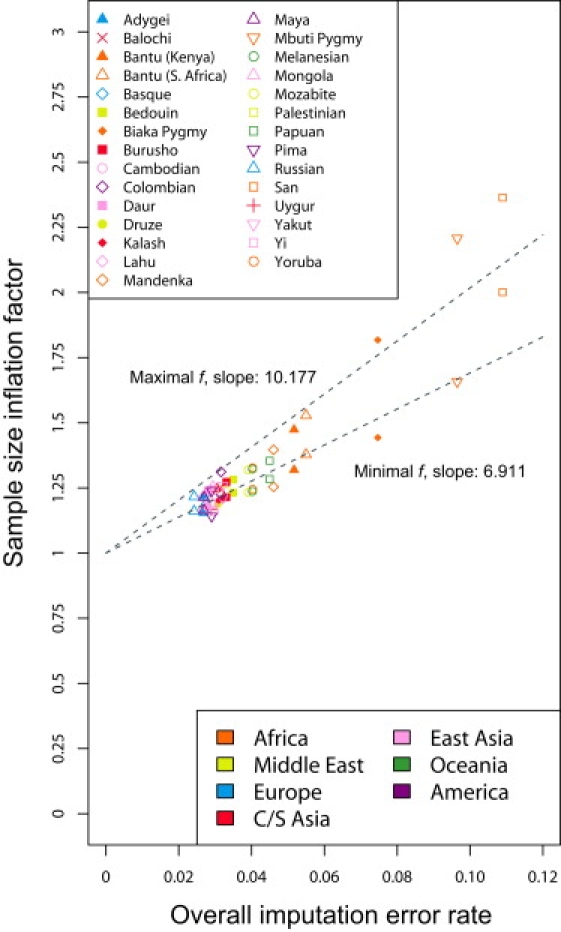
Maximal and Minimal Sample-Size Inflation Factors as Functions of the Overall Imputation Error Rate, for an Imputed Disease Locus with a True Minor Allele Frequency of 0.3 in Controls
Populations are color-coded by geographic region, and two data points appear for each population: a maximum and a minimum. Best-fit linear-regression lines for the maxima and minima, forced through the point (0,1), indicate the increase in the inflation factor with increasing imputation error rate. For example, the lines indicate that in most populations, at MAFcontrols = 0.3, imputation error rates of 2%–6% correspond to sample-size inflation factors of ∼14%–53%, and each additional 1% increase in imputation error corresponds to a ∼7%–10% increase in the inflation factor.
Our results have important implications for imputation studies. In the tag-SNP setting, for small values of x, a high LD level of r2 = 1 − x produces a relatively small sample-size inflation factor of 1/(1 − x) ≈1 + x, so that each 1% loss in the r2 measure of LD leads to a ∼1% gain in the required sample size. In the imputation setting, however, imputation accuracy of 1 − x produces a typical inflation factor of ∼1 + 5x to ∼1 + 13x, so that each 1% loss in imputation accuracy leads to a ∼5%–13% increase in the required sample size. As a result, even low levels of imputation error can have sizeable consequences. For example, measures that aim to assess genomic coverage for imputation methods might need to require stringent levels of imputation error in evaluating the proportion of the genome that is suited to imputation-based association mapping. Studies that aim to confirm associations at imputed markers in populations with lower imputation accuracy might inherently be disadvantaged for success in replication studies. In these various settings, careful assessment of appropriate sample sizes in power calculations will be essential for progress in imputation-based disease-gene identification. One key observation is that imputation error produces the greatest sample-size inflation for markers with low minor allele frequency (MAFcontrols ≤ 0.1), and for such markers, the sample-size inflation for each 1% imputation error can be as high as ∼15%–35% (Figures S1 and S2). As GWA efforts begin to focus on the impact of rare alleles on complex diseases, the potentially serious effects of imputation error for detecting such alleles will be a central consideration for forthcoming studies. For such studies, it will be informative to examine values of the imputation error parameters ɛij evaluated specifically from rare alleles.
We note that the linear dependence of the minimal and maximal sample-size inflation factor on overall imputation error rate, as illustrated in Figure 4, is only approximate. This approximate linear relationship arises because the overall imputation error rate is a composite parameter dependent on the six underlying ɛij parameters, each of which affects the inflation factor in an approximately linear manner. On the basis of a first-order Taylor series expansion for f, for each i and j, Kang et al.22 derived cost functions Cij, so that if all error parameters except ɛij are set to zero and ɛij is small, then the sample-size inflation factor is approximately 1 + Cijɛij. These linear approximations accurately reflect the sample-size inflation factor in most populations except at the lowest values of MAFcases and MAFcontrols (results not shown) and suggest that in general, the greatest cost is incurred from errors in imputing minor allele homozygotes as major allele homozygotes (Figure 5). It is noteworthy that the linear regressions in Figure 4 provide the poorest underestimates in the San population, for which the parameter ɛ13 for the most costly type of error is high and for which the pattern of errors differs somewhat from the corresponding patterns in the other populations (Figure 1).
Figure 5.
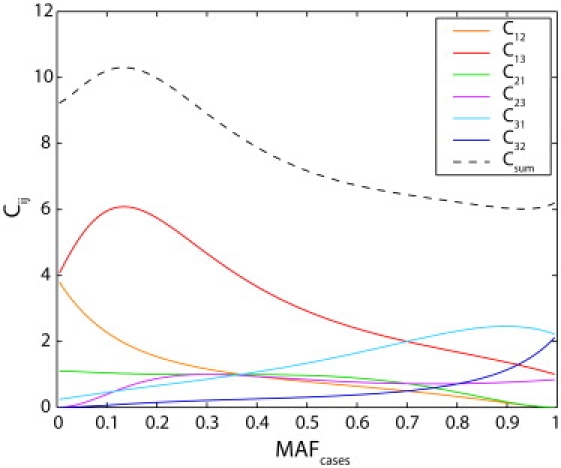
Cost Coefficients as Functions of MAFcases for the Fixed Value MAFcontrols = 0.3
The coefficient Cij provides an approximation for the relative magnitude of the sample-size inflation that is due to the error parameter ɛij. Thus, a small increase of x in the imputation error parameter ɛij adds approximately Cijx to the sample-size inflation factor. The sum of the six cost coefficients, Csum, has the interpretation that Csumx is added to the sample-size inflation factor when all six of the ɛij are simultaneously set to x. Each of the cost coefficients was evaluated for values of MAFcases from 0.005 to 0.995 at intervals of 0.01.
Although an increased sample size provides one approach to maintaining power in an imputation-based study, an alternative strategy is to decrease imputation error instead. Reductions in imputation error can be achieved through a combination of algorithmic advances and optimal choices of imputation algorithms,13,15 improvements in usage of existing reference panels,19,26 and expanded marker density and sample inclusion in these panels.18,27 A fourth approach involves incorporating information on relatives of study subjects for the improvement of phase estimates at measured markers. Although this approach will not eliminate errors owing to incorrect imputation conditional on correctly estimated phase, it will reduce imputation errors that arise from incorrect phase estimation.
For populations with relatively little imputation error in which large samples are easily obtained, the required sample-size increase produced by imputation error might not pose a significant obstacle for GWA studies. In other populations in which subject recruitment is difficult and the sample-size inflation required for maintaining power is extreme, reduction of imputation error might be more feasible than an increase in sample size. As GWA studies begin diversifying to incorporate additional populations beyond the populations of European origin that have been typical of most investigations to date,28 it will be important to evaluate the relative merits of the various approaches for overcoming the consequences of imputation error to improve the potential of imputation-based association studies.
Acknowledgments
We thank M. Boehnke, Y. Li, and two reviewers for helpful comments. This work was supported by National Institutes of Health grants R01 GM081441 and R01 HL090564, by a Burroughs Wellcome Fund Career Award in the Biomedical Sciences, and by an Alfred P. Sloan Research Fellowship.
Supplemental Data
References
- 1.Li Y., Ding J., Abecasis G.R. Mach 1.0: Rapid haplotype reconstruction and missing genotype inference. Am. J. Hum. Genet. 2006;79:S2290. [Google Scholar]
- 2.Nicolae D.L. Testing untyped alleles (TUNA) — applications to genome-wide association studies. Genet. Epidemiol. 2006;30:718–727. doi: 10.1002/gepi.20182. [DOI] [PubMed] [Google Scholar]
- 3.Marchini J., Howie B., Myers S., McVean G., Donnelly P. A new multipoint method for genome-wide association studies by imputation of genotypes. Nat. Genet. 2007;39:906–913. doi: 10.1038/ng2088. [DOI] [PubMed] [Google Scholar]
- 4.Servin B., Stephens M. Imputation-based analysis of association studies: Candidate regions and quantitative traits. PLoS Genet. 2007;3:1296–1308. doi: 10.1371/journal.pgen.0030114. [DOI] [PMC free article] [PubMed] [Google Scholar]
- 5.Browning S.R. Missing data imputation and haplotype phase inference for genome-wide association studies. Hum. Genet. 2008;124:439–450. doi: 10.1007/s00439-008-0568-7. [DOI] [PMC free article] [PubMed] [Google Scholar]
- 6.Scott L.J., Mohlke K.L., Bonnycastle L.L., Willer C.J., Li Y., Duren W.L., Erdos M.R., Stringham H.M., Chines P.S., Jackson A.U. A genome-wide association study of type 2 diabetes in Finns detects multiple susceptibility variants. Science. 2007;316:1341–1345. doi: 10.1126/science.1142382. [DOI] [PMC free article] [PubMed] [Google Scholar]
- 7.Wellcome Trust Case Control Consortium Genome-wide association study of 14,000 cases of seven common diseases and 3,000 shared controls. Nature. 2007;447:661–678. doi: 10.1038/nature05911. [DOI] [PMC free article] [PubMed] [Google Scholar]
- 8.Barrett J.C., Hansoul S., Nicolae D.L., Cho J.H., Duerr R.H., Rioux J.D., Brant S.R., Silverberg M.S., Taylor K.D., Barmada M.M. Genome-wide association defines more than 30 distinct susceptibility loci for Crohn's disease. Nat. Genet. 2008;40:955–962. doi: 10.1038/NG.175. [DOI] [PMC free article] [PubMed] [Google Scholar]
- 9.Zeggini E., Scott L.J., Saxena R., Voight B.F., Diabetes Genetics Replication And Meta-analysis (DIAGRAM) Consortium Meta-analysis of genome-wide association data and large-scale replication identifies additional susceptibility loci for type 2 diabetes. Nat. Genet. 2008;5:638–645. doi: 10.1038/ng.120. [DOI] [PMC free article] [PubMed] [Google Scholar]
- 10.Willer C.J., Sanna S., Jackson A.U., Scuteri A., Bonnycastle L.L., Clarke R., Heath S.C., Timpson N.J., Najjar S.S., Stringham H.M. Newly identified loci that influence lipid concentrations and risk of coronary artery disease. Nat. Genet. 2008;40:161–169. doi: 10.1038/ng.76. [DOI] [PMC free article] [PubMed] [Google Scholar]
- 11.Yu Z., Schaid D.J. Methods to impute missing genotypes for population data. Hum. Genet. 2007;122:495–504. doi: 10.1007/s00439-007-0427-y. [DOI] [PubMed] [Google Scholar]
- 12.Guan Y., Stephens M. Practical issues in imputation-based association mapping. PLoS Genet. 2008;4:e1000279. doi: 10.1371/journal.pgen.1000279. [DOI] [PMC free article] [PubMed] [Google Scholar]
- 13.Pei Y.-F., Li J., Zhang L., Papasian C.J., Deng H.-W. Analyses and comparison of accuracy of different genotype imputation methods. PLoS ONE. 2008;3:e3551. doi: 10.1371/journal.pone.0003551. [DOI] [PMC free article] [PubMed] [Google Scholar]
- 14.Zhao Z., Timofeev N., Hartley S.W., Chui D.H.K., Fucharoen S., Perls T.T., Steinberg M.H., Baldwin C.T., Sebastiani P. Imputation of missing genotypes: An empirical evaluation of IMPUTE. BMC Genet. 2008;9:85. doi: 10.1186/1471-2156-9-85. [DOI] [PMC free article] [PubMed] [Google Scholar]
- 15.Nothnagel M., Ellinghaus D., Schreiber S., Krawczak M., Franke A. A comprehensive evaluation of SNP genotype imputation. Hum. Genet. 2009;125:163–171. doi: 10.1007/s00439-008-0606-5. [DOI] [PubMed] [Google Scholar]
- 16.Pritchard J.K., Przeworski M. Linkage disequilibrium in humans: Models and data. Am. J. Hum. Genet. 2001;69:1–14. doi: 10.1086/321275. [DOI] [PMC free article] [PubMed] [Google Scholar]
- 17.de Bakker P.I.W., Ferreira M.A.R., Jia X., Neale B.M., Raychaudhuri S., Voight B.F. Practical aspects of imputation-driven meta-analysis of genome-wide association studies. Hum. Mol. Genet. 2008;17:R122–R128. doi: 10.1093/hmg/ddn288. [DOI] [PMC free article] [PubMed] [Google Scholar]
- 18.Browning B.L., Browning S.R. A unified approach to genotype imputation and haplotype-phase inference for large data sets of trios and unrelated individuals. Am. J. Hum. Genet. 2009;84:210–223. doi: 10.1016/j.ajhg.2009.01.005. [DOI] [PMC free article] [PubMed] [Google Scholar]
- 19.Huang L., Li Y., Singleton A.B., Hardy J.A., Abecasis G., Rosenberg N.A., Scheet P. Genotype imputation accuracy across worldwide human populations. Am. J. Hum. Genet. 2009;84:235–250. doi: 10.1016/j.ajhg.2009.01.013. [DOI] [PMC free article] [PubMed] [Google Scholar]
- 20.Lettre G., Jackson A.U., Gieger C., Schumacher F.R., Berndt S.I., Sanna S., Eyheramendy S., Voight B.F., Butler J.L., Guiducci C. Identification of ten loci associated with height highlights new biological pathways in human growth. Nat. Genet. 2008;40:584–591. doi: 10.1038/ng.125. [DOI] [PMC free article] [PubMed] [Google Scholar]
- 21.Gordon D., Finch S.J., Nothnagel M., Ott J. Power and sample size calculations for case-control genetic association tests when errors are present: Application to single nucleotide polymorphisms. Hum. Hered. 2002;54:22–33. doi: 10.1159/000066696. [DOI] [PubMed] [Google Scholar]
- 22.Kang S.J., Gordon D., Finch S.J. What SNP genotyping errors are most costly for genetic association studies? Genet. Epidemiol. 2004;26:132–141. doi: 10.1002/gepi.10301. [DOI] [PubMed] [Google Scholar]
- 23.Jakobsson M., Scholz S.W., Scheet P., Gibbs J.R., VanLiere J.M., Fung H.-C., Szpiech Z.A., Degnan J.H., Wang K., Guerreiro R. Genotype, haplotype, and copy-number variation in worldwide human populations. Nature. 2008;451:998–1003. doi: 10.1038/nature06742. [DOI] [PubMed] [Google Scholar]
- 24.Pemberton T.J., Jakobsson M., Conrad D.F., Coop G., Wall J.D., Pritchard J.K., Patel P.I., Rosenberg N.A. Using population mixtures to optimize the utility of genomic databases: Linkage disequilibrium and association study design in India. Ann. Hum. Genet. 2008;72:535–546. doi: 10.1111/j.1469-1809.2008.00457.x. [DOI] [PMC free article] [PubMed] [Google Scholar]
- 25.Conrad D.F., Jakobsson M., Coop G., Wen X., Wall J.D., Rosenberg N.A., Pritchard J.K. A worldwide survey of haplotype variation and linkage disequilibrium in the human genome. Nat. Genet. 2006;38:1251–1260. doi: 10.1038/ng1911. [DOI] [PubMed] [Google Scholar]
- 26.Howie B.N., Donnelly P., Marchini J. A flexible and accurate genotype imputation method for the next generation of genome-wide association studies. PLoS Genet. 2009;5:e1000529. doi: 10.1371/journal.pgen.1000529. [DOI] [PMC free article] [PubMed] [Google Scholar]
- 27.Becker T., Flaquer A., Brockschmidt F.F., Herold C., Steffens M. Evaluation of potential power gain with imputed genotypes in genome-wide association studies. Hum. Hered. 2009;68:23–34. doi: 10.1159/000210446. [DOI] [PubMed] [Google Scholar]
- 28.Cooper R.S., Tayo B., Zhu X. Genome-wide association studies: Implications for multiethnic samples. Hum. Mol. Genet. 2008;17:R151–R155. doi: 10.1093/hmg/ddn263. [DOI] [PMC free article] [PubMed] [Google Scholar]
Associated Data
This section collects any data citations, data availability statements, or supplementary materials included in this article.