

Abstract
Three genetic loci for lung cancer risk have been identified by genome-wide association studies (GWAS), but inherited susceptibility to specific histologic types of lung cancer is not well established. We conducted a GWAS of lung cancer and its major histologic types, genotyping 515,922 single-nucleotide polymorphisms (SNPs) in 5739 lung cancer cases and 5848 controls from one population-based case-control study and three cohort studies. Results were combined with summary data from ten additional studies, for a total of 13,300 cases and 19,666 controls of European descent. Four studies also provided histology data for replication, resulting in 3333 adenocarcinomas (AD), 2589 squamous cell carcinomas (SQ), and 1418 small cell carcinomas (SC). In analyses by histology, rs2736100 (TERT), on chromosome 5p15.33, was associated with risk of adenocarcinoma (odds ratio [OR] = 1.23, 95% confidence interval [CI] = 1.13–1.33, p = 3.02 × 10⁻⁷), but not with other histologic types (OR = 1.01, p = 0.84 and OR = 1.00, p = 0.93 for SQ and SC, respectively). This finding was confirmed in each replication study and overall meta-analysis (OR = 1.24, 95% CI = 1.17–1.31, p = 3.74 × 10⁻¹⁴ for AD; OR = 0.99, p = 0.69 and OR = 0.97, p = 0.48 for SQ and SC, respectively). Other previously reported association signals on 15q25 and 6p21 were also refined, but no additional loci reached genome-wide significance. In conclusion, a lung cancer GWAS identified a distinct hereditary contribution to adenocarcinoma.
Main Text
Recently, three genome-wide association studies (GWAS) of lung cancer and subsequent pooled GWAS analyses identified inherited susceptibility variants on chromosome 15q25,1–3 5p15,4–6 and 6p21.5 Lung cancer is classified into two main histologic groups: small cell lung cancer (SC) and non-small cell lung cancer; the latter includes adenocarcinoma (AD) and squamous cell carcinoma (SQ), along with rarer subtypes. Worldwide, adenocarcinoma is the most frequently identified histologic type, and the relative proportion of lung cancer due to this histology has steadily risen. Demographic, etiologic, clinical, and molecular characteristics of the lung cancer subtypes have been reported.7 Although family history of lung cancer has been associated with histologic subtypes,8–11 the inherited susceptibility factors that affect specific histologies are unknown.
We conducted a GWAS in 5739 lung cancer cases and 5848 controls (National Cancer Institute [NCI] GWAS) to search for overall susceptibility variants and variants associated with specific histologic types and smoking status. We also conducted a meta-analysis of the NCI GWAS with summary data from ten additional studies, for a total of 13,300 primary lung cancer cases and 19,666 controls, all of European descent. Four of the ten studies provided information on histology for replication analyses; 3333 AD, 2589 SQ, and 1418 SC cases were analyzed overall.
The 11,587 subjects in the NCI GWAS were drawn from one population-based case-control study and three cohort studies (Table 1); specifically: the Environment and Genetics in Lung Cancer Etiology (EAGLE),12 a population-based case-control study including 2100 primary lung cancer cases and 2120 healthy controls enrolled in Italy between 2002 and 2005; the Alpha-Tocopherol, Beta-Carotene Cancer Prevention Study (ATBC),13 a randomized primary prevention trial including 29,133 male smokers enrolled in Finland between 1985 and 1993; the Prostate, Lung, Colon, Ovary Screening Trial (PLCO),14 a randomized trial including 150,000 individuals enrolled in ten U.S. study centers between 1992 and 2001; and the Cancer Prevention Study II Nutrition Cohort (CPS-II),15 including over 183,000 subjects enrolled by the American Cancer Society between 1992 and 2001 across all U.S. states. Analyses stratified by histology in the NCI GWAS included 1730 AD cases, 1400 SQ cases, 678 SC cases, and groups of other histological types or of mixed histologies. These studies were approved by the individual institutional review boards of each location, and each subject gave his or her informed consent for participation.
Table 1.
Studies Included in the Genome-wide Association Analysis of Lung Cancer
|
No. of Subjects |
|||||
|---|---|---|---|---|---|
| Study | Cases | Controls | Location | Study Design | Illumina HumanHap Chips |
| NCI GWAS | |||||
| EAGLEa | 1920 | 1979 | Italy | Population-based case-control | 550K, 610QUAD |
| ATBCb | 1732 | 1271 | Finland | Cohort | 550K, 610QUAD |
| PLCOc | 1390 | 1924 | 10 US Centers | Cohort–Cancer Prevention Trial | 317K+240S, 550K, 610QUAD |
| CPS-IId | 697 | 674 | All US States | Cohort | 550K, 610QUAD, 1M |
| TOTAL | 5739 | 5848 | |||
| Meta-Analysis | |||||
| UK | 1978 | 1438 | UK | Hospital-based cases, birth cohort controls | 550K |
| Central Europe | 1837 | 2432 | Romania, Hungary, Slovakia, Poland, Russia, Checz Rep. | Multicenter hospital-based case-control | 317K, 370Duo |
| Texas | 1154 | 1137 | Texas, USA | Hospital-based case-control | 317K |
| DeCODE Genetics | 719 | 6030 | Iceland | Population-based case-control | 317K, 370Duo |
| HGF Germanye | 506 | 480 | Germany | Population-based case-control (<50 years) | 550K |
| CARETf | 397 | 393 | 6 US Centers | Cancer Prevention Trial | 370Duo |
| HUNT2/Tromsog | 394 | 382 | Norway | Population-based case-control | 370Duo |
| Canada | 332 | 505 | Greater Toronto area | Hospital-based case-control | 317K |
| France | 135 | 146 | Paris and Caen areas | Hospital-based case-control | 370Duo |
| Estonia | 109 | 874 | Estonia | Hospital-based case-control | 317K, 370Duo |
| TOTAL | 7561 | 13818 | |||
| Grand Total | 13300 | 19666 | |||
Environment and Genetics in Lung Cancer Etiology study.
Alpha-Tocopherol, Beta-Carotene Cancer Prevention study.
Prostate, Lung, Colon, Ovary screening trial.
Cancer Prevention Study II nutrition cohort.
Helmholtz-Gemeinschaft Deutscher Forschungszentren Lung Cancer GWAS.
Carotene and Retinol Efficacy Trial cohort.
North Trondelag Health Study 2 / Tromsø IV.
The meta-analysis included all of the NCI GWAS data plus summary data from ten additional studies contributing 7561 cases and 13,818 controls (Table 1): (1) the UK study from the Institute for Cancer Research,5 including lung cancer cases from the Genetic Lung Cancer Predisposition Study established in 1999 and controls from the 1958 birth cohort;16 (2) the International Agency for Research on Cancer (IARC) study in central Europe,1 a hospital-based case-control study conducted in the Czech Republic, Hungary, Poland, Romania, Russia, and Slovakia between 1998 and 2002; (3) the Texas case-control study,2 including cases newly diagnosed at the University of Texas M.D. Anderson Cancer Center since 1991 and controls from the Kelsey-Seybold clinics (the GWAS included only smokers and cases with non-small cell lung cancer); (4) the population-based case-control study from deCODE Genetics in Iceland,3 including all Icelandic subjects originally recruited for different genetic studies between 1996 and 2007 at deCODE Genetics and lung cancer cases recruited from the Icelandic Cancer Registry since 1998; (5) the Helmholtz-Gemeinschaft Deutscher Forschungszentren (HGF) lung cancer GWA study,17 including lung cancer cases diagnosed at ≤ 50 years from the LUng Cancer in the Young (LUCY) study, a multicenter study within 31 German hospitals, and the Heidelberg lung cancer study, a hospital-based case-control study conducted by the German Cancer Research Center (DKFZ) (controls were selected from the Cooperative Health Research in the Region of Augsburg [KORA]); (6) the Carotene and Retinol Efficacy Trial (CARET) cohort,18 including smokers with a smoking history of at least 20 pack-years enrolled in six U.S. centers between 1983 and 1994; (7) the HUNT2/Tromso study, including lung cancer cases and controls from the North Trondelag Health Study (HUNT 2),19 a population-based study conducted between 1995 and 1997 in North Trondelag County, and the Tromsø IV population-based study conducted in Tromsø County between 1994 and 1995; 8) the lung cancer study from Canada,1 including lung cancer cases recruited at the University of Toronto and the Samuel Lunenfeld Research Institute between 1997 and 2002 and GWAS controls randomly selected from family medicine clinics; 9) the lung cancer study from France,20 a hospital-based case-control study including smoking cases and controls recruited between 1988 and 1992 in ten French hospitals; and 10) the lung cancer study from Estonia, a hospital-based case-control study including lung cancer cases enrolled between 2002 and 2006 in Estonian hospitals and controls randomly selected from the Estonian Genome Project population-based cohort.21
Three studies (the Texas,2 deCODE,3 and HGF German17 studies) also contributed summary data from genome-wide scans stratified by histology, including 1138 AD, 578 SQ, and 210 SC cases. The UK study5 contributed data on the top single nucleotide polymorphisms (SNPs) of chromosome 5p15.33 by histology. These four studies contributed 1603 AD, 1189 SQ, and 740 SC cases to the meta-analysis by histology for this locus.
In both the NCI GWAS and the studies in the meta-analysis, the lung cancer diagnosis was based on clinical criteria and confirmed by pathology reports from surgery, biopsy, or cytology samples in approximately 95% of cases and on clinical history and imaging for the remaining 5%. Tumor histology was coded according to the International Classification of Diseases for Oncology. In analyses stratified by histology, only adenocarcinoma, squamous cell carcinoma, and small cell carcinoma cases were included. All mixed subtypes or other histologies were excluded. Overall, between 10% and 50% of all diagnoses from the NCI GWAS were centrally reviewed by expert lung pathologists from NCI.
The NCI GWAS scan was conducted at two institutions: the Center for Inherited Disease Research (CIDR), which genotyped all EAGLE and 1675 PLCO subjects, and the Core Genotyping Facility (CGF), NCI, which genotyped ATBC, CPS-II, and the remaining PLCO subjects. Controls from the Cancer Genetic Markers of Susceptibility (CGEMS) prostate cancer scan22 were also included.
EAGLE samples and 1675 PLCO samples were genotyped at CIDR, as part of the Gene Environment Association Studies Initiative (GENEVA) funded through the National Human Genome Research Institute, with the use of Illumina HumanHap550v3_B BeadChips (Illumina, San Diego, CA, USA). Data were released for 5620 of 5727 (98%) samples, including 32 blind duplicates (concordance was 99.993%); these were genotyped with 124 HapMap controls (66 CEU; 58 YRI). Allele cluster definitions per SNP were determined with the use of the Illumina BeadStudio Genotyping Module version 3.1.14 and the combined intensity data from 95% of the samples. The resulting cluster definitions were used on all samples. Genotypes were not called if the quality threshold (Gencall score) was below 0.15. Genotypes were released by CIDR for 560,505 (99.83% of attempted) SNPs. Genotypes were not released for SNPs not called by BeadStudio or for those with call rates less than 85%, more than one HapMap replicate error, more than a 3% (autosomal) or 5% (X chromosome) difference in call rate between genders, or more than 0.5% male AB frequency for the X chromosome. The mean non-Y chromosome SNP call rate and mean sample call rate were each 99.8% for the CIDR data set.
Similar procedures were followed at CGF for the ATBC, CPSII, and PLCO cohorts with the use of three Illumina platforms: the HumanHap550K, the HumanHap610, and HumanHap 1 Million chips. All genotyped samples passed quality control metrics at CGF. After removal of assay and locus as a result of low completion rates, genotypes for each sample that appeared in duplicate were merged to form consensus genotypes for each subject. There were 12,111 study subjects available for subsequent analysis. Table S1, available online, shows the distribution of subjects by study and phenotype after application of quality control (QC) metrics. Figure S1 shows the cluster plot for the most notable SNP, rs2736100.
A total of 221 pairs of samples were identified with >70% genotype concordance rate. Among them, 189 pairs were expected duplicates and had genotype concordance rates > 99.9%. There were 12 unexpected duplicates (cross or within studies) with >99.97% concordance rates. We evaluated the pairwise concordance on the basis of the entire set and observed 40 pairs of subjects with over 60% of concordant genotypes (genotype concordance > 60%). Exclusions are listed in Table S2. Deviations from Hardy-Weinberg proportions (HWP) were assessed in controls. Expected and observed p values were calculated with the use of the uniform distribution for all loci and the exact test, respectively. Autosomal SNPs with minor allele frequencies (MAFs) >5% and completion rates >95% were included. Deviation from HWP was minimal, and only loci with extremely low p values (p < 10−7) for each QC group were excluded from further analyses (Table S3). A quantile-quantile (Q-Q) plot of the p values per study is shown in Figure S2.
To assess population structure, we estimated imputed continental ancestry by using the STRUCTURE program,23 with a set of 12,898 autosomal SNPs with low local background linkage disequilibrium (LD) (pairwise r2 < 0.004 measured in the population of European ancestry for any pair of SNPs less than 500 kb apart)24 (Figure S3). Genotypes from the three HapMap populations (Build 22 for HapMap II with MAF > 5%)25 were used as reference populations. The number of inferred clusters (“K” parameter) was set to 3 for CEU, YRI, and JPT+CHB samples representing populations of European, African, and Asian origin, respectively. Eighteen subjects were detected as having less than 80% European ancestry and were excluded.
Principal component analysis (PCA) for each study group (excluding subjects with less than 80% European ancestry, unexpected duplicates, and potential relative pairs) was performed with the same informative 12,898 SNPs with the use of the EIGENSTRAT program26 (Figures S4A–S4D). After adjustment for significant principal components (PCs) in each study, comparison of observed and expected distributions showed no evidence for large-scale inflation of the association test statistics (inflation factor λ = 1.03, 103, 1.01, and 1.01 in EAGLE, PLCO, CPS-II, and ATBC, respectively), excluding the possibility of significant hidden population substructure. Q-Q plots for each NCI study are shown in Figures S5A–S5D.
After excluding 183 subjects for the reasons described above (summarized in Table S2) and 337 subjects with incomplete phenotype data, we report analyses on 515,922 SNPs in 5739 lung cancer cases and 5848 controls (NCI GWAS, Table 1).
Comparable QC procedures were conducted at each institution that provided summary results for the meta-analysis.1–5
For the genome-wide analysis of the NCI GWAS, we used unconditional logistic regression to derive a per-allele odds ratio (OR) and an associated 1 degree of freedom (df) association test adjusted for age in five-year intervals (defined as age at diagnosis or interview for the case-control study and as baseline age for cohort studies), gender, study (EAGLE, PLCO, ATBC, ACS), and four PCs for population stratification within studies (see description of PC analysis below). In additional analyses, we adjusted for smoking status (current, former, never), cigarettes smoked per day (≤ 10, 11–20, 21–30, 31–40, 41+), duration in 10 yr intervals, and number of years since quitting (1–5, 6–10, 11–20, 21–30, 30+) for former smokers (subjects who quit smoking at least 6 mo before participating in the study). The analyses with single and multiple SNPs stratified by histology, smoking status, and decade of birth were conducted with the use of the same models. Tests for interaction between a SNP (coded as a continuous variable) and smoking status or birth decade (coded with the use of dummy variables) were performed with Wald tests with the use of multiple dfs.
For the meta-analysis with other studies, we obtained per-allele ORs and standard errors from each study. Because only summary data were available, we conducted the meta-analysis in two separate groups: “Set 1 SNPs” included a core of 279,698 SNPs that were available across all studies; and “Set 2 SNPs” included 197,647 SNPs that were available only for a subset of the studies that used the HumanHap500 or denser genomic platforms or provided summary data on imputed SNPs. We obtained meta-analysis estimates of per-allele ORs and associated p values by using the weighted Z-score method under a fixed effect model.27 Tests for heterogeneity by study were performed with the use of the QE statistics, assuming a random effect model. For testing of heterogeneity across histologic subtypes, we reported the smallest p values obtained from pairwise case-case analyses between the subtypes after adjustment for multiple testing with the use of the Bonferroni correction. All odds-ratios were reported with respect to the minor allele in the pooled set of controls from all studies that contributed to the meta-analysis.
For adjustment of population stratification, we used the same set of 12,898 autosomal informative SNPs24 used for QC. We conducted PCA in each of the four study groups (EAGLE, PLCO, ATBC, and CPS-II) separately.27 For each study group, we identified among the top ten PCs the ones on which lung cancer cases and controls were not distributed evenly (the Wilcoxon rank-sum test p < 0.1), and adjusted them as continuous covariates nested within each study group. We selected two PCs for PLCO and one for each EAGLE and ATBC. No PCs were selected for the CPS-II study. Of note, we replicated the major analyses by using PCs obtained from all SNPs and found virtually identical results (data not shown).
Genome-wide analysis of the NCI GWAS confirmed previously reported findings on 5p15, 15q25, and 6p21, but did not conclusively identify novel susceptibility loci for lung cancer risk. Similar results were obtained in the overall meta-analysis combining the NCI GWAS with results from the ten additional studies, for a total of over 30,000 subjects (Figure 1 and Table S5).
Figure 1.
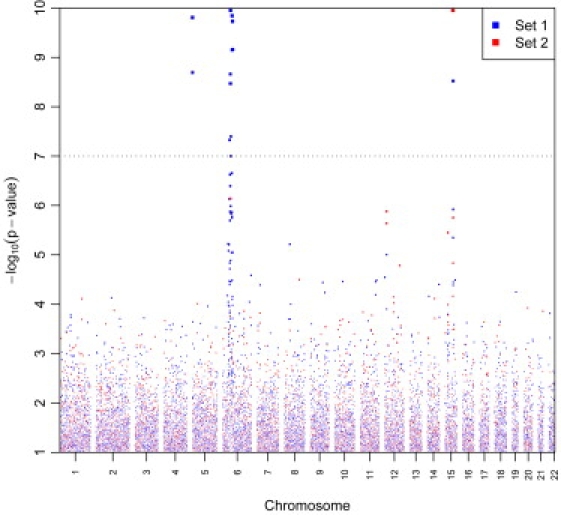
“Manhattan Plot” of Meta-Analysis Results for Lung Cancer Susceptibility Loci
Genome-wide association results for 13,300 primary lung cancer cases and 19,666 controls. −Log10 p values plotted against the chromosomal positions are depicted. “Set 1 SNPs” includes the core of 279,698 SNPs that were available across all studies. “Set 2 SNPs” includes 197,647 SNPs that were available only for a subset of the studies that used HumanHap500 or denser genomic platforms or provided summary data on imputed SNPs. The plot has been truncated at p < 10−10. There were 37 additional SNPs with lower p values, which are included in the list of the top 200 SNPs reported in Table S5.
The analysis of the locus on the 5p15.33 region4–6 provided notable findings. In the overall analysis of the NCI GWAS, the most prominent SNPs were rs4635969 (OR = 0.87, 95% confidence interval [CI] = 0.82–0.93, p = 9.80 × 10⁻⁵), followed by rs31489 in CLPTM1L (also named CCR9 [MIM 612585]) (OR = 0.90, 95% CI = 0.86–0.95, p = 2.80 × 10⁻⁴) and rs2736100 in TERT (MIM 187270) (OR = 1.09, 95% CI = 1.03–1.15, p = 0.001) (Table 2). rs2736100 showed discrepant results by smoking status (Table 2), which reflected different associations across histologies. In fact, this locus showed remarkable differences by histology (Figure 2). The rs2736100 SNP was associated only with AD (OR = 1.23, 95% CI = 1.13–1.33, p = 3.02 × 10⁻⁷), but not the other histologic types (OR = 1.01, p = 0.84 and OR = 1.00, p = 0.93, for SQ and SC, respectively; p = 0.001, test for heterogeneity across histologies corrected for multiple comparisons). The risk estimates were not altered by the adjustment for smoking and were consistent across categories of smoking intensity and decade of birth (data not shown). The analysis by smoking status (Table 2) revealed that the SNP was significantly associated with risk of adenocarcinoma in both smokers and those who had never smoked.
Table 2.
Association of Selected SNPs on 5p15 and 15q25 Loci with Lung Cancer Risk Overall and by Histologic Types and Smoking Status
| Marker,aAllele,bLocation,cGene,dMAFe | Study |
Overall NCI Data |
Adenocarcinoma NCI Data |
Squamous Cell Carcinoma NCI Data: |
Small Cell Carcinoma NCI Data: |
||||
|---|---|---|---|---|---|---|---|---|---|
| p Valuef | ORg(95% CI) | p Valuef | ORg(95% CI) | p Valuef | ORg(95% CI) | p Valuef | ORg(95% CI) | ||
| SNPs on Chromosome 5p15 | |||||||||
| rs2736100, (T,G), 1339516, TERT, 0.499/0.466 |
NCI_Smoking Unadjusted | 0.001 | 1.09 (1.03, 1.15) | 3.02 × 10⁻⁷ | 1.23 (1.13,1.33) | 0.84 | 1.01 (0.93, 1.10) | 0.93 | 1.00 (0.90, 1.13) |
| NCI_Current smokers | 0.41 | 1.03 (0.96-1.11) | 0.001 | 1.23 (1.09, 1.39) | 0.37 | 0.95 (0.85, 1.06) | 0.77 | 0.98 (0.85, 1.12) | |
| NCI_Former smokers | 0.02 | 1.11 (1.02, 1.22) | 0.01 | 1.17 (1.03, 1.33) | 0.13 | 1.13 (0.97, 1.31) | 0.81 | 1.03 (0.81, 1.30) | |
| NCI_Never smokers | 0.002 | 1.34 (1.11, 1.61) | 0.01 | 1.35 (1.07, 1.71) | 0.33 | 0.74 (0.40, 1.35) | 0.18 | 1.95 (0.70, 5.23) | |
| Meta-analysis Unadjusted | 1.60 × 10⁻¹⁰ | 1.12 (1.08, 1.16) | 3.74 × 10⁻¹⁴ | 1.24 (1.17, 1.31) | 0.69 | 0.99 (0.93, 1.05) | 0.48 | 0.97 (0.89, 1.05) | |
| rs31489, (C,A), 1395714, CLPTM1L, 0.411/0.385 |
NCI_Smoking Unadjusted | 2.80 × 10⁻⁴ | 0.90 (0.86, 0.95) | 0.067 | 0.93 (0.86, 1.00) | 8.51 × 10⁻⁵ | 0.84 (0.77, 0.91) | 0.089 | 0.90 (0.80, 1.01) |
| NCI_Current smokers | 0.008 | 0.90 (0.83-0.97) | 0.21 | 0.92 (0.82, 1.05) | 0.0003 | 0.81 (0.73, 0.91) | 0.22 | 0.92 (0.80, 1.05) | |
| NCI_Former smokers | 0.33 | 0.95 (0.87, 1.05) | 0.68 | 0.97 (0.86, 1.11) | 0.35 | 0.93 (0.79, 1.09) | 0.11 | 0.82 (0.64, 1.05) | |
| NCI_Never smokers | 0.37 | 0.92 (0.77, 1.10) | 0.45 | 0.92 (0.73, 1.15) | 0.41 | 0.77 (0.41, 1.44) | 0.76 | 1.15 (0.47, 2.85) | |
| Meta-analysis Unadjusted | 1.56 × 10⁻¹⁰ | 0.89 (0.86, 0.92) | 0.005 | 0.92 (0.87, 0.98) | 1.39 × 10⁻⁵ | 0.87 (0.81, 0.92) | 0.024 | 0.91 (0.83, 0.99) | |
| rs4635969, (C,T), 1361552, TERT, CLPTM1L, 0.199/0.184 |
NCI_Smoking Unadjusted | 9.80 × 10⁻⁵ | 0.87 (0.82, 0.93) | 5.49 × 10⁻⁵ | 0.81 (0.73, 0.90) | 0.031 | 0.88 (0.79, 0.99) | 0.055 | 0.86 (0.74, 1.00) |
| NCI_Current smokers | 0.08 | 0.92 (0.83, 1.01) | 0.02 | 0.82 (0.70, 0.96) | 0.12 | 0.89 (0.77, 1.03) | 0.20 | 0.89 (0.74, 1.06) | |
| NCI_Former smokers | 0.001 | 0.83 (0.74, 0.93) | 0.006 | 0.80 (0.68, 0.94) | 0.20 | 0.88 (0.72, 1.07) | 0.11 | 0.77 (0.56, 1.06) | |
| NCI_Never smokers | 0.27 | 0.88 (0.69, 1.11) | 0.08 | 0.76 (0.56, 1.04) | 0.61 | 1.21 (0.58, 2.52) | 0.73 | 0.81 (0.23, 2.78) | |
| Meta-analysis Unadjusted | 2.15 × 10⁻⁸ | 0.88 (0.84, 0.92) | 6.39 × 10⁻⁶ | 0.83 (0.77, 0.90) | 0.005 | 0.88 (0.80, 0.96) | 0.20 | 0.92 (0.80, 1.05) | |
| SNPs on Chromosome 15q25 | |||||||||
| rs12914385, (C,T), 76685778, CHRNA3, 0.386/0.452 | NCI_Smoking Unadjusted | 5.24 × 10⁻²⁷ | 1.34 (1.27, 1.42) | 3.93 × 10⁻¹⁴ | 1.36 (1.25, 1.47) | 5.23 × 10⁻¹² | 1.36 (1.24, 1.48) | 3.76 × 10⁻⁸ | 1.38 (1.23, 1.55) |
| NCI_Current smokers | 6.12 × 10⁻¹⁸ | 1.41 (1.31, 1.53) | 2.88 × 10⁻⁸ | 1.42 (1.25, 1.61) | 2.12 × 10⁻⁸ | 1.38 (1.23, 1.55) | 4.28 × 10⁻⁷ | 1.43 (1.25, 1.65) | |
| NCI_Former smokers | 6.11 × 10⁻¹⁰ | 1.34 (1.22, 1.47) | 5.65 × 10⁻⁷ | 1.38 (1.22, 1.57) | 2.92 × 10⁻⁵ | 1.39 (1.19, 1.62) | 0.05 | 1.27 (1.00, 1.61) | |
| NCI_Never smokers | 0.24 | 1.11 (0.93, 1.34) | 0.24 | 1.15 (0.92, 1.46) | 0.84 | 0.94 (0.50, 1.75) | 0.16 | 2.00 (0.76, 5.27) | |
| Meta-analysis Unadjusted | 2.75 × 10−38 | 1.30 (1.25, 1.36) | 3.32 × 10⁻¹⁸ | 1.31 (1.23, 1.40) | 8.72 × 10⁻¹³ | 1.30 (1.21, 1.40) | 2.31 × 10⁻⁹ | 1.37 (1.24, 1.52) | |
| rs1051730, (C,T), 76681394, CHRNA5,CHRNA3, 0.348/0.413 | NCI_Smoking Unadjusted | 3.63 × 10⁻²⁵ | 1.33 (1.26, 1.41) | 4.21x10⁻¹⁴ | 1.36 (1.26, 1.47) | 1.93x 10⁻⁹ | 1.31 (1.20, 1.43) | 6.70 × 10⁻⁸ | 1.38 (1.23, 1.55) |
| NCI_Current smokers | 1.30 × 10⁻¹⁷ | 1.42 (1.31, 1.53) | 1.03x10⁻⁸ | 1.44 (1.27, 1.63) | 4.7x10⁻⁷ | 1.34 (1.20, 1.50) | 2.58 × 10⁻⁷ | 1.45 (1.26, 1.67) | |
| NCI_Former smokers | 3.66 × 10⁻⁸ | 1.30 (1.19, 1.43) | 8.05x10⁻⁷ | 1.38 (1.21, 1.57) | 0.0005 | 1.32 (1.13, 1.54) | 0.13 | 1.20 (0.95, 1.54) | |
| NCI_Never smokers | 0.14 | 1.15 (0.96, 1.38) | 0.22 | 1.16 (0.92, 1.46) | 0.71 | 1.13 (0.60, 2.11) | 0.08 | 2.44 (0.91, 6.51) | |
| Meta-analysis Unadjusted | 1.91 × 10−51 | 1.31 (1.27, 1.36) | 7.10 × 10⁻¹⁹ | 1.32 (1.24, 1.41) | 1.01 × 10⁻¹⁰ | 1.28 (1.18, 1.37) | 3.18 × 10⁻⁹ | 1.37 (1.23, 1.52) | |
| rs8034191, (T,C), 76593078, LOC123688, 0.352/0.414 | NCI_Smoking Unadjusted | 6.19 × 10⁻²⁰ | 1.29 (1.22, 1.36) | 1.61 × 10⁻¹⁰ | 1.30 (1.20, 1.40) | 1.10 × 10⁻⁷ | 1.26 (1.16, 1.38) | 1.31 × 10⁻⁵ | 1.29 (1.15, 1.45) |
| NCI_Current smokers | 3.51 × 10⁻¹⁴ | 1.36 (1.25, 1.47) | 4.14 × 10⁻⁷ | 1.38 (1.22, 1.56) | 2.49 × 10⁻⁵ | 1.27 (1.14, 1.43) | 7.14 × 10⁻⁵ | 1.33 (1.15, 1.53) | |
| NCI_Former smokers | 1.52 × 10⁻⁷ | 1.29 (1.17, 1.41) | 1.33 × 10⁻⁵ | 1.33 (1.17, 1.51) | 0.0004 | 1.32 (1.13, 1.54) | 0.10 | 1.22 (0.96, 1.56) | |
| NCI_Never smokers | 0.72 | 1.03 (0.86, 1.24) | 0.77 | 1.04 (0.82, 1.31) | 0.90 | 1.04 (0.56, 1.94) | 0.11 | 2.21 (0.84, 5.82) | |
| Meta-analysis Unadjusted | 2.18 × 10-46 | 1.29 (1.25, 1.34) | 1.46 × 10⁻¹⁵ | 1.29 (1.21, 1.37) | 3.37 × 10⁻⁹ | 1.25 (1.16, 1.34) | 4.49 × 10⁻⁷ | 1.31 (1.18, 1.45) | |
Bold font indicates genome-wide significant results
Overall NCI Data: 5848 controls (2384 current, 2041 former,1402 never smokers), 5739 cases (3410 current, 1946 former, 362 never smokers). Meta-analysis: 19666 controls, 13300 cases
Adenocarcinoma NCI Data: 5848 controls (2384 current, 2041 former,1402 never smokers), 1730 cases (786 current, 731 former, 203 never smokers). Meta-analysis: 14933 controls, 3333 cases
Squamous Cell Carcinoma NCI Data: 5848 controls (2384 current, 2041 former,1402 never smokers), 1400 cases (953 current, 422 former, 23 never smokers). Meta-analysis: 14933 controls, 2589 cases
Small Cell Carcinoma NCI Data: 5848 controls (2384 current, 2041 former,1402 never smokers), 678 cases (516 current, 152 former, 9 never smokers). Meta-analysis: 13796 controls, 1418 cases
Most notable SNPs from the NCI GWAS and SNPs identified as relevant for lung cancer risk in previous studies are shown. The lung cancer cases in the Overall analyses include adenocarcinomas, squamous cell carcinomas, small cell carcinomas, and other groups of different histologic types or mixed histologies. The Overall meta-analyses include four NCI GWAS studies plus ten additional studies; the meta-analyses in the three major histologic types include four NCI GWAS studies plus four replication studies for the SNPs on chromosome 5p15 and three replication studies for the SNPs on chromosome 15q25. Results for each SNP are shown in this order: Top row (NCI_Smoking Unadjusted), results from the NCI GWAS data adjusted for age in five-year intervals (defined as age-at-diagnosis/interview for case-control study and age at baseline for cohort study), gender, study (EAGLE, PLCO, ATBC, CPS-II) and four principal components for population stratification within studies (two for PLCO, and one each for EAGLE and ATBC). Adjustment for the same variables plus smoking status (current, former, never), cigarettes smoked per day (≤10, 11–20, 21–30, 31–40, 41+), duration in ten-year intervals and number of years since quitting (1–5, 6–10, 11–20, 21–30, 30+) for former smokers showed virtually identical results (data not shown). Second row (NCI_Current smokers), results from the NCI GWAS data restricted to current smoker subjects, adjusted for the same variables of the top row. Third row (NCI_Former smokers), results from the NCI GWAS data restricted to former smoker subjects who quit smoking > 6 months prior to the study, adjusted for the same variables of the top row. Fourth row (NCI_Never smokers), results from the NCI GWAS data restricted to never smoker subjects who smoked < 100 cigarettes in their lifetime, adjusted for the same variables of the top row. Bottom row (Meta-analysis Unadjusted), results from the meta-analysis combining NCI GWAS data and ten additional studies, unadjusted models.
NCBI dbSNP identifier.
Major allele, minor allele.
Chromosome and NCBI Human genome Build 36 location.
Gene neighborhood within 20 kb upstream and 10 kb downstream of SNP.
Minor allele frequency in controls/cases.
1d.f. Wald test.
OR, per-allele odds ratio; CI, 95% confidence interval.
Figure 2.
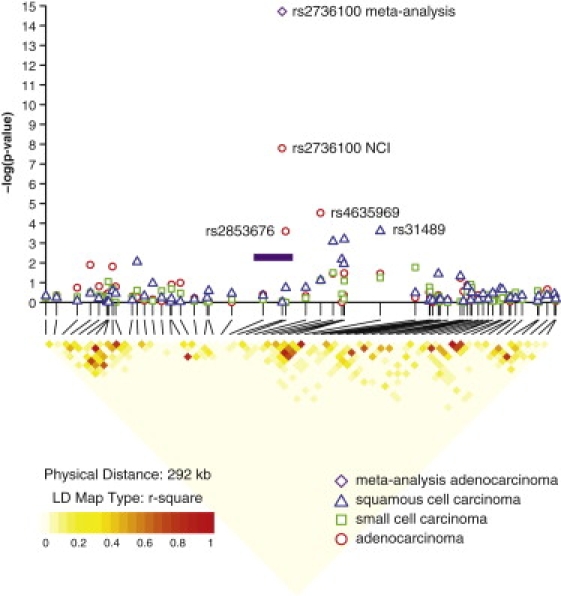
Results of Association Analyses and LD Block for the 5p15.33 Locus by Histology
Association results are shown in the top panel for the NCI GWAS. Results of the meta-analysis combining the NCI GWAS and the additional four studies for rs2736100 in the adenocarcinoma histologic type are indicated by the purple diamond. Red circles indicate adenocarcinoma, blue triangles indicate squamous cell carcinoma, and green circles indicate small cell carcinoma. At the bottom, pairwise LD is depicted for 65 SNPs with minor allele frequency >5% in the 5p15.33 region extending from 1204161 to 1496199. The LD among pairs of SNPs was characterized on the basis of the square of the correlation coefficient (r2) with the use of EAGLE and PLCO controls of a European background (1997 from EAGLE and 859 from PLCO, totaling 2856 unrelated individuals). Regions with high r2 values are red, and regions with low r2 values are light yellow. The shade lightens with decreasing r2. The purple bar indicates the approximate location of the TERT gene.
In the NCI controls, rs2736100 is not in LD with other tested SNPs in the region (Figure 2), with the exception of rs2853676, which is in modest LD (r2 = 0.25, D′ = 0.82) and showed a similar pattern of association (OR = 1.16, p = 3.44 × 10⁻⁴; OR = 0.95, p = 0.30; and OR = 1.06, p = 0.41 for AD, SQ, and SC, respectively). In contrast, rs4635969 and rs31489 were associated with lung cancer risk across histology groups (Table 2). The previously reported SNPs in CLPTM1L, e.g., rs4975616, rs402710, and rs401681, which are in LD with rs31489 (r2 = 0.74, 0.63, and 0.85, respectively), showed associations similar to rs31489 (data not shown). rs31489 and rs4635969 are moderately correlated (r2 = 0.35, D′ = 0.95), but not in LD with rs2736100 (r2 = 0.03, D′ = 0.20 for rs31489; r2 = 0.07, D′ = 0.49 for rs4635969). In a multivariate model including the main effects of these three SNPs simultaneously, we found statistically independent associations with AD for both rs4635969 and rs2736100 (OR = 0.81, p = 0.002; OR = 1.21, p = 2.60 × 10⁻⁵) but not for rs31489 (OR = 1.03, p = 0.42). Only rs31489 was associated with SQ (OR = 0.82, p = 8.50 × 10⁻⁴) and no SNPs were associated with SC (data not shown) in the multivariate model.
In the meta-analysis, rs2736100 was the most notable SNP for lung cancer risk overall (OR = 1.12, 95% CI = 1.08–1.16, p = 1.60 × 10⁻¹⁰), followed by the same set of SNPs observed in the NCI GWAS (Table 2, larger list in Table S5). In analyses by histology, risk associated with rs2736100 was accounted for by cases with adenocarcinoma in each replication study (p < 0.05 in each study; p = 0.59, test for heterogeneity across studies) (Figure 3). Other histologies exhibited no association. In the meta-analysis combining the NCI GWAS data with the data from the Texas, deCODE, HGF, and UK studies, this SNP had OR = 1.24, 95% CI = 1.17–1.31, p = 3.74 × 10⁻¹⁴ for AD versus OR = 0.99, p = 0.69 and OR = 0.97, p = 0.48, for SQ and SC, respectively (Table 2).
Figure 3.
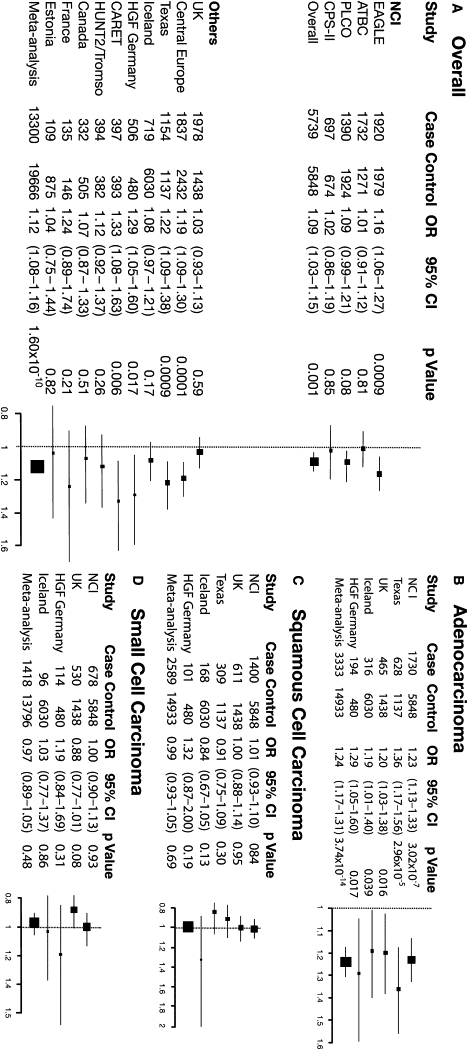
Forest Plot Showing Associations between the rs2736100 SNP and Lung Cancer Risk Both Overall and by Histologic Types
Left panel: (A) Association between rs2736100 and lung cancer risk in each study included in the NCI GWAS and in each additional study contributing to the meta-analysis. Right panel: (B) Association between rs2736100 and risk of adenocarcinoma, (C) squamous cell carcinoma, and (D) small cell carcinoma in the NCI GWAS and in each additional study contributing to the meta-analysis, stratified by histology. Individual studies (boxes) are plotted against the individual effect sizes (ORs). The size of the boxes is inversely proportioned to the variance. Horizontal lines indicate 95% CIs. The dashed vertical line in each panel shows the value for no effect (OR =1.0).
These findings provide evidence that the previously identified association of the rs2736100 variant on 5p15.33 with lung cancer risk4,5 is confined to one histologic type, adenocarcinoma. Rs2736100 is located in intron 2 of TERT and, on the basis of the ESPERR score, lies within a putative regulatory region.28 TERT is a ribonucleoprotein that extends TTAGGG nucleotide repeats at the telomere, which shorten with each cell division. Telomere shortening is associated with increased genomic instability and, consequently, increased risk of cancer development.29 In cancer cells, reactivated TERT is linked to cellular proliferation and abnormal telomere maintenance.30
Other studies have suggested that perturbations of TERT may contribute to the pathogenesis of lung adenocarcinoma. TERT expression has been reported to be significantly lower in adenocarcinoma than in any other histological type,31 and its reexpression may indicate progression from bronchiolo-alveolar carcinoma to adenocarcinoma.32,33 TERT has been reported to promote epithelial proliferation,34 whereas telomere maintenance has been implicated in the progression from KRAS-activated adenoma to adenocarcinoma in murine models.35 rs2736100 was recently found in association with lung cancer risk in two populations, with suggestive stronger associations in adenocarcinoma cases, female cases, and case individuals who had never smoked.36,37 Interestingly, rs2736100 has been reported to be associated with susceptibility to sporadic idiopathic pulmonary fibrosis (IPF),38,39 whereas rare mutations in TERT and consequent shorter telomeres are responsible for familial IPF.40 IPF is a lethal disease characterized by massive fibrotic changes and thickening of the alveolar walls in the lung. Members of IPF families frequently develop lung adenocarcinoma, suggesting that these two diseases share a common etiology.41 Furthermore, telomerase dysfunction has been linked to leukemia, bone marrow failure, and cancer predisposition,42–44 and other SNPs in the TERT-CLPTM1L region have been found in association with multiple cancer types,6 suggesting that this region possesses a fundamental key for cancer development. rs2736100 and other SNPs in the locus are close to the location of known mutations that compromise telomerase activity (Figure 4) and may be in LD with mutations that have yet to be identified. Complete sequencing of this locus in adenocarcinoma patients would enable a more comprehensive understanding of the variants associated with this signal.
Figure 4.
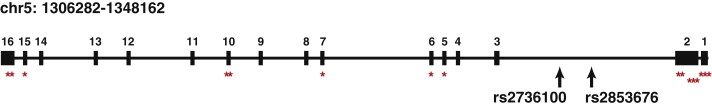
Location of SNPs and Mutations in the TERT Gene
Exon and intron organization of the TERT gene, including the locations of rs2736100, rs2853676, and the known mutations (red asterisks) that compromise telomerase activity.39–44
The NCI GWAS also refined other previously identified susceptibility loci.1–3,5 The strongest evidence for association with lung cancer risk overall and with each histology group was observed for the 15q25.1 locus.1–3 (nicotinic acetylcholine receptor genes), beginning with rs12914385 in CHRNA3 (MIM 118503) (OR = 1.34, 95% CI = 1.27–1.42, p = 5.24 × 10⁻²⁷) (Table 2; top SNPs with p < 0.0001 in each histologic group are shown in Tables S6–S8). In the meta-analysis including the NCI GWAS and summary results from ten studies, the SNP with the lowest p value was rs1051730 in CHRNA5 (MIM 118505) (OR = 1.31, 95% CI = 1.27–1.36, p = 1.91 × 10−51), whereas rs12914385 had an OR = 1.30, 95% CI = 1.25–1.36, p = 2.75 × 10−38 (Table 2; a longer SNP list in given in Table S5). The same SNPs were also strongly associated with all major histology groups (Table 2).
There were 20 SNPs at this locus with p < 10−7 and 15 after adjustment for multiple smoking variables, suggesting that the association of these SNPs with lung cancer risk is not entirely explained by the association with smoking or that residual confounding by smoking cannot be completely ruled out. In the analysis of the NCI GWAS stratified by smoking status (Table 2), SNPs on 15q25 showed a very strong association in current and former smokers but no association in those who had never smoked, as previously observed in some,2,45 but not all,1 studies. The interaction between these SNPs and smoking status was borderline significant (p = 0.07, p = 0.07, and p = 0.04 for rs12914385, rs1051730, and rs8034191, respectively).
We conducted an analysis stratified by decade of birth (<1930, 1930–1939, 1940–1949, and >1950) to explore whether the complex changes in cigarette composition and population trends in cigarette smoking affected the association between this locus and lung cancer risk. Most subjects in our study were born in the 1930s–1940s and began smoking approximately 15–20 years after birth. Thus, smokers were affected by the progressive adoption of cigarette filters and alterations in tar, nicotine, and nitrosamine content in cigarettes that began in the 1950s.46 For the top SNPs on 15q25, we observed a trend of increasing lung cancer risk with more recent decades of birth both overall and in each histology group, with the exception of the SQ cases (Table 3). Because widespread cigarette smoking generally began a few years later in Europe than in the U.S., we stratified the analyses between American (PLCO and CPS-II) and European (EAGLE and ATBC) studies. As expected, the American studies showed a slightly stronger association (data not shown).
Table 3.
Association of Selected SNPs on 15q25 Loci with Lung Cancer Risk by Decade of Birth in the NCI GWAS
| Study |
< 1930 (No. of Controls = 1749) |
1930–1939 (No. of Controls = 2113) |
1940–1949 (No. of Controls = 696) |
1950+ (No. of Controls = 190) |
|||||||||
|---|---|---|---|---|---|---|---|---|---|---|---|---|---|
| No. of Cases | p Valuea | ORb(95% CI) | No. of Cases | p Valuea | ORb(95% CI) | No. of Cases | p Valuea | ORb(95% CI) | No. of Cases | p Valuea | ORb(95% CI) | PintcSmokAdj | |
| rs12914385 | |||||||||||||
| Overall Smok.Unadj | 2202 | 6.94 × 10⁻⁸ | 1.29 (1.18–1.41) | 2173 | 6.94 × 10⁻¹² | 1.35 (1.24–1.47) | 594 | 2.49 × 10⁻⁵ | 1.42 (1.20–1.66) | 155 | 2.60 × 10⁻⁵ | 1.94 (1.42–2.64) | 0.02 |
| Overall Smok.Adjust | 2202 | 1.95 × 10⁻⁵ | 1.25 (1.13–1.38) | 2173 | 5.11 × 10⁻⁷ | 1.28 (1.16–1.41) | 594 | 2.08 × 10⁻⁴ | 1.44 (1.19–1.74) | 155 | 3.91 × 10⁻⁴ | 1.98 (1.36–2.88) | 0.04 |
| Adenocarc. Smok.Adjust | 541 | 0.012 | 1.21 (1.04–1.42) | 683 | 8.33 × 10⁻⁵ | 1.31 (1.15–1.50) | 270 | 0.004 | 1.42 (1.12–1.80) | 84 | 0.001 | 2.10 (1.33–3.32) | 0.03 |
| Squamous Smok.Adjust | 596 | 6.75 × 10⁻⁵ | 1.36 (1.17–1.58) | 582 | 0.002 | 1.27 (1.09–1.47) | 120 | 0.096 | 1.35 (0.95–1.92) | 17 | 0.16 | 1.75 (0.80–3.85) | 0.92 |
| Small Cell Smok.Adjust | 268 | 0.042 | 1.23 (1.01–1.50) | 265 | 0.002 | 1.37 (1.12–1.67) | 70 | 0.001 | 2.02 (1.31–3.09) | 15 | 0.043 | 2.59 (1.03–6.51) | 0.10 |
| rs1051730 | |||||||||||||
| Overall Smok.Unadj | 2202 | 9.26 × 10⁻⁷ | 1.27 (1.15–1.39) | 2173 | 2.32 × 10⁻¹¹ | 1.35 (1.23–1.47) | 594 | 2.41 × 10⁻⁵ | 1.42 (1.21–1.68) | 155 | 6.75 × 10⁻⁶ | 2.08 (1.51–2.86) | 0.009 |
| Overall Smok.Adjust | 2202 | 1.31 × 10⁻⁴ | 1.22 (1.10–1.36) | 2173 | 6.57 × 10⁻⁷ | 1.28 (1.16–1.41) | 594 | 6.89 × 10⁻⁴ | 1.40 (1.15–1.70) | 155 | 8.86 × 10⁻⁵ | 2.18 (1.48–3.23) | 0.02 |
| Adenocarc. Smok.Adjust | 541 | 0.011 | 1.22 (1.04–1.42) | 683 | 7.30 × 10⁻⁵ | 1.32 (1.15–1.51) | 270 | 0.008 | 1.38 (1.09–1.75) | 84 | 0.002 | 2.08 (1.30–3.31) | 0.05 |
| Squamous Smok.Adjust | 596 | 9.27 × 10⁻⁴ | 1.29 (1.11–1.51) | 582 | 0.002 | 1.26 (1.09–1.47) | 120 | 0.32 | 1.20 (0.84–1.72) | 17 | 0.053 | 2.23 (0.99–5.05) | 0.79 |
| Small Cell Smok.Adjust | 268 | 0.11 | 1.18 (0.96–1.44) | 265 | 0.002 | 1.38 (1.13–1.70) | 70 | 7.02 × 10⁻⁴ | 2.12 (1.37–3.28) | 15 | 0.018 | 3.23 (1.22–8.53) | 0.02 |
| rs8034191 | |||||||||||||
| Overall Smok.Unadj | 2202 | 1.13 × 10⁻⁵ | 1.23 (1.12–1.35) | 2173 | 2.60 × 10⁻⁸ | 1.23 (1.12–1.35) | 594 | 2.70 × 10⁻⁵ | 1.42 (1.20–1.67) | 155 | 1.10 × 10⁻⁵ | 2.01 (1.47–2.74) | 0.007 |
| Overall Smok.Adjust | 2202 | 0.002 | 1.18 (1.06–1.30) | 2173 | 5.67 × 10⁻⁵ | 1.22 (1.11–1.35) | 594 | 5.73 × 10⁻⁴ | 1.40 (1.16–1.70) | 155 | 1.56 × 10⁻⁴ | 2.09 (1.43–3.06) | 0.01 |
| Adenocarc. Smok.Adjust | 541 | 0.13 | 1.13 (0.96–1.31) | 683 | 0.001 | 1.25 (1.09–1.43) | 270 | 0.002 | 1.45 (1.14–1.84) | 84 | 0.005 | 1.92 (1.22–3.02) | 0.01 |
| Squamous Smok.Adjust | 596 | 0.006 | 1.23 (1.06–1.43) | 582 | 0.007 | 1.23 (1.06–1.43) | 120 | 0.39 | 1.17 (0.82–1.67) | 17 | 0.064 | 2.04 (0.96–4.35) | 0.67 |
| Small Cell Smok.Adjust | 268 | 0.24 | 1.13 (0.92–1.38) | 265 | 0.005 | 1.33 (1.09–1.63) | 70 | 0.004 | 1.89 (1.23–2.91) | 15 | 0.039 | 2.60 (1.05–6.44) | 0.05 |
Most notable SNPs from the NCI GWAS and SNPs identified as relevant for lung cancer risk in previous studies are shown. The lung cancer cases in the Overall analyses include adenocarcinomas, squamous cell carcinomas, small cell carcinomas, and other groups of different histologic types or mixed histologies. Smoking Unadjusted results are adjusted for age in five-year intervals (defined as age-at-diagnosis/interview for case-control study and age at baseline for cohort study), gender, study (EAGLE, PLCO, ATBC, CPS-II), decade of birth (<1930, 1930–1940, 1940+, MISSING) and four principal components for population stratification within studies (two for PLCO, and one each for EAGLE and ATBC). Smoking Adjusted, results are adjusted for the same variables as above plus smoking status (current, former, never), cigarettes smoked per day (≤10, 11–20, 21–30, 31–40, 41+), duration in ten-year intervals and number of years since quitting (1–5, 6–10, 11–20, 21–30, 30+) for former smokers.
1 d.f. Wald test.
OR, per-allele odds ratio; CI, 95% confidence interval.
P-value of interaction between SNPs and decade of birth in the association with lung cancer risk overall and in each histology stratum. 1d.f. Wald test (decade of birth coded as 0,1,2,3).
One possible explanation for the increasing risk in more recent decades of birth is that the association of chromosome 15q25 SNPs with lung cancer risk is mediated in part by the increasing nitrosamine content in cigarettes over the second half of the 20th century.47,48 Carcinogenic nitrosamines are thought to bind to the nicotinic receptor,49 and carriers of the 15q25 locus are exposed to a higher internal dose of nitrosamines per cigarette than are noncarriers.50 No clear trend by decade of birth was observed for squamous cell carcinoma, possibly because this histologic type is more strongly associated with polycyclic aromatic hydrocarbons than with nitrosamines.47,48,51 However, these findings may be affected by small numbers in subgroups and should be further explored.
A recent study from the UK reported that the 6p21.33 locus is associated with lung cancer risk,5 and a suggestive association for another SNP in the region (rs4324798 on 6p22.1) had been previously shown.1 In the meta-analysis, SNPs at this locus were associated with lung cancer risk (Table S4). However, the association varied by study and was weak in the NCI GWAS and in the studies used in replicating the analysis by histology (Table S4). These SNPs are located near the major histocompatibility complex and thus could be markers for differences in population substructure.
In this study including over 30,000 subjects, no new genomic regions associated with lung cancer risk were identified. This contrasts with studies of other cancer types, such as breast, colon, and prostate cancers, which observed multiple common susceptibility loci in similar or smaller sample sizes.52–54 It is plausible that additional genetic variation for smoking-related cancers will be revealed through the investigation of interaction with tobacco smoking or structural variants. Our findings are based on subjects of European descent only; further work is necessary for the exploration of whether additional loci or different variants in the same loci are associated with lung cancer risk in distinct populations.
In conclusion, we have established that a locus on chromosome 5p15.33 is distinctly associated with risk of lung adenocarcinoma and not with the other major histologic types, providing evidence of histology-specific germ-line susceptibility for lung cancer risk. Defining the distinct hereditary contribution to histological subtypes and their interplay with tobacco smoking is a step on the pathway to the molecular characterization of cancer and could lead to improved measures for early detection or prevention.
Acknowledgments
The authors wish to thank: the participants and collaborators of EAGLE (listed on the EAGLE website); the staff of the Core Genotyping Facility—specifically Chenwei Liu, Amy Hutchinson, Aurelie Vogt, and Belynda Hicks; the National Center for Biotechnology for assistance with data cleaning; Justin Paschall and Mike Feolo for data manipulation; Teri Manolio and Bruce Weir for the GENEVA initiative; Adam Risch of Information Management Services, Inc. for database support; all participants in the CPS-II Nutrition Cohort; the LUCY-consortium (detail in Sauter et al. 200817); the KORA study group and H. Dienemann, P. Drings, and the staff at the Thoraxklinik Heidelberg for the German study; the participants of the Nord Trondelag Study and the Tromso Study in Norway; and Steve Narod and Frances Shepherd for the Canadian study. K.S., P.S., G.T., and T.R. are employees and shareholders of deCODE Genetics. A list of funding agencies can be found in the Supplemental Data.
Supplemental Data
Web Resources
The URLs for data presented herein are as follows:
The Alpha-Tocopherol, Beta-Carotene Cancer Prevention Study (ATBC), http://atbcstudy.cancer.gov
Cancer Prevention Study overview, http://www.cancer.org/docroot/RES/content/RES_6_2_Study_Overviews.asp
Cancer Genetic Markers of Susceptibility (CGEMS) portal, http://cgems.cancer.gov/
Core Genotyping Facility (CGF), http://cgf.nci.nih/gov/
CGF sample handling and quality control, http://cgf.nci.nih.gov/operations/sample-handling.html
EIGENSTRAT, http://genepath.med.harvard.edu/∼reich/EIGENSTRAT.htm
The Environment and Genetics in Lung Cancer Etiology (EAGLE), http://eagle.cancer.gov
ESPERR score, http://genome.ucsc.edu
The Estonian Genome Project, www.geenivaramu.eeresources/groups/ed/programs/plco
GENEVA data set, http://www.ncbi.nlm.nih.gov/sites/entrez?Db=gap
Genotype Library and Utilities (GLU), http://code.google.com/p/glu-genetics/
Online Mendelian Inheritance in Man (OMIM), http://www.ncbi.nlm.nih.gov/Omim/
The Prostate, Lung, Colon, Ovary Screening Trial (PLCO), http://prevention.cancer.gov/programs
SNP500Cancer, http://snp500cancer.nci.nih.gov/
Tagzilla, http://tagzilla.nci.nih.gov/
References
- 1.Hung R.J., McKay J.D., Gaborieau V., Boffetta P., Hashibe M., Zaridze D., Mukeria A., Szeszenia-Dabrowska N., Lissowska J., Rudnai P. A susceptibility locus for lung cancer maps to nicotinic acetylcholine receptor subunit genes on 15q25. Nature. 2008;452:633–637. doi: 10.1038/nature06885. [DOI] [PubMed] [Google Scholar]
- 2.Amos C.I., Wu X., Broderick P., Gorlov I.P., Gu J., Eisen T., Dong Q., Zhang Q., Gu X., Vijayakrishnan J. Genome-wide association scan of tag SNPs identifies a susceptibility locus for lung cancer at 15q25.1. Nat. Genet. 2008;40:616–622. doi: 10.1038/ng.109. [DOI] [PMC free article] [PubMed] [Google Scholar]
- 3.Thorgeirsson T.E., Geller F., Sulem P., Rafnar T., Wiste A., Magnusson K.P., Manolescu A., Thorleifsson G., Stefansson H., Ingason A. A variant associated with nicotine dependence, lung cancer and peripheral arterial disease. Nature. 2008;452:638–642. doi: 10.1038/nature06846. [DOI] [PMC free article] [PubMed] [Google Scholar]
- 4.McKay J.D., Hung R.J., Gaborieau V., Boffetta P., Chabrier A., Byrnes G., Zaridze D., Mukeria A., Szeszenia-Dabrowska N., Lissowska J. Lung cancer susceptibility locus at 5p15.33. Nat. Genet. 2008;40:1404–1406. doi: 10.1038/ng.254. [DOI] [PMC free article] [PubMed] [Google Scholar]
- 5.Wang Y., Broderick P., Webb E., Wu X., Vijayakrishnan J., Matakidou A., Qureshi M., Dong Q., Gu X., Chen W.V. Common 5p15.33 and 6p21.33 variants influence lung cancer risk. Nat. Genet. 2008;40:1407–1409. doi: 10.1038/ng.273. [DOI] [PMC free article] [PubMed] [Google Scholar]
- 6.Rafnar T., Sulem P., Stacey S.N., Geller F., Gudmundsson J., Sigurdsson A., Jakobsdottir M., Helgadottir H., Thorlacius S., Aben K.K. Sequence variants at the TERT-CLPTM1L locus associate with many cancer types. Nat. Genet. 2009;41:221–227. doi: 10.1038/ng.296. [DOI] [PMC free article] [PubMed] [Google Scholar]
- 7.Gabrielson E. Worldwide trends in lung cancer pathology. Respirology. 2006;11:533–538. doi: 10.1111/j.1440-1843.2006.00909.x. [DOI] [PubMed] [Google Scholar]
- 8.Gao Y., Goldstein A.M., Consonni D., Pesatori A.C., Wacholder S., Tucker M.A., Caporaso N.E., Goldin L., Landi M.T. Family history of cancer and nonmalignant lung diseases as risk factors for lung cancer. Int. J. Cancer. 2009;125:146–152. doi: 10.1002/ijc.24283. [DOI] [PMC free article] [PubMed] [Google Scholar]
- 9.Li X., Hemminki K. Inherited predisposition to early onset lung cancer according to histological type. Int. J. Cancer. 2004;112:451–457. doi: 10.1002/ijc.20436. [DOI] [PubMed] [Google Scholar]
- 10.Ambrosone C.B., Rao U., Michalek A.M., Cummings K.M., Mettlin C.J. Lung cancer histologic types and family history of cancer. Analysis of histologic subtypes of 872 patients with primary lung cancer. Cancer. 1993;72:1192–1198. doi: 10.1002/1097-0142(19930815)72:4<1192::aid-cncr2820720410>3.0.co;2-s. [DOI] [PubMed] [Google Scholar]
- 11.Sellers T.A., Elston R.C., Atwood L.D., Rothschild H. Lung cancer histologic type and family history of cancer. Cancer. 1992;69:86–91. doi: 10.1002/1097-0142(19920101)69:1<86::aid-cncr2820690116>3.0.co;2-s. [DOI] [PubMed] [Google Scholar]
- 12.Landi M.T., Consonni D., Rotunno M., Bergen A.W., Goldstein A.M., Lubin J.H., Goldin L., Alavanja M., Morgan G., Subar A.F. Environment And Genetics in Lung cancer Etiology (EAGLE) study: an integrative population-based case-control study of lung cancer. BMC Public Health. 2008;8:e203. doi: 10.1186/1471-2458-8-203. [DOI] [PMC free article] [PubMed] [Google Scholar]
- 13.The ATBC Cancer Prevention Study Group The alpha-tocopherol, beta-carotene lung cancer prevention study: design, methods, participant characteristics, and compliance. Ann. Epidemiol. 1994;4:1–10. doi: 10.1016/1047-2797(94)90036-1. [DOI] [PubMed] [Google Scholar]
- 14.Hayes R.B., Sigurdson A., Moore L., Peters U., Huang W.Y., Pinsky P., Reding D., Gelmann E.P., Rothman N., Pfeiffer R.M. Methods for etiologic and early marker investigations in the PLCO trial. Mutat. Res. 2005;592:147–154. doi: 10.1016/j.mrfmmm.2005.06.013. [DOI] [PubMed] [Google Scholar]
- 15.Calle E.E., Rodriguez C., Jacobs E.J., Almon M.L., Chao A., McCullough M.L., Feigelson H.S., Thun M.J. The American Cancer Society Cancer Prevention Study II Nutrition Cohort: rationale, study design, and baseline characteristics. Cancer. 2002;94:2490–2501. doi: 10.1002/cncr.101970. [DOI] [PubMed] [Google Scholar]
- 16.Power C., Elliott J. Cohort profile: 1958 British birth cohort (National Child Development Study) Int. J. Epidemiol. 2006;35:34–41. doi: 10.1093/ije/dyi183. [DOI] [PubMed] [Google Scholar]
- 17.Sauter W., Rosenberger A., Beckmann L., Kropp S., Mittelstrass K., Timofeeva M., Wolke G., Steinwachs A., Scheiner D., Meese E. Matrix metalloproteinase 1 (MMP1) is associated with early-onset lung cancer. Cancer Epidemiol. Biomarkers Prev. 2008;17:1127–1135. doi: 10.1158/1055-9965.EPI-07-2840. [DOI] [PubMed] [Google Scholar]
- 18.Omenn G.S., Goodman G., Thornquist M., Grizzle J., Rosenstock L., Barnhart S., Balmes J., Cherniack M.G., Cullen M.R., Glass A. The beta-carotene and retinol efficacy trial (CARET) for chemoprevention of lung cancer in high risk populations: smokers and asbestos-exposed workers. Cancer Res. 1994;54(7, Suppl):2038s–2043s. [PubMed] [Google Scholar]
- 19.Holmen J.M.K., Kruger O., Langhammer A., Lingaas Holmen T., Bratberg G.H. The Nord-Trøndelag Health Study 1995-97 (HUNT 2): Objectives, contents, methods and participation. Norweg. J. Epidemiol. 2003;13:19–32. [Google Scholar]
- 20.Feyler A., Voho A., Bouchardy C., Kuokkanen K., Dayer P., Hirvonen A., Benhamou S. Point: myeloperoxidase –463G–> a polymorphism and lung cancer risk. Cancer Epidemiol. Biomarkers Prev. 2002;11:1550–1554. [PubMed] [Google Scholar]
- 21.Nelis M., Esko T., Magi R., Zimprich F., Zimprich A., Toncheva D., Karachanak S., Pischakova T., Balascak I., Peltonen L. Genetic structure of Europeans: a view from the North-East. PLoS ONE. 2009;4:e5472. doi: 10.1371/journal.pone.0005472. [DOI] [PMC free article] [PubMed] [Google Scholar]
- 22.Yeager M., Orr N., Hayes R.B., Jacobs K.B., Kraft P., Wacholder S., Minichiello M.J., Fearnhead P., Yu K., Chatterjee N. Genome-wide association study of prostate cancer identifies a second risk locus at 8q24. Nat. Genet. 2007;39:645–649. doi: 10.1038/ng2022. [DOI] [PubMed] [Google Scholar]
- 23.Pritchard J.K., Stephens M., Donnelly P. Inference of population structure using multilocus genotype data. Genetics. 2000;155:945–959. doi: 10.1093/genetics/155.2.945. [DOI] [PMC free article] [PubMed] [Google Scholar]
- 24.Yu K., Wang Z., Li Q., Wacholder S., Hunter D.J., Hoover R.N., Chanock S., Thomas G. Population substructure and control selection in genome-wide association studies. PLoS ONE. 2008;3:e2551. doi: 10.1371/journal.pone.0002551. [DOI] [PMC free article] [PubMed] [Google Scholar]
- 25.The International HapMap Project Nature. 2003;426:789–796. doi: 10.1038/nature02168. [DOI] [PubMed] [Google Scholar]
- 26.Price A.L., Patterson N.J., Plenge R.M., Weinblatt M.E., Shadick N.A., Reich D. Principal components analysis corrects for stratification in genome-wide association studies. Nat. Genet. 2006;38:904–909. doi: 10.1038/ng1847. [DOI] [PubMed] [Google Scholar]
- 27.Higgins J.P., Thompson S.G. Quantifying heterogeneity in a meta-analysis. Stat. Med. 2002;21:1539–1558. doi: 10.1002/sim.1186. [DOI] [PubMed] [Google Scholar]
- 28.Taylor J., Tyekucheva S., King D.C., Hardison R.C., Miller W., Chiaromonte F. ESPERR: learning strong and weak signals in genomic sequence alignments to identify functional elements. Genome Res. 2006;16:1596–1604. doi: 10.1101/gr.4537706. [DOI] [PMC free article] [PubMed] [Google Scholar]
- 29.Feldser D.M., Hackett J.A., Greider C.W. Telomere dysfunction and the initiation of genome instability. Nat. Rev. Cancer. 2003;3:623–627. doi: 10.1038/nrc1142. [DOI] [PubMed] [Google Scholar]
- 30.Fernandez-Garcia I., Ortiz-de-Solorzano C., Montuenga L.M. Telomeres and telomerase in lung cancer. J. Thorac. Oncol. 2008;3:1085–1088. doi: 10.1097/JTO.0b013e3181886713. [DOI] [PubMed] [Google Scholar]
- 31.Lantuejoul S., Soria J.C., Moro-Sibilot D., Morat L., Veyrenc S., Lorimier P., Brichon P.Y., Sabatier L., Brambilla C., Brambilla E. Differential expression of telomerase reverse transcriptase (hTERT) in lung tumours. Br. J. Cancer. 2004;90:1222–1229. doi: 10.1038/sj.bjc.6601643. [DOI] [PMC free article] [PubMed] [Google Scholar]
- 32.Lantuejoul S., Salon C., Soria J.C., Brambilla E. Telomerase expression in lung preneoplasia and neoplasia. Int. J. Cancer. 2007;120:1835–1841. doi: 10.1002/ijc.22473. [DOI] [PubMed] [Google Scholar]
- 33.viel-Ronen S., Coe B.P., Lau S.K., da Cunha S.G., Zhu C.Q., Strumpf D., Jurisica I., Lam W.L., Tsao M.S. Genomic markers for malignant progression in pulmonary adenocarcinoma with bronchioloalveolar features. Proc. Natl. Acad. Sci. 2008;105:10155–10160. doi: 10.1073/pnas.0709618105. [DOI] [PMC free article] [PubMed] [Google Scholar]
- 34.Choi J., Southworth L.K., Sarin K.Y., Venteicher A.S., Ma W., Chang W., Cheung P., Jun S., Artandi M.K., Shah N. TERT promotes epithelial proliferation through transcriptional control of a Myc- and Wnt-related developmental program. PLoS Genet. 2008;4:e10. doi: 10.1371/journal.pgen.0040010. [DOI] [PMC free article] [PubMed] [Google Scholar]
- 35.Sweet-Cordero A., Tseng G.C., You H., Douglass M., Huey B., Albertson D., Jacks T. Comparison of gene expression and DNA copy number changes in a murine model of lung cancer. Genes Chromosomes Cancer. 2006;45:338–348. doi: 10.1002/gcc.20296. [DOI] [PubMed] [Google Scholar]
- 36.Jin G., Xu L., Shu Y., Tian T., Liang J., Xu Y., Wang F., Chen J., Dai J., Hu Z. Common genetic variants on 5p15.33 contribute to risk of lung adenocarcinoma in a Chinese population. Carcinogenesis. 2009;30:987–990. doi: 10.1093/carcin/bgp090. [DOI] [PubMed] [Google Scholar]
- 37.Broderick P., Wang Y., Vijayakrishnan J., Matakidou A., Spitz M.R., Eisen T., Amos C.I., Houlston R.S. Deciphering the impact of common genetic variation on lung cancer risk: a genome-wide association study. Cancer Res. 2009;69:6633–6641. doi: 10.1158/0008-5472.CAN-09-0680. [DOI] [PMC free article] [PubMed] [Google Scholar]
- 38.Mushiroda T., Wattanapokayakit S., Takahashi A., Nukiwa T., Kudoh S., Ogura T., Taniguchi H., Kubo M., Kamatani N., Nakamura Y. A genome-wide association study identifies an association of a common variant in TERT with susceptibility to idiopathic pulmonary fibrosis. J. Med. Genet. 2008;45:654–656. doi: 10.1136/jmg.2008.057356. [DOI] [PubMed] [Google Scholar]
- 39.Tsakiri K.D., Cronkhite J.T., Kuan P.J., Xing C., Raghu G., Weissler J.C., Rosenblatt R.L., Shay J.W., Garcia C.K. Adult-onset pulmonary fibrosis caused by mutations in telomerase. Proc. Natl. Acad. Sci. USA. 2007;104:7552–7557. doi: 10.1073/pnas.0701009104. [DOI] [PMC free article] [PubMed] [Google Scholar]
- 40.Armanios M.Y., Chen J.J., Cogan J.D., Alder J.K., Ingersoll R.G., Markin C., Lawson W.E., Xie M., Vulto I., Phillips J.A., III Telomerase mutations in families with idiopathic pulmonary fibrosis. N. Engl. J. Med. 2007;356:1317–1326. doi: 10.1056/NEJMoa066157. [DOI] [PubMed] [Google Scholar]
- 41.Wang Y., Kuan P.J., Xing C., Cronkhite J.T., Torres F., Rosenblatt R.L., DiMaio J.M., Kinch L.N., Grishin N.V., Garcia C.K. Genetic defects in surfactant protein A2 are associated with pulmonary fibrosis and lung cancer. Am. J. Hum. Genet. 2009;84:52–59. doi: 10.1016/j.ajhg.2008.11.010. [DOI] [PMC free article] [PubMed] [Google Scholar]
- 42.Vulliamy T.J., Marrone A., Knight S.W., Walne A., Mason P.J., Dokal I. Mutations in dyskeratosis congenita: their impact on telomere length and the diversity of clinical presentation. Blood. 2006;107:2680–2685. doi: 10.1182/blood-2005-07-2622. [DOI] [PubMed] [Google Scholar]
- 43.Yamaguchi H., Calado R.T., Ly H., Kajigaya S., Baerlocher G.M., Chanock S.J., Lansdorp P.M., Young N.S. Mutations in TERT, the gene for telomerase reverse transcriptase, in aplastic anemia. N. Engl. J. Med. 2005;352:1413–1424. doi: 10.1056/NEJMoa042980. [DOI] [PubMed] [Google Scholar]
- 44.Calado R.T., Regal J.A., Hills M., Yewdell W.T., Dalmazzo L.F., Zago M.A., Lansdorp P.M., Hogge D., Chanock S.J., Estey E.H. Constitutional hypomorphic telomerase mutations in patients with acute myeloid leukemia. Proc. Natl. Acad. Sci. USA. 2009;106:1187–1192. doi: 10.1073/pnas.0807057106. [DOI] [PMC free article] [PubMed] [Google Scholar]
- 45.Spitz M.R., Amos C., Dong Q., Lin J., Wu X. The CHRNA5-A3 region on chromosome 15q24-25.1 is a risk factor both for nicotine dependence and for lung cancer. J. Natl. Cancer Inst. 2008;100:1552–1556. doi: 10.1093/jnci/djn363. [DOI] [PMC free article] [PubMed] [Google Scholar]
- 46.Hoffmann D., Djordjevic M.V., Hoffmann I. The changing cigarette. Prev. Med. 1997;26:427–434. doi: 10.1006/pmed.1997.0183. [DOI] [PubMed] [Google Scholar]
- 47.Hecht S.S. Tobacco smoke carcinogens and lung cancer. J. Natl. Cancer Inst. 1999;91:1194–1210. doi: 10.1093/jnci/91.14.1194. [DOI] [PubMed] [Google Scholar]
- 48.Thun M.J., Lally C.A., Flannery J.T., Calle E.E., Flanders W.D., Heath C.W., Jr. Cigarette smoking and changes in the histopathology of lung cancer. J. Natl. Cancer Inst. 1997;89:1580–1586. doi: 10.1093/jnci/89.21.1580. [DOI] [PubMed] [Google Scholar]
- 49.Schuller H.M., Orloff M. Tobacco-specific carcinogenic nitrosamines. Ligands for nicotinic acetylcholine receptors in human lung cancer cells. Biochem. Pharmacol. 1998;55:1377–1384. doi: 10.1016/s0006-2952(97)00651-5. [DOI] [PubMed] [Google Scholar]
- 50.Le Marchand L., Derby K.S., Murphy S.E., Hecht S.S., Hatsukami D., Carmella S.G., Tiirikainen M., Wang H. Smokers with the CHRNA lung cancer-associated variants are exposed to higher levels of nicotine equivalents and a carcinogenic tobacco-specific nitrosamine. Cancer Res. 2008;68:9137–9140. doi: 10.1158/0008-5472.CAN-08-2271. [DOI] [PMC free article] [PubMed] [Google Scholar]
- 51.Le Marchand L., Sivaraman L., Pierce L., Seifried A., Lum A., Wilkens L.R., Lau A.F. Associations of CYP1A1, GSTM1, and CYP2E1 polymorphisms with lung cancer suggest cell type specificities to tobacco carcinogens. Cancer Res. 1998;58:4858–4863. [PubMed] [Google Scholar]
- 52.Thomas G., Jacobs K.B., Kraft P., Yeager M., Wacholder S., Cox D.G., Hankinson S.E., Hutchinson A., Wang Z., Yu K. A multistage genome-wide association study in breast cancer identifies two new risk alleles at 1p11.2 and 14q24.1 (RAD51L1) Nat. Genet. 2009;41:579–584. doi: 10.1038/ng.353. [DOI] [PMC free article] [PubMed] [Google Scholar]
- 53.Houlston R.S., Webb E., Broderick P., Pittman A.M., Di Bernardo M.C., Lubbe S., Chandler I., Vijayakrishnan J., Sullivan K., Peneg S. Meta-analysis of genome-wide association data identifies four new susceptibility loci for colorectal cancer. Nat. Genet. 2008;40:1426–1435. doi: 10.1038/ng.262. [DOI] [PMC free article] [PubMed] [Google Scholar]
- 54.Eeles R.A., Kote-Jarai Z., Giles G.G., Olama A.A., Guy M., Jugurnauth S.K., Mulholland S., Leongamornlert D.A., Edwards S.M., Morrison J. Multiple newly identified loci associated with prostate cancer susceptibility. Nat. Genet. 2008;40:316–321. doi: 10.1038/ng.90. [DOI] [PubMed] [Google Scholar]
Associated Data
This section collects any data citations, data availability statements, or supplementary materials included in this article.