

Abstract
Ultrafast polarization and wavelength selective IR pump-probe spectroscopy is used to measure the inertial and long time orientational dynamics of π-hydrogen bonding complexes. Inertial orientational relaxation is sensitive to the angular potential associated with the hydrogen bond. The complexes studied are composed of phenol-OD (hydroxyl hydrogen replaced by deuterium) and various π-base solvents with different electron donating or withdrawing substituents (chlorobenzene, bromobenzene, benzene, toluene, p-xylene, mesitylene, 1-pentyne). The different substituents provide experimental control of the hydrogen bond strength. The inertial orientational relaxation of the complexes, measured at the center frequency of each line, is independent of the hydrogen bond strength, demonstrating the insensitivity of the OD inertial dynamics, and therefore the H-bond angular potential, to the hydrogen bond strength. OD stretch absorption bands are inhomogeneously broadened through interactions with the solvent. The hydrogen bonding complexes all have similar wavelength dependent inertial orientational relaxation across their inhomogeneously broadened OD stretch absorption lines. The wavelength dependence of the inertial reorientation across each line arises because of a correlation between local solvent structure and the angular potential. These two results imply that local solvent structure acts as the controlling influence in determining the extent of inertial orientational relaxation, and therefore the angular potential, and that variation in the π-hydrogen bond strength is of secondary importance.
I. Introduction
OH-π hydrogen bonds and the π-π interactions are two important intermolecular couplings that play a prominent role in supramolecular structure and molecular recognition.1-6 These weak interactions, when numerous and acting in concert, stabilize proteins and also promote the formation of supramolecular constructs. Examples of XH-π (X = O, N, C) and π-π interactions in proteins are numerous, and we refer the reader to the excellent reviews by Steiner and Koellner, and Chakrabarti and Bhatacharyya.4,7 Hydrogen bonding and π-π interactions can also occur simultaneously in important systems such as DNA and RNA.8 Because of the reliance on crystalline or gas-phase experimental techniques, fundamental questions exist about these interactions in the liquid phase where a vast number of chemical processes occur. How do competing π-π interactions affect XH-π hydrogen bonding?8 In liquid media, intermolecular structures are constantly evolving on a very short timescales. In such dynamic systems, what is the nature of the interactions and what geometries are typically sampled? Does the strength of the π-hydrogen bond dominate the angular potential or does the medium surrounding the π-hydrogen bonded complex play an important role?
We address these questions by looking at the inertial orientational motions of phenol-OD (phenyl hydroxyl hydrogen replaced by deuterium) in phenol/π-base complexes in solution using ultrafast wavelength and polarization selective IR pump-probe experiments performed on the OD stretching mode. The structures of small molecule dimers and oligomers with π-system based interactions have been investigated previously by various experimental and theoretical techniques. However, these techniques typically focus on isolated gas phase dimers. 2,3,8-16 Theoretical techniques have relied on both classical electrostatic models and ab initio based methods.2,3,8,9,11,12 While the electrostatic models qualitatively explain most behavior, the ab initio methods suggest the inherent complexity of aromatic interactions and the difficulty encountered when predicting the structures of complexes involving substituted aromatic molecules.10 The experimental studies of aromatic interactions have focused on spectroscopic investigations of gas phase clusters.12-15 Baiocchi et al. measured the rotational spectrum of HF–aromatic complexes, which demonstrated the ability of HF to bind to benzene-like molecules at a variety of angles.13 The angular potential of the water–benzene complex has also been suggested to be shallow and “soft” relative to other hydrogen bonding interactions.14,16
Deuterated phenol dissolved in various aromatic compounds forms complexes that are useful model systems for investigating the effects of hydrogen bond strength on the details of intermolecular interactions through the observation of the inertial component of reorientation. Aromatic compounds, as well as alkenes and alkynes, can act as π-bases where electron density from the π-electron system is donated to nearby acidic protons. These structures form T-shaped complexes with the OH bond vector pointing either toward the center of the ring, a specific carbon or between two carbons.16-18 When the hydrogen bond is formed, the OD stretch is red-shifted from its non-hydrogen bonded value of 2664 cm-1 in CCl4. The isotopically substituted phenol is used to shift the frequency into an empty part of the spectrum to avoid interference with the vibrational transitions of the solvent. The bulky nature of the phenyl ring of phenol makes oligomerization energetically unfavorable, and much of the phenol is bound as a one-to-one complex with the π-base.
By varying the substituents on the π-base, the strength of the hydrogen bond can be tuned over a several kcal/mol range (~0.5 – ~3 kcal/mol), which corresponds to a 60 cm-1 span of frequency shifts in the OD stretch relative to solvation in CCl4.19,20 These phenol–π-base systems are therefore useful tools for understanding how the strength of the hydrogen bond affects the hydrogen bond angular potential by observing inertial reorientation. An alkyne solvent, 1-pentyne, was also studied. 1-pentyne was chosen due to its capacity for stronger hydrogen bonds than the aromatic solvents used and as a control to understand the role of the structure and viscosity of the solvent on the dynamics observed.
The inertial reorientation of dilute HOD in water at a variety of temperatures was investigated previously using the same method that is employed here.21 The results of that study indicate strong correlation between inertial reorientation and the OD donor hydrogen bond strength (reported by the OD stretch frequency) at high temperature (65°C), a decreasing correlation as the temperature is lowered, and little correlation below ~10 °C. The results were interpreted by Moilanen et al. as an increase in the importance of the highly structured hydrogen bonding network that exists at low temperature in determining the inertial reorientation of the HOD molecule under observation. At low temperatures, the structured network of hydrogen bonds to the HOD and among the water molecules surrounding the HOD determines the angular potential reported on by observation of the OD inertial orientational decay. These multiple hydrogen bond interactions dilute the importance of the strength, determined from the stretch frequency, of the OD hydrogen bond. At high temperature, the hydrogen bond network is less structured, and the strength of the OD hydrogen bond plays an important role in determining the angular potential. In the water system, only hydrogen bonding interactions come into play, and the number and nature of the hydrogen bonding interactions change with temperature. The work by Moilanen et al. demonstrates that the inertial reorientation of hydrogen bonded structures are experimentally accessible via the anisotropy decay measured by ultrafast infrared spectroscopy and that the results can be related to the influence of hydrogen bond strengths on the angular intermolecular potential.
Here we study π-hydrogen bonding complexes in which there is a single hydrogen bond involving the hydroxyl under observation. This hydrogen bond is in competition with non-hydrogen bonding solvent intermolecular interactions for determination of the angular potential. Recently, the dissociation and spectral diffusion dynamics of OD-π complexes were studied with ultrafast two-dimensional infrared (2D IR) vibrational echo chemical exchange spectroscopy.19,20,22-24 The primary goal of the work was to measure the dissociation rate constants for a variety of phenol/aromatic molecule complexes and to develop a methodology capable of studying very fast chemical exchange reactions in the liquid phase. The effects of hydrogen bond strength on the inertial motions and angular potential of the complexes were not studied. Here new experimental data on such complexes is presented that increases our basic understanding of XH-π and π-π interactions.
Spectral diffusion of π-hydrogen bonding complexes has been investigated using 2D IR vibrational echo experiments. The results demonstrate that the solvent inhomogeneously broadens the OD stretch spectrum in OD-π complexes.23,25 MD simulations have correlated an increase in local solvation by benzene with a red shift in OD stretch frequency.17 The examination of inertial motions will allow us to correlate the local density variations with frequency. Furthermore, the MD simulations rely on the assumption that the deviation in the OD stretch frequency from the gas phase value is proportional to the electric field along the OD bond. This assumption is phenomenological, and for a highly associative system involving aromatic interactions, it is not clearly valid. The results presented here will help verify the use of an empirical Stark effect in computations by experimentally identifying the nature of the inhomogeneous broadening and discussing it in terms of simplified electrostatic models of π-π interactions, specifically the Hunter-Sanders model.2,3
Below, the inertial orientational relaxation of a series of phenol π-hydrogen bonding complexes will be shown to be independent of gross changes in the hydrogen bonding strength that occur in going from one complex to another. The extent of the inertial orientational relaxation is indicative of the angular potential. For each complex, the magnitude of the inertial decay is identical in spite of the changes in the hydrogen bond strength. However, for each complex it is found that the magnitude of the inertial decay varies across the inhomogeneous absorption line of the OD stretch. Thus, the angular potential is sensitive to the local π-π solvation structure. The results demonstrate that the π-π solvent-complex interactions are more important in determining the angular potential of the complexed phenol than the strength of the hydrogen bond that gives rise to the complex.
II. Experimental Procedures
Ultrafast polarization and wavelength selective IR pump-probe spectroscopy measures the time dependence of pump-induced bleaching, excited state absorption, and stimulated emission. The experimental design has been described before, and only a brief overview is given here.21,26-28 Ultrafast mid-infrared laser pulses are generated by non-linear frequency mixing of the output of a 1 kHz regenerative amplified Ti:Sapphire laser system. 600 μJ of ~40 fs transform limited pulses of 800 nm light are used to generate 1.3 and 2.0 μm signal and idler beams in an optical parametric amplifier (OPA). The signal and idler from the OPA are used to perform difference frequency generation in a 0.5 mm AgGaS2 which results in horizontally polarized ~3 μJ 60 fs mid-IR pulses centered at 2650 cm-1 with 250 cm-1 of bandwidth. This pulse stream is then split into two beams using a 90:10 beam splitter to generate a pump and a probe pulse. The pump pulse is mechanically chopped at 500 Hz to perform differential absorption measurements, and the pump timing relative to the probe is controlled by a delay line.
The polarization selective measurement is made by polarizing the pump beam using a half-wave plate and a polarizer set to 45° placed directly before the sample. The probe beam is then resolved into parallel or perpendicular components by a computer controlled resolving polarizer placed directly after the sample. Alternating time delay scans are made using parallel and perpendicular polarization to compensate for laser drift. A third polarizer is used to set the two polarizations to horizontal before they pass through a spectrograph. This polarizer is also used to match the intensity of the two polarizations on the detector to enable absolute determinations of S|| and S┴, the signal with the probe polarization parallel and perpendicular to the pump, respectively, in spite of the small nonlinearity of the IR detector. The frequency dependent signal is detected using one stripe of a duel 32 pixel mercury cadmium telluride (MCT) array detector placed at the output of a mid-IR spectrograph. The second stripe is used for probe beam normalization to account for frequency dependent laser shot-to-shot jitter.
All chemicals, except deuterated phenol were purchased from Sigma-Aldrich and used without further purification. The deuterated phenol was prepared using sublimed non-deuterated phenol from Sigma-Aldrich by first dissolving and equilibrating a small amount of the phenol in 99% D2O. The deuterated phenol was extracted and purified using dry diethyl ether and separated by rotary evaporation and sublimation. The sample purity was verified by FTIR. A small amount of undeuterated phenol remains in the sample even after multiple deuterations. All samples studied consisted of 10 mg of deuterated phenol dissolved in 250 mg total weight of solution, which produced optical densities at the peak of the OD stretching band of between 0.6 and 0.8 in a 250 μm path length transmission CaF2 cell. The measurements did not depend on the specific concentration used or the laser intensity. All samples were measured under the same laser conditions. The error bars in the tables presented below are conservative estimates of reproducibility across laser and sample conditions, and the optical characteristics of the ultrafast measurement system.
III. Results and Discussion
A. Linear Infrared Spectroscopy
Hydrogen bonding complexes with π-bases have been extensively studied by linear IR spectroscopy.19,29-33 The ability of the π-system to accept a hydrogen bond is determined by the nucleophilicity of the π-system which can be varied experimentally by changing the substituent groups on the molecule. The increase in the strength of the hydrogen bond also causes a corresponding decrease in the frequency of the OD stretch of the donor molecule. The enthalpy of formation of the hydrogen bond is linearly proportional to the frequency shift.19 The shift with increasing hydrogen bond strength is displayed in Figure 1, which shows normalized IR absorption spectra for deuterated phenol dissolved in various solvents that act as π-bases. The solvents used aside from carbon tetrachloride, which does not form a hydrogen bonding complex with phenol, in increasing order of hydrogen bonding strength were: chlorobenzene, bromobenzene, benzene, toluene, p-xylene, mesitylene, and 1-pentyne. Broad low frequency and amplitude bands that arise from a small amount of oligomerization did not interfere with the complexes’ OD stretch bands. The low frequency oligomer bands have been removed from the spectra to clearly show the red-shifts as the nucleophilicity of the π-system is increased.
Figure 1.
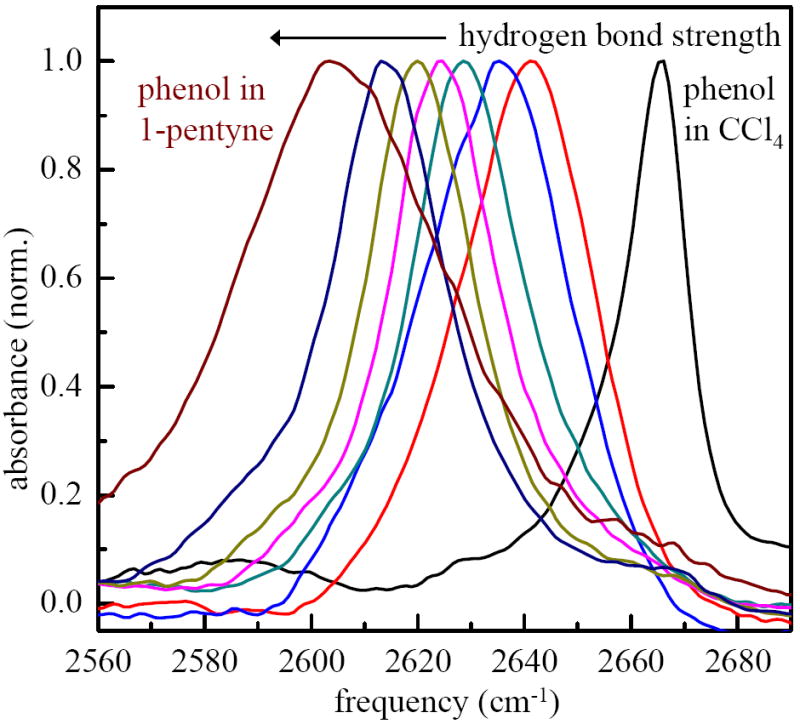
Infrared spectra of the OD stretch of phenol-OD (hydroxyl deuterated) in solvents that form π-hydrogen bonded complexes and in carbon tetrachloride (no complex formation). From right to the left the solvents are: CCl4, chlorobenzene, bromobenzene, benzene, toluene, p-xylene, mesitylene, 1-pentyne. The frequency shift from phenol in CCl4 is linearly proportional to the enthalpy of formation of the hydrogen bonded complexes.
B. Polarization Selective Infrared Pump-Probe Spectroscopy
Polarization selective IR pump-probe spectroscopy produces two different signals depending on the orientation of the resolving polarizer,
| (1) |
| (2) |
where S|| is the signal when the resolving polarizer is parallel to the pump polarization and S┴ is the signal when the resolving polarizer is perpendicular.34 P(t) is the vibrational excited state population relaxation, which decays with the vibrational lifetime. C2(t) is the normalized time correlation function of the second-order Legendre polynomial for a dipole transition (orientational correlation function).34 The population decay can be extracted from the data via the linear combination,
| (3) |
The orientational correlation function can also be extracted from the experimental polarization selective pump-probe data. The analysis is usually conducted by calculating the anisotropy, r(t).
| (4) |
The anisotropy has a value of 0.4 when t = 0 and decays to 0 for an ensemble of molecules that undergoes complete orientational randomization at long time.
The vibrational lifetimes, T1, were extracted from the P(t) curves through non-linear fitting of a single or bi-exponential function. The vibrational lifetimes of the OD stretch of the complexes are reported in Table 1. The vibrational lifetime is longest in unassociated phenol (phenol in CCl4). Upon hydrogen bonding complex formation, the lifetimes decrease presumably due to the availability of additional acceptor modes. The lifetimes are similar with the exception of phenol/1-pentyne, and are not strongly correlated with the hydrogen bond strength (see Table 1). The vibrational lifetime of the OD stretch of the phenol/1-pentyne complex may be significantly shorter due to the the change in acceptor modes available.
Table 1.
Experimentally determined parameters for the OD hydroxyl stretching mode of phenolOD/π-base hydrogen bonded complexes in the bulk π-base solvent, except CCl4, which does not form a complex.
| solvent | ν(cm-1) | Δν(cm-1) | T1 (ps) | τr (ps) | r(0) |
|---|---|---|---|---|---|
| CCl4 | 2664 | 13.9 | 11.8 ± 1.2 | 2.5 ± 0.3 | 0.27 ± 0.015 |
| chlorobenzene | 2640 | 26.1 | 9.0 ± 0.9 | 5.0 ± 0.5 | 0.34 ± 0.015 |
| bromobenzene | 2634 | 29.4 | 8.1 ± 0.8 | 6.4 ± 0.6 | 0.33 ± 0.015 |
| benzene | 2629 | 24.3 | 9.3 ± 0.9 | 5.3 ± 0.5 | 0.33 ± 0.015 |
| toluene | 2624 | 23.2 | 9.1 ± 0.9 | 6.6 ± 0.7 | 0.35 ± 0.015 |
| p-xylene | 2620 | 22.2 | 8.5 ± 0.9 | 7.6 ± 0.8 | 0.35 ± 0.015 |
| mesitylene | 2614 | 21.0 | 7.4 ± 0.7 | 11.0 ± 1.1 | 0.34 ± 0.015 |
| 1-pentyne | 2605 | 41.2 | 4.9 ± 0.5 | 3.7 ± 0.4 | 0.35 ± 0.015 |
ν–OD stretch absorption line center frequency.
Δν–full width at half maximum of the OD stretch absorption line.
T1–OD stretch vibrational lifetime.
τr–orientational relaxation time constant.
r(0)–amplitude of the anisotropy after the ultrafast inertial decay.
In a purely diffusive model, the reorientation of the transition dipole as a function of time is modeled as a diffusive process where the transition dipole undergoes a random walk in both azimuthal and polar angles. Within this model, TCFs of the Legendre polynomials decay exponentially with rate l(l+1)Dr where l is the order of the Legendre polynomial and Dr is the rotational diffusion constant. For l = 2, which is appropriate for a dipole transition, the rate constant is 6Dr. By measuring C2(t), or the anisotropy, the orientational dynamics of a molecular system can be investigated even when the dynamics are not diffusive on all time scales. Here, the long time portion of the anisotropy decay is diffusive.
The microscopic steps in the diffusive orientational relaxation correspond to inertial motions on the angular potential energy surface. At long times, these random motions generate a mean squared angular displacement that grows linearly in time. However, at short time the molecules move in a ballistic fashion on a sub-picosecond timescale, ~100 fs.28,35-39 The nature of these motions depends on the details of the local potential energy surface.
In the IR pump-probe experiment, the orientational relaxation data at t = 0 is obscured by both the duration of the laser pulses and the coherent artifact produced by the non-resonant electronic polarizability when the pump and probe pulses overlap in time. Therefore, only the diffusive component of the reorientation is directly observed. However, the amplitude of the inertial component of reorientation can be readily determined by examining the extrapolation of the measured anisotropy decay curve to t = 0. An example is shown in Figure 2 for the phenol–benzene complex in benzene at the OD stretch center frequency of 2629 cm-1 along with the single exponential fit. The data can be acquired beginning at 200 fs. Therefore the extrapolation to t = 0 provides an accurate measure of the initial anisotropy associated with the diffusive portion of the orientational relaxation. The difference between the extrapolated t = 0 anisotropy value and the true initial value of 0.4 is the amplitude of the inertial decay. As can been seen in Figure 2, the measured anisotropy extrapolated to t = 0 displays an offset from 0.4. This anisotropy curve also shows the single exponential nature of the anisotropy decay following the initial ultrafast inertial drop. The long-time diffusive orientational relaxation times for all of the complexes are listed in Table 1. Table 1 also gives the initial values, r(0), of the diffusive orientational relaxation decays. The inset in Figure 2 shows that the long time scale diffusive orientational relaxation is independent of the wavelength across the phenol OD stretch absorption line. The diffusive component of the orientational relaxation will be discussed further below.
Figure 2.
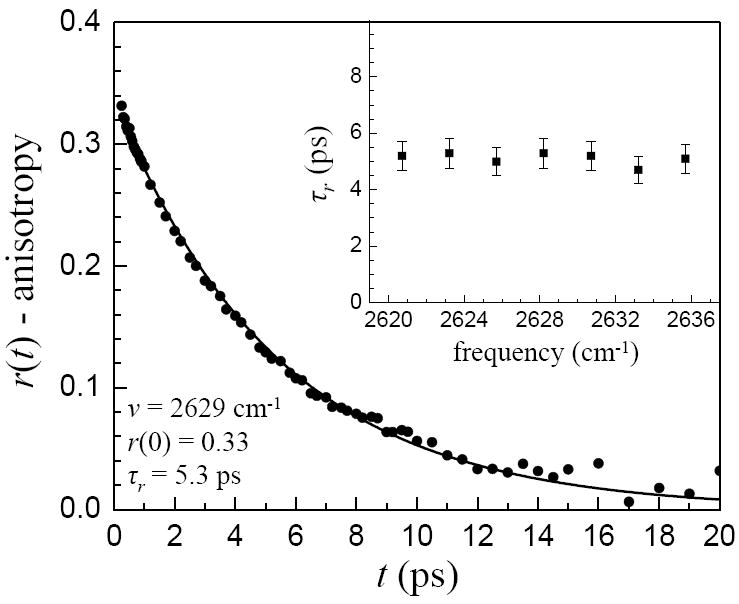
The measured orientational anisotropy decay for phenol/benzene complex measured at 2629 cm-1, the center frequency of the OD stretching band. The curve through the data is a single exponential fit. The value of the curve at t = 0 is a measurement of the amplitude of the ultrafast inertial decay. The inset shows that the measured long time scale orientational relaxation is independent of the frequency across the inhomogeneously broadened OD stretch absorption band.
C. Short Time Anisotropy Decay and Inertial Reorientation
Figure 3 displays r(0) for the seven phenol/π-base complexes and phenol in CCl4. In CCl4, phenol does not form a complex. We refer to uncomplexed phenol as free phenol. r(0) is the value of the anisotropy after the ultrafast inertial orientational relaxation. 0.4 – r(0) is the amplitude of the inertial anisotropy decay. The long time scale diffusive reorientation, discussed in the next section, begins with an anisotropy of r(0). The data are plotted vs. the center frequency of the OD stretch absorption band for each species. As the π-hydrogen bond increases in strength, there is a shift to lower frequency. From left to right (strong hydrogen bond to weak), the points correspond to phenol complexed with 1-pentyne, mesitylene, p-xylene, toluene, benzene, bromobenzene, and chlorobenzene. The point at the highest frequency is free phenol in CCl4. From the data, it is clear that the formation of a hydrogen bond between phenol and the π-base solvents has an impact on the amplitude of the initial anisotropy compared to free phenol. r(0) increases from 0.265 for free phenol in CCl4 to ~0.34 for hydrogen bonded phenol in the complex forming solvents. However, the initial anisotropies measured in the different π-base solvents are identical within experimental error. The dashed line is the average value of r(0) for the complexes.
Figure 3.
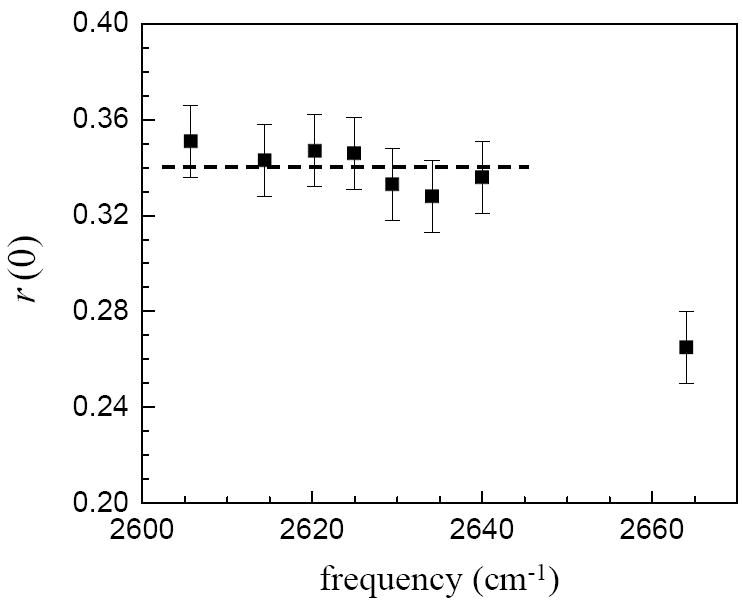
The initial values of the anisotropies following the ultrafast inertial relaxation, r(0), at the center frequencies of the complexes. From left to right the solvents are: 1-pentyne, mesitylene, p-xylene, toluene, benzene, bromobenzene, chlorobenzene, carbon tetrachloride. The dashed line is an aid to the eye drawn at the average value. Within experimental error, all of the complexes have the same amplitude inertial drop, independent of the hydrogen bond strength. Phenol in CCl4, does not form a complex, and it has a substantially different r(0).
We interpret the difference in inertial anisotropy decay between CCl4 and the aromatic solvents as the effect of creating a hydrogen bonded complex. The formation of a complex constrains the inertial cone of angles that are accessible to the OD bond vector. The hydrogen bonding complexes studied here have been previously determined to be T-shaped. Complex formation significantly re-orders the solvent versus free phenol (no complex) in CCl4.17 However, the amplitude of the inertial reorientation is invariant under changes in the strength of the hydrogen bond demonstrating that the mechanism for the more restricted inertial motion upon hydrogen bonding is due to the change in the solvent states around phenol rather than increasing the depth of the librational potential well. The important feature of Figure 3 is that the amplitude of the inertial decay does not depend on the strength of the π-hydrogen bond. Therefore, the strength of the π-hydrogen bond is not the major factor in determining of the phenol angular potential.
Figure 4 displays the initial value of the anisotropy as a function of frequency for phenol dissolved in benzene (the frequency is displayed as deviation from the center of each line in terms of a percent of the Gaussian full-width-half-maximum). All other π-system solvents behave similarly, as each initial anisotropy is strongly frequency dependent. Phenol/benzene is shown as an example. Despite the strength of the hydrogen bond having null effect on the amplitude of the inertial reorientation at the center frequency of each band (see Figure 3), there is a significant frequency dependence across the absorption line in each solvent. The observation of the variation across the absorption lines means that the lines are inhomogeneously broadened. This is not surprising. The inertial dynamics occur on a time scale of <100 fs. 2D IR vibrational echo experiments have shown that phenol/π-hydrogen bonded complexes have absorption line inhomogeneous broadening that persists on much longer time scales.22,23 The phenol/CCl4 system shows a similar frequency dependence but with a larger inertial anisotropy decay (see Figure 3).
Figure 4.
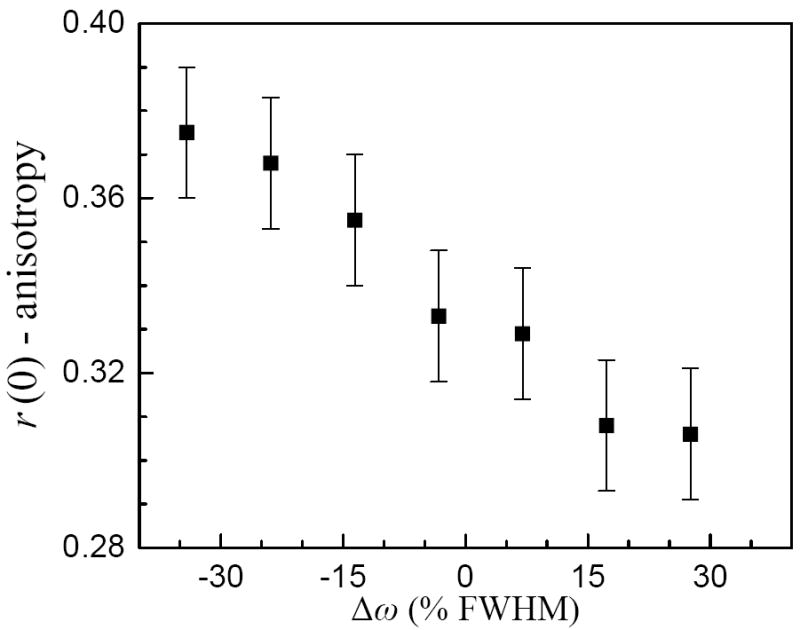
The initial value of the anisotropy following the ultrafast inertial relaxation, r(0), as a function of the percent deviation from the OD stretch absorption band center for phenol in benzene. All of the systems display a significant wavelength dependence similar to the one depicted for benzene.
The inertial reorientation amplitude is determined by the local angular potential surface.21,36,37 The local potential surface is a high dimensionality function which depends on coordinates of the solvation shell. The frequency dependence is caused by the collective structure of the first solvation shell, which varies inhomogeneously across each line and changes the accessible angles for inertial reorientation. Because the hydrogen bond strength does not affect the phenol inertial reorientation amplitude, the local solvation structure is clearly the dominant variable in determining the extent of inertial reorientation even in hydrogen bonding systems. Angular variation of the hydrogen bond is of secondary importance.
The angular dependence of the hydrogen bond being of secondary importance is consistent with theoretical predictions that OH-π interactions are “soft” and shallow, in the angular coordinate.1,14,16 Several studies have looked at model dimers of OH-π systems and found that relatively large deviations in angle do not result in large energy penalties. Our results are also consistent with the gas phase studies of XH-π interactions.13,16
The mechanism for solvent control of inertial reorientation can not be directly determined from the data; however, we may reasonably infer how it proceeds from an understanding of liquid systems and π-π interactions. The data show that for each complex the inertial reorientation amplitudes and OD stretch frequencies are correlated via their mutual correlation with solvent configuration. This means that certain solvent states are less constraining than others in the sense that they allow for greater inertial reorientation of the OD bond. From simple theoretical treatments it can be shown that it is reasonable to factor the force-force correlation function of a solute molecule interacting with a bath into two components, the repulsive interactions and the attractive interactions.40,41 The repulsive interactions are the primary influence on the fast time dynamics of the system, whereas the slowly varying attractive forces dominate the long time dynamics.40 Since the magnitude of the repulsive force contribution to the force-force correlation function increases with density, we believe the states which undergo less inertial reorientation (higher initial anisotropy) are states of higher local density than the mean system density. States of higher density will produce stronger confinement of the phenol molecule and inhibit its free rotation. The correlation of the higher density states (less inertial reorientation) with decreasing frequency is actually the expected behavior corresponding to a simple interpretation of the π-π interaction via the Hunter-Sanders model.2
The Hunter-Sanders model is a simple electrostatic model for the interaction of π systems. In this model, aromatic systems are taken to be composed of a positively charged σ bonding framework and two negatively charged π clouds above and below the σ framework. The model correctly predicts the thermodynamically stable structures of many (but not all) small clusters of aromatic molecules and crystals.2 Within this model, an aromatic molecule solvating a phenol molecule will interact primarily via the electrostatic interaction of the positively charged σ framework with the negatively charged π cloud of the phenol solute. The positive σ framework may also directly interact with the electronegative and polarizable oxygen atom of the OD portion of phenol. The stability of T-shaped and parallel-displaced solvent-solute structures is in accord with this model. When the positively charged σ framework is in the vicinity of the phenol molecule it induces a polarization of the π electron system or the oxygen lone pairs which draws electron density inductively away from the O–D bond. Transfer of electron density away from the OD bond red shifts the OD stretch frequency. The Hunter-Sanders model also suggests cooperativity between the π-π interactions and the OD-π hydrogen bonding interaction; as the deuteron acidity is increased the hydrogen bond becomes stronger, which further red shifts the frequency. Although we stress that this model is not proven by the data, the model is able to qualitatively explain the correlation of frequency and inertial reorientation amplitude through density variations and local solvent configuration changes. The model does not depend on the overall hydrogen bond strength to the solvent, and it predicts frequency shifts as arising from variations in local solvent structure.
The correlation between local aromatic solvent density and the OD stretch has also been examined by both 2D IR spectroscopy and MD simulation.17,25 The spectral diffusion measurements by Kwak et al.25 are suggestive of the role of local solvent configurations and density in mediating the spectral diffusion of phenol/π-base complexes. The timescales of the spectral diffusion are consistent with the timescales of reordering of solvent shells. The fast motionally narrowed component of the spectral line was interpreted as rapid fluctuations in the O-π-acceptor distance. The paper by Kwac et al. showed via a detailed MD stimulation that there is a strong correlation between the number of solvating benzene molecules and the red shift in frequency of the OD stretch.17 This is again consistent with the model of π-π interactions presented above. The data presented here are in accord with both the timescale based evidence of Kwak et al. and the simulation based evidence of Kwac et al.
The frequency dependence of the inertial reorientation of phenol in carbon tetrachloride is also explained by a similar simple electrostatic model of molecular interaction. Despite containing highly electronegative chlorine atoms, carbon tetrachloride actually possesses the electrostatic characteristics of a weak hydrogen bond donor. This is due to charge migration towards the center of the molecule along the C–Cl bond directions. This effect has been explored via electrostatic potential mapping by Hunter.3 The correlation between inertial reorientation and frequency then agrees with the prediction that at higher densities of CCl4 the electron density is polarized away from the OD bond by the effectively positive “tips” of the C–Cl bonds in CCl4. At these higher densities, the red shifted phenol molecules undergo less inertial reorientation. The identification of the mechanism of inhomogeneous broadening in carbon tetrachloride could not be made solely by the spectral diffusion measurement of Kwak et al.25 Although the timescales of spectral diffusion properly identified variations in solvent structure as the inhomogeneous broadening mechanism, the measurement did not identify the “sign” of the interaction. Here, due to the role of density variations in the extent of inhibition of inertial reorientation, it is suggested that the increased carbon tetrachloride interactions at higher local density red shifts the OD stretching frequency.
D. Diffusive Reorientation of the OD-π Hydrogen Bonding Complexes
The long time orientational relaxation is taken to be diffusive in nature for all of the systems studied. Diffusive orientational relaxation is supported by the observed single exponential decays of the long time scale anisotropy curves. It is possible to observe single exponential decays even if orientational relaxation is not diffusive. For example, water undergoes jump reorientation because the structured hydrogen bonding network constrains the system, and reorientation requires jumps between hydrogen bonding configurations.42,43 Here, the phenol complexes are isolated and undergo reorientation as a dilute species in a solvent. An example of anisotropy decay data with a single exponential fit is shown in Figure 2. The orientational relaxation times, τr, of all of the species studied are given in Table 1.
The frequency dependence of the reorientation time across the OD stretch absorption line for the phenol/benzene system is shown in the inset in Figure 2. The wavelengths correspond to approximately ±30% of the FWHM of the absorption line. None of the complexes display a wavelength dependence of the long time scale orientational relaxation. This is in contrast to the inertial anisotropy decays that show significant wavelength dependences (see Figure 4). Details of the dynamics of phenol in CCl4 have been presented previously.25
For the weakly bound π-hydrogen bonding complexes studied here, one can envision two mechanisms for reorientation of the OD bond vector. Reorientation might occur by either rotation of the entire complex or by dissociation of the complex, and fast reorientation of the free phenol, followed by reassociation with a solvent molecule to form a new complex. The free phenol (no complex) has a much smaller hydrodynamic volume than any of the complex, and free phenol would undergo rapid reorientation even when accounting for solvent viscosity. The trend in diffusive reorientation of the complexes indicates that long time reorientation occurs primarily by rotation of the entire hydrogen bonding complex, and not through complex dissociation and reformation (chemical exchange19,22,44). It has been determined that the chemical exchange time increases exponentially with the enthalpy of formation of the π-hydrogen bonded complex.19,44 Therefore, the mechanism that requires complex dissociation would result in dramatic slowing of the long time reorientation as the π-hydrogen bond strength increases. However, 1-pentyne exhibits the fastest long time reorientation of any of the complexes despite having the strongest hydrogen bond. The fast long time reorientation of the phenol/1-pentyne complex is consistent with its relatively small size and the low viscosity of the solvent. Therefore, the dominant mechanism of long time reorientation is the rotation of the entire hydrogen bonded complex.
The inertial reorientation of the OD stretch in phenol/π-base complexes is correlated through angular momentum transfer from the phenol to its binding partner and vice versa. The magnitude and sign of the angular velocity cross correlation functions are indicative of the extent of the rotational coupling. Two coupled molecules can either show positive correlation in their short time angular velocities, indicating rigid-body like rotation, or negative correlation, indicating motion like that of two coupled gears. That the complexes reorient on a long time scale (see above) as a well defined dimer suggests that the angular velocity cross correlation between the two binding partners during the inertial phase is positive. However, the magnitude of the positive correlation is unknown, and likely small. MD simulations by Elola and Ladanyi have previously shown that benzene and hexafluorobenzene heterodimers have positive angular velocity correlation at short times indicating that the rotation has rigid-body character.45 For weaker complexes, such as the benzene–benzene dimer, the angular velocities show negative correlation, indicating gear like motion.45 The classical force field interaction strength of the benzene–hexafluorobenzene complex (~7 kcal/mol) is about 25% stronger than the phenol–benzene complex binding energy (~5.5 kcal/mol). These values suggest that for the systems studied here, the angular velocity correlation will be smaller than in the benzene–hexafluorobenzene system, but remain positive.25,45 A consistent microscopic view of inertial reorientation in the phenol/π-base complexes is that as either the phenol or π-base undergoes inertial rotation, it has a tendency to drag its partner in the same direction. Then, the long time diffusive reorientation of the complexes occurs by many microscopic steps of these correlated inertial motions.
E. Estimation of Angular Structure of OD-π Hydrogen Bonding Complexes
The previous work demonstrating the experimental usefulness of determination of the inertial reorientation by Moilanen et al. developed a “harmonic cone” model of inertial reorientation.21 Within this model the value of the second order Legendre polynomial time correlation function at the end of inertial reorientation is used to calculate the frequency of the librational potential upon which the molecule reorients. The details of the model are presented by Moilanen et al. and build on the theoretical developments by Lipari and Szabo.21,46 Lipari and Szabo developed a model for restricted orientational relaxation within a cone with a hard reflecting conical boundary. In the harmonic cone model, the angular potential is approximated as a two dimensional harmonic well. The inertial dynamics depend on the harmonic potential frequency, the molecular moment of inertia, and the temperature.21 The thermally averaged angular range of motion (the cone angle) is related to the oscillator frequency, the moment of inertia, and the temperature. From the amplitude of the inertial decay and an estimate of the moment of inertia, the cone angle and the harmonic potential frequency can be obtained.
For our calculations the moment of inertia of phenol was taken to be 3.25×10−38 gm·cm2, which is the average of the three principal moments of inertia calculated with DFT at the B3LYP-6-31G* level of theory using the Gaussian 03 program. The calculations result in typical harmonic cone frequencies (librational frequencies) of 30 cm-1, which qualitatively agree with the low frequency librational modes for phenol observed previously.47 In the case of water, the estimated time for inertial motion to be completed was ~100 fs. In the phenol/π-base complex systems MD simulations coarsely suggest that the inertial motion is completed by ~200 fs.45 A complication of the harmonic cone model is that the diffusive reorientation of the complex occurs simultaneously alongside the inertial reorientation.46 Because the diffusive orientational relaxation is quite slow compared to the inertial relaxation, the slow reorientation will not greatly influence the results.
The cone half angles were determined for each solvent system as a function of the frequency across the inhomogeneously broadened absorption lines. All have comparable cone angles because of the similarities of their initial anisotropies (see Figure 4). The results are displayed in Figure 5. For the hydrogen bonded complexes, the black line is the mean of all of the complexes. The gray area covers all of the data from the phenol/π complexes. At the center of the lines, the average cone half angle is ~12°. There is substantial change across the inhomogeneous absorption lines. As discussed above, the low frequency sides of the lines corresponds to more restrictive solvent configurations, and the cone angles are small. On the high frequency sides, the solvent is less confining, and the cone angles are much larger. The variation is substantial, a factor of ~2.5 across the lines. These results are also consistent with the gas phase measurements of Baiocchi et al. on HF/benzene dimers.13
Figure 5.
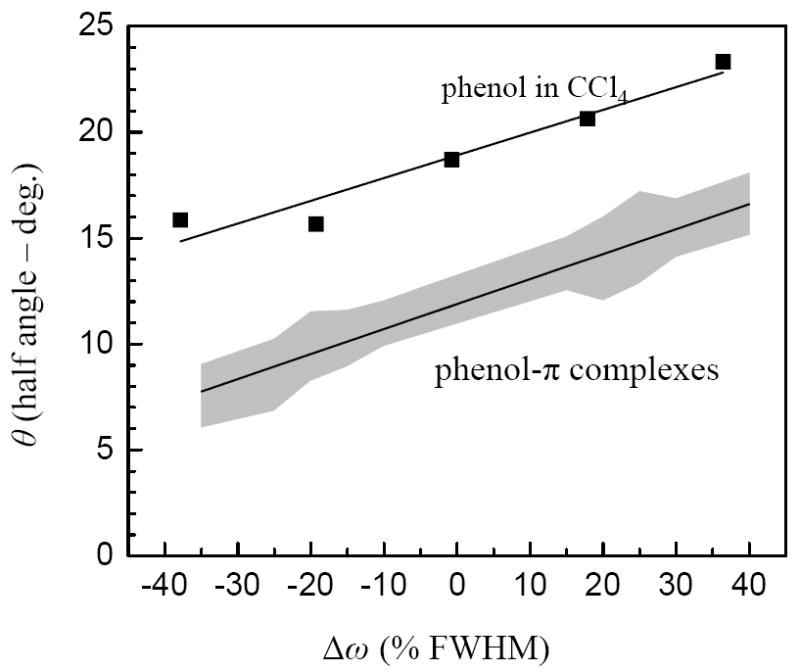
The line through the shaded region reflects the average cone half-angles (least squares fit) of the inertial motion versus deviation from the OD stretch absorption line center for the phenol/π-base complexes and free phenol in CCl4. The shaded region encompasses all of the results for the π-complexes. Free phenol in CCl4 is significantly different.
Also shown are the cone angles for free phenol in carbon tetrachloride. The line is a linear fit to the points. At the center of the line, the cone half angle is substantially larger than found for the complexes. The larger cone angles for free phenol in CCl4 are consistent with our understanding of carbon tetrachloride as a more weakly interacting solvent that does not form well defined intermolecular complexes.
IV. Concluding Remarks
We have examined the inertial orientational relaxation and the diffusive orientational relaxation of seven π-hydrogen bonded complexes formed through the interaction of the hydroxyl group of phenol with other aromatic molecules (chlorobenzene, bromobenzene, benzene, toluene, p-xylene, mesitylene) and with a molecule with a triple bond (1-pentyne). Phenol in CCl4 was also studied. In CCl4, phenol does not form a complex. The measurements were made using polarization and wavelength selective IR pump-probe experiments. The amplitude of the inertial relaxation is directly related to the angular potential felt by the phenol hydroxyl. The seven complexes span a wide range of hydrogen bond strengths. As shown in Figure 3 and in Table 1, the amplitudes of the inertial decays are identical within experimental error, independent of the strength of the hydrogen bond. Therefore, the angular potential of the π-hydrogen bond is not strongly influenced by the strength of the hydrogen bond. However, as shown in Figure 4, there is a systematic variation in the amplitude of the inertial drop as a function of wavelength across the inhomogeneously broadened OD stretch absorption lines. These variations demonstrate that the local solvent configuration around a complex plays the dominate role in determining the hydrogen bond angular potential rather than the strength of the hydrogen bond. These results are consistent with the shallow angular potential that has been observed in gas phase measurements of hydrogen bonded complexes and predicted by theory.13,14,16 The frequency dependence of the initial anisotropy demonstrates that inertial reorientation is highly correlated with the solvent structure and that the solvent structure directly inhomogeneously broadens the absorption lines. The trends in longtime diffusive reorientational relaxation show that the complexes reorient via rotation of the intact hydrogen bonded complex.
The results presented here have implications for other types of systems that have π-hydrogen bonds. Large biological molecules can have numerous π-hydrogen bonding interactions that are partially responsible for stabilizing their structures. Our observations suggest that the π-hydrogen bonds can help bind portions of large molecules into specific configurations without playing a dominant role in determining the angular relationship among portions of the molecule. Such conclusions are also supported by analysis of the hydrogen bond geometries in crystallized proteins which have shown that in the solid state XH-π interactions accept a wide range of angles.4 In the systems studied here, the π-hydrogen bond holds the complexes together, but it is the local environment (solvent) surrounding the π-hydrogen bonded pair that determines the angular potential. In large biomolecules, portions of the molecule surrounding the π-hydrogen bonded pair can play the role of the solvent. While π-hydrogen bonds are part of the glue that maintains secondary and tertiary structures, these bonds permit substantial angular flexibility so that local configurations can be determined by other interactions.
Acknowledgments
This research was supported by a grant from the Air Force Office of Scientific Research (F49620-01-1-0018), the National Institutes of Health (2-R01-GM061137-09), and the National Science Foundation (DMR 0652232). Daniel E. Rosenfeld thanks the Fannie and John Hertz Foundation and the Stanford Graduate Fellowship program for fellowships.
References
- 1.Levitt M, Perutz MF. J Mol Biol. 1988;201:751. doi: 10.1016/0022-2836(88)90471-8. [DOI] [PubMed] [Google Scholar]
- 2.Hunter CA, Sanders JKM. J Am Chem Soc. 1990;112:5525. [Google Scholar]
- 3.Hunter CA. Angew Chem Int Ed. 2004;43:5310. doi: 10.1002/anie.200301739. [DOI] [PubMed] [Google Scholar]
- 4.Steiner T, Koellner G. J Mol Biol. 2001;305:535. doi: 10.1006/jmbi.2000.4301. [DOI] [PubMed] [Google Scholar]
- 5.Brandl M, Weiss MS, Jabs A, Suhnel J, Hilgenfeld R. J Mol Biol. 2001;307:357. doi: 10.1006/jmbi.2000.4473. [DOI] [PubMed] [Google Scholar]
- 6.Waters ML. Curr Opin Chem Biol. 2002;6:736. doi: 10.1016/s1367-5931(02)00359-9. [DOI] [PubMed] [Google Scholar]
- 7.Chakrabarti P, Bhattacharyya R. Prog Biophys Mol Bio. 2007;95:83. doi: 10.1016/j.pbiomolbio.2007.03.016. [DOI] [PubMed] [Google Scholar]
- 8.Mignon P, Loverix S, Steyaert J, Geerlings P. Nucleic Acids Res. 2005;33:1779. doi: 10.1093/nar/gki317. [DOI] [PMC free article] [PubMed] [Google Scholar]
- 9.Sinnokrot MO, Valeev EF, Sherrill CD. J Am Chem Soc. 2002;124:10887. doi: 10.1021/ja025896h. [DOI] [PubMed] [Google Scholar]
- 10.Sinnokrot MO, Sherrill CD. J Am Chem Soc. 2004;126:7690. doi: 10.1021/ja049434a. [DOI] [PubMed] [Google Scholar]
- 11.Sinnokrot MO, Sherrill CD. Journal of the American Chemical Society. 2004;126:7690. doi: 10.1021/ja049434a. [DOI] [PubMed] [Google Scholar]
- 12.Vaupel S, Brutschy B, Tarakeshwar P, Kim KS. J Am Chem Soc. 2006;128:5416. doi: 10.1021/ja056454j. [DOI] [PubMed] [Google Scholar]
- 13.Baiocchi FA, Williams JH, Klemperer W. J Phys Chem. 1983;87:2079. [Google Scholar]
- 14.Suzuki S, Green PG, Bumgarner RE, Dasgupta S, Goddard WA, Blake GA. Science. 1992;257:942. doi: 10.1126/science.257.5072.942. [DOI] [PubMed] [Google Scholar]
- 15.Carney JR, Hagemeister FC, Zwier TS. J Chem Phys. 1998;108:3379. [Google Scholar]
- 16.Zwier TS. Ann Rev Phys Chem. 1996;47:205. [Google Scholar]
- 17.Kwac K, Lee C, Jung Y, Han J, Kwak K, Zheng JR, Fayer MD, Cho M. J Chem Phys. 2006;125:244508. doi: 10.1063/1.2403132. [DOI] [PubMed] [Google Scholar]
- 18.Chaiwongwattana S, Sagarik K. Chem Phys. 2009;355:103. [Google Scholar]
- 19.Zheng JR, Fayer MD. J Am Chem Soc. 2007;129:4328. doi: 10.1021/ja067760f. [DOI] [PMC free article] [PubMed] [Google Scholar]
- 20.Zheng J, Kwak K, Chen X, Asbury JB, Fayer MD. J Am Chem Soc. 2006;128:2977. doi: 10.1021/ja0570584. [DOI] [PubMed] [Google Scholar]
- 21.Moilanen DE, Fenn EE, Lin YS, Skinner JL, Bagchi B, Fayer MD. Proc Nat Acad Sci U S A. 2008;105:5295. doi: 10.1073/pnas.0801554105. [DOI] [PMC free article] [PubMed] [Google Scholar]
- 22.Zheng J, Kwak K, Asbury JB, Chen X, Piletic I, Fayer MD. Science. 2005;309:1338. doi: 10.1126/science.1116213. [DOI] [PubMed] [Google Scholar]
- 23.Kwak K, Zheng J, Cang H, Fayer MD. J Phys Chem B. 2006;110:19998. doi: 10.1021/jp0624808. [DOI] [PubMed] [Google Scholar]
- 24.Kwak K, Rosenfeld DE, Chung JK, Fayer MD. J Phys Chem B. 2008;112:13906. doi: 10.1021/jp806035w. [DOI] [PMC free article] [PubMed] [Google Scholar]
- 25.Kwak KW, Park S, Fayer MD. Proc Nat Acad Sci U S A. 2007;104:14221. doi: 10.1073/pnas.0701710104. [DOI] [PMC free article] [PubMed] [Google Scholar]
- 26.Asbury JB, Steinel T, Stromberg C, Gaffney KJ, Piletic IR, Goun A, Fayer MD. Chem Phys Lett. 2003;374:362. doi: 10.1103/PhysRevLett.91.237402. [DOI] [PubMed] [Google Scholar]
- 27.Piletic IR, Tan HS, Fayer MD. J Phys Chem B. 2005;109:21273. doi: 10.1021/jp051837p. [DOI] [PubMed] [Google Scholar]
- 28.Tan H-S, Piletic IR, Fayer MD. J Chem Phys. 2005;122:174501. doi: 10.1063/1.1883605. [DOI] [PubMed] [Google Scholar]
- 29.Yoshida Z, Ozoe H, Ishibe N. J Am Chem Soc. 1972;94:4948. [Google Scholar]
- 30.Yoshida Z, Ishibe N. B Chem Soc Jpn. 1969;42:3259. [Google Scholar]
- 31.Yoshida ZI, Ishibe N. B Chem Soc Jpn. 1969;42:3254. [Google Scholar]
- 32.Yoshida ZI, Ishibe N. B Chem Soc Jpn. 1969;42:3263. [Google Scholar]
- 33.Yoshida Z, Osawa E. J Am Chem Soc. 1965;87:1467. [Google Scholar]
- 34.Tokmakoff A. J Chem Phys. 1996;105:1. [Google Scholar]
- 35.Loparo JJ, Fecko CJ, Eaves JD, Roberts ST, Tokmakoff A. Phys Rev B. 2004;70:180201. [Google Scholar]
- 36.Laage D, Hynes JT. Chem Phys Lett. 2006;433:80. [Google Scholar]
- 37.Lawrence CP, Skinner JL. J Chem Phys. 2003;118:264. [Google Scholar]
- 38.Rezus YLA, Bakker HJ. J Chem Phys. 2005;123:114502. doi: 10.1063/1.2009729. [DOI] [PubMed] [Google Scholar]
- 39.Piletic IR, Moilanen DE, Spry DB, Levinger NE, Fayer MD. J Phys Chem A. 2006;110:4985. doi: 10.1021/jp061065c. [DOI] [PubMed] [Google Scholar]
- 40.Schweizer KS, Chandler D. J Chem Phys. 1982;76:2296. [Google Scholar]
- 41.Weeks JD, Chandler D, Andersen HC. J Chem Phys. 1971;54:5237. [Google Scholar]
- 42.Laage D, Hynes JT. J Phys Chem B. 2008;112:14230. doi: 10.1021/jp805217u. [DOI] [PubMed] [Google Scholar]
- 43.Laage D, Hynes JT. Science. 2006;311:832. doi: 10.1126/science.1122154. [DOI] [PubMed] [Google Scholar]
- 44.Zheng J, Fayer MD. J Phys Chem B. 2008;112:10221. doi: 10.1021/jp804087v. [DOI] [PubMed] [Google Scholar]
- 45.Elola MD, Ladanyi BM. J Chem Phys. 2005;122:224508. doi: 10.1063/1.1931487. [DOI] [PubMed] [Google Scholar]
- 46.Lipari G, Szabo A. Biophys J. 1980;30:489. doi: 10.1016/S0006-3495(80)85109-5. [DOI] [PMC free article] [PubMed] [Google Scholar]
- 47.Hunt NT, Turner AR, Wynne K. J Phys Chem B. 2005;109:19008. doi: 10.1021/jp052964o. [DOI] [PubMed] [Google Scholar]