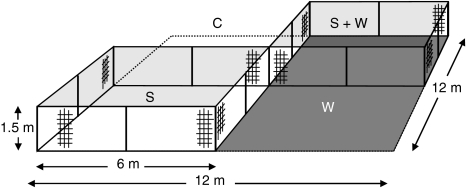
Fig. 2.
Diagram of the experimental treatment layout established in the Lauwersmeer. The two treatments indicated by shading were separated in time, and treatment plots were randomly assigned within blocks. The summer treatment (light grey) ran from March until September and the winter treatment (dark grey) from September until March. c Control plot, s summer exclosure, w winter exclosure, s + w year-round exclosure

