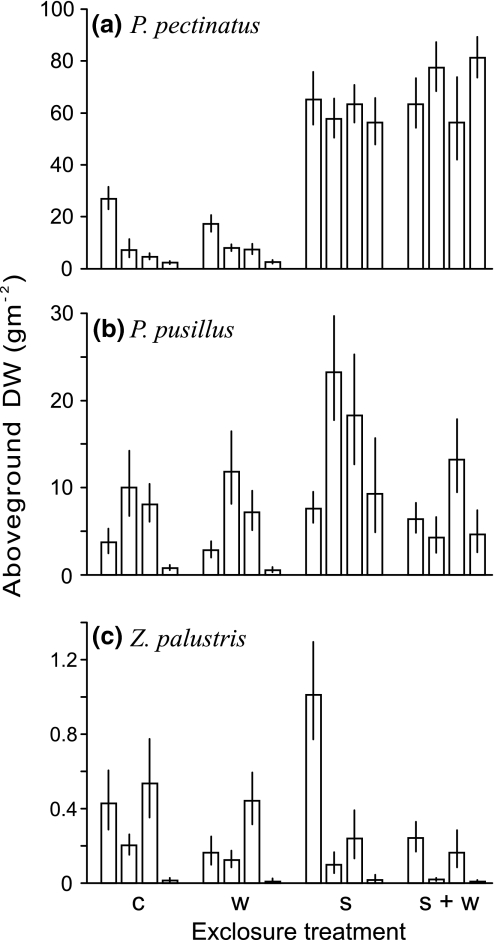
Fig. 3.
Above-ground biomass (mean ± SE) in response to the experimental treatments for a Potamogeton pectinatus, b Potamogeton pusillus and c Zannichellia palustris. Data for each year (2004, 2005, 2006 and 2007) are presented chronologically from left to right within each treatment. Error bars based on mean squares of the residuals from a mixed effect model (winter, summer and year as fixed factors and plot as random factor) fitted to the July cube-root-transformed species biomass data (n = 8 blocks). Note scales are different on y-axes. For abbreviations, see Fig. 2

