Abstract
We describe experiments using single-particle tracking in which mean-square displacement is simply proportional to time (Fickian), yet the distribution of displacement probability is not Gaussian as should be expected of a classical random walk but, instead, is decidedly exponential for large displacements, the decay length of the exponential being proportional to the square root of time. The first example is when colloidal beads diffuse along linear phospholipid bilayer tubes whose radius is the same as that of the beads. The second is when beads diffuse through entangled F-actin networks, bead radius being less than one-fifth of the actin network mesh size. We explore the relevance to dynamic heterogeneity in trajectory space, which has been extensively discussed regarding glassy systems. Data for the second system might suggest activated diffusion between pores in the entangled F-actin networks, in the same spirit as activated diffusion and exponential tails observed in glassy systems. But the first system shows exceptionally rapid diffusion, nearly as rapid as for identical colloids in free suspension, yet still displaying an exponential probability distribution as in the second system. Thus, although the exponential tail is reminiscent of glassy systems, in fact, these dynamics are exceptionally rapid. We also compare with particle trajectories that are at first subdiffusive but Fickian at the longest measurement times, finding that displacement probability distributions fall onto the same master curve in both regimes. The need is emphasized for experiments, theory, and computer simulation to allow definitive interpretation of this simple and clean exponential probability distribution.
Keywords: diffusion, fluorescence, imaging, probability distribution, actin
The supposition that Brownian motion follows Gaussian statistics is seldom tested experimentally. In fact, there are few physical situations in which the statistics of displacement distribution can be measured directly. More often, one simply verifies that mean-square displacement is proportional to time, which defines a diffusion coefficient, D. However, a finite diffusion coefficient does not necessarily stem from a Gaussian distribution, because D only holds information regarding second-order cumulants but not the full probability distribution of displacements (1). Relaxation functions in Fourier space are also heavily relied upon in experimental tests of theories that assume Gaussian statistics, but the limited signal-to-noise ratio in measuring these quantities does not typically allow one to deduce distribution functions in real space with the large dynamic range presented by the experiments described below. It is easy to show formally that other zero-centered distributions than Gaussian, in particular exponentially decaying probability distributions of displacement amplitude, would also lead formally to mean-squared displacement proportional to time.
Here, using single-particle tracking (2), we report the full displacement probability during Brownian motion in 2 complex liquid systems and conclude that the distribution of displacement probability is exponential for large displacements, the variance of the exponential being proportional to time. This is reminiscent of the exponential rather than Gaussian displacement distributions that have been observed in glassy systems and in those systems is believed to originate in activated hopping (3–6). The point is 2-fold: first the finding that this is combined with Fickian diffusion, 〈Δr2〉 ∝ t, and second that the decay length of the exponential, λ(t), grows with the square root of time, t. We also compare with particle trajectories that are subdiffusive at the earliest measurement times but Fickian at the longest measurement times, finding that the displacement probability distributions fall onto the same master curve for both regimes. The fact that λ(t) ∝ is more generic than 〈Δr2〉 ∝ t is striking.
Beyond the 2 independent systems described in this article, in which this pattern was observed by direct measurement, discussion at the end of this article leads us to anticipate that this non-Gaussian diffusion may be common in other complex liquids with slow environmental fluctuations whose wavelength exceeds the size of the diffusing element.
Results
Colloidal Beads on Phospholipid Bilayer Tubes.
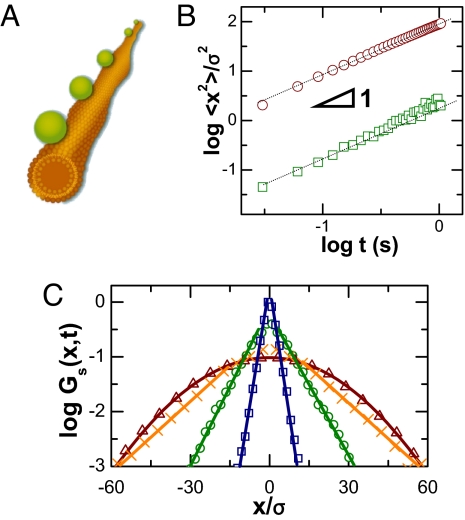
Fig. 1 shows a schematic diagram (Fig. 1A) as colloidal particles were imaged as they diffused on tracks composed of lipid bilayer tubes at concentrations so low that they did not interact with one another. A representative image is shown in supporting information (SI) Fig. S1. The anionic particles adsorbed strongly to the zwitterionic lipid head groups (7), presumably owing to charge–dipole attraction, and were observed to never leave the tubes although they diffuse along them. Although tubes of various diameters formed by using the preparation protocol, we analyzed only those straight tubes with diameter of ≈100 nm (estimated from the colloid transverse vibration range) that lacked long-range vibrations when they lay on the surface of the glass sample cell. To exploit the simplicity of 1 dimension, the particle diameter was kept the same as the tube diameter, ≈100 nm, with the added advantage that for this size, thermal fluctuation significantly outweighed gravity, and the length scale of 100 nm exceeded that of the lipid molecules and the particle roughness, allowing the desired long-range motions to be abstracted. At the experimental temperature, 22–23 °C, these lipids were in the fluid phase. An illustrative 1-dimensional trajectory is shown in Fig. S1. From data of this kind, we calculated the ensemble-average mean-square displacement (MSD), 〈Δx2(t)〉 = 〈∣x(t) − x(0)∣2〉, where x is position and t time, and brackets denote averaging over hundreds of trajectories. Fig. 1B (upper line) shows that MSD is proportional to time over our observation time window—classical Brownian motion.
Fig. 1.
The first system: Colloidal beads diffusing on lipid tubes. (A) Schematic representation of particles with diameter σ = 100 nm, separated by distances >100 σ, diffusing on linear tubes of phospholipid bilayers. (B) Mean-squared displacement, normalized by particle diameter squared, plotted against time on log–log scales for particles on lipid tubes composed of pure DLPC bilayers (upper line) and tubes composed of DLPC bilayers containing 40% cholesterol (bottom line). The lines have slope of unity. (C) From the analysis of hundreds of trajectories without statistical difference, the displacement probability distribution of particles on lipid tubes composed of pure DLPC bilayers is plotted logarithmically against linear displacement normalized by particle diameter for several representative values of time step: 60 ms (squares), 0.6 s (circles), 3 s (crosses), and 5.8 s (triangles).
The relation 〈Δx2(t)〉 = 2Dt, where D is the translational diffusion coefficient, implies D = 0.4 μm2·s−1 for particles. This value is strikingly fast, ≈20% of the value in free dilute suspension, even though the viscosity of lipid bilayers is ≈100 times higher than the viscosity of bulk water, and the particles never left the surface track. Exploring further, we compared our experimental values with diffusion on solid-supported lipid bilayers formed from the fusion of single unilamellar vesicles of these same lipids (8) and found slower diffusion for bilayers, a 2-dimensional diffusion D = 0.01 μm2·s−1, which agrees with literature (9). Although it is true that diffusion on the supported bilayer is expected to be slower than diffusion along the tubes owing to friction from the solid substrate underneath, such reduction is expected to be on the order of a factor of 2, the amount that friction from the supporting substrate reduces diffusion in supported bilayers compared with free-standing giant unilamellar vesicles (10). The much larger difference in diffusion observed is believed to result from coupling to thermal fluctuation of the membrane. Such fluctuations without adsorbed particles have been studied both theoretically and experimentally (11,12). Although fluctuation in the presence of an adsorbed particle might be perturbed, it is reasonable that fluctuations continue to be significant, albeit perturbed, given that particle adsorption can drastically deform membranes (13) and disturb the Goldstone modes of lipid tubules (14).
In another control experiment, we mixed 40% cholesterol into the tubes to stiffen and tighten them (15). The mean-squared displacement remained Brownian but with smaller D, 0.012 μm2·s−1 (Fig. 1B, lower line). This cannot be attributed to viscosity change, because cholesterol increases viscosity by only ≈20% (16). Noting that cholesterol largely suppresses membrane fluctuations, reducing their amplitude by an order of magnitude, this further supports the hypothesis that membrane fluctuations speed up diffusion. In other control experiments, we also observed that adsorbed DNA displays enhanced diffusion, enhanced by approximately the same factor as these rigid colloid particles. The result seems generic.
From the analysis of hundreds of trajectories, the probability distribution of particle displacement, Gs(x,t) = 〈δ(x − ∣xi(t) − xi(0)∣)〉, where xi(t) denotes the projected position along the tube of particle i at time t, are reported in Fig. 1C. Logarithmic Gs(x, t) is plotted against displacement normalized by particle diameter, σ, for particles diffusing on tubes of dilauroylphosphatidylcholine (DLPC), and the distribution was observed to decay linearly on a semilog plot for observation times up to several seconds. Phenomenologically,
However, beyond t ≈ 4 s, the exponential decay smoothly reverted to Gaussian decay, becoming indistinguishable from Gaussian decay within a couple of seconds. Although the statistics change in this major qualitative way, the mean-square displacement remains Fickian, with the same diffusion coefficient throughout.
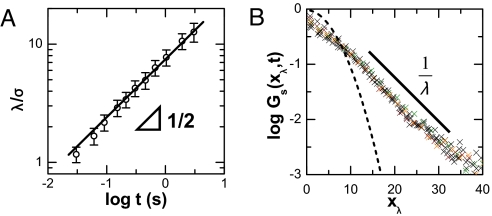
The decay length λ(t) grows as the square root of the time over which displacements are measured, λ(t) ∝ (Fig. 2A), which is consistent with linear MSD. Consequently, the probability distributions collapse to form a master curve if normalized by λ(t) (Fig. 2B). For comparison, Fig. 2B also shows the hypothetical Gaussian distribution that would give this same proportionality between mean-square displacement and elapsed time; one observes fewer small steps than in the Gaussian distribution and more long steps, even though the implied diffusion coefficient is the same. Finally, for the control experiment of diffusion on stiffer tubes (tubes containing cholesterol), the probability distribution was simply Gaussian regardless of the time scale of the step.
Fig. 2.
Time evolution of exponential tails in displacement distribution. (A) The decay length λ(t), plotted versus delay time on log–log scales, shows a square-root power law. (B) Master curve obtained by normalizing the probability distribution by the square root of the time step, xλ = x(t)/, with delay times ranging from 30 ms to 1 s. The solid line, a guide to the eye, shows semilogarithmic behavior. The dotted line shows Gaussian behavior with the same diffusion coefficient.
Colloidal Beads in Entangled Actin Suspensions.
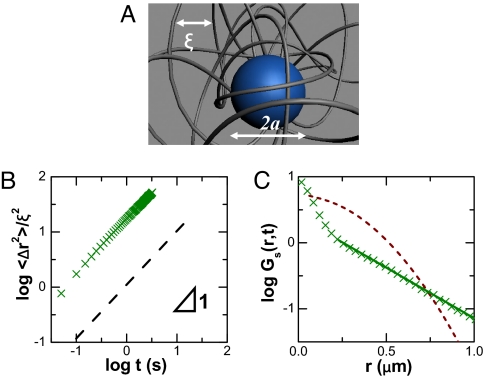
The schematic diagram in Fig. 3A illustrates this system: transport of solute particles (blue sphere) through the porous structure created by surrounding entangled macromolecular filaments (gray) whose translational diffusion is known from many studies of F-actin networks to be slow relative to this transport. These are semiflexible filaments (17).
Fig. 3.
The second system: Nanospheres diffusing in entangled actin. (A) Schematic representation of particles diffusing in entangled actin networks. The mesh size (average spacing between filaments) in nanometers can be estimated as ξ = 300/, where c is actin concentration in milligrams/milliliter. Their concentration is semidilute. The average particle–particle separation is ≈10 μm and their radius is a = 25–250 nm. (B) Mean-square displacement (MSD) normalized by mesh size squared, plotted against time t on a log–log scale for particles in entangled F-actin at conditions of a = 50 nm, ξ = 300 nm, showing a slope of unity. (C) Corresponding displacement probability distributions Gs(r, t) plotted logarithmically against linear displacement for delay time of 0.1 s. Here, Gs(r, t) can be fitted with a combination of a Gaussian at small displacement and exponential at large displacement (solid line). In B, the dashed line is MSD constructed according to the central Gaussian part in the displacement distribution. In C, the dashed line shows a Gaussian distribution with the same diffusion coefficient as for B.
The trajectories of dilute nanoparticles were followed as they diffused through entangled F-actin networks formed as described in SI Text (see Fig. S2). The filament lengths of 2–20 μm were comparable with the persistence length of ≈15 μm (17). Potential nonspecific adsorption to actin was excluded by coating the particles (fluorescent carboxylate-modified polystyrene spheres) with BSA, a widely used blocking protein. The F-actin concentration was kept sufficiently low that the networks remain isotropic.
A pioneering study by Weitz and coworkers on a similar system analyzed patterns of subdiffusive behavior when the ratio of particle size to mesh size was increased (18). Here, we focused on selected values of particle radius (a) and mesh size (ξ), such that displacement was Fickian over times as short as we could measure, as short as 50 ms, and analyzed the full distribution of displacement probability instead. As an extension, we also examined the situation where diffusion was subdiffusive for some window of observation time but was Fickian in the long-time limit.
Strictly Fickian behavior was observed in the least-obstructed systems and was illustrated for 2 cases, both of which are within a/ξ < 0.15 (Fig. 3 and Fig. S3), to show the generality of Fickian behavior when both particle size and mesh size were varied. For Fickian diffusion, classically, one expects Gaussian decay,
where D is the diffusion coefficient, and r(t) denotes the 2-dimensional projection of displacement in time t. This is consistent with the data when the displacement is small, but for larger displacements, the data are definitively exponential instead (Fig. 3C),
One expects, in principle, the displacement distribution to revert to Gaussian at sufficiently long times, but this was not observed, perhaps because the system relaxation time estimated from rheology measurements on similar F-actin networks (>1,000 s) so much exceeds the time on which these experiments were conducted (19). In fact, it was the opposite: The contribution of the central portion that could be fitted as Gaussian decreased with time elapsed. Inspection shows that the cross-over point from Gaussian to exponential occurs approximately at the distance (ξ − 2a)/2, which is the average distance between particle and filaments. When the distributions spread with increasing observation time, this cross-over point did not. The result is that the exponential parts took larger and larger portions of the overall distribution. This then suggests that the exponential arises from interaction between particle and filaments, although a molecular explanation is not the main subject of this article. Furthermore, the dashed line in Fig. 3C shows the hypothetical Gaussian distribution that would lead to the diffusion coefficients implied by the raw data in Fig. 3B. Just as for the first system described in this article, in the observed probability distribution, one observes fewer small steps than in the Gaussian distribution and more long steps, even though the implied diffusion coefficient (D) is the same.
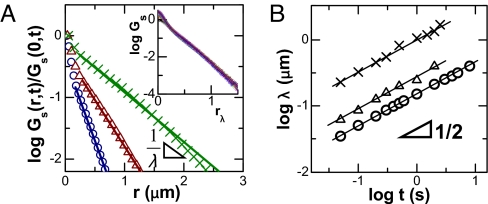
Also in common with the first system described in this article, the temporal evolution of Gs(r, t) reveals that the exponential tail spreads with time. In Fig. 4, the plot on log–log scales shows λ(t) ∝ over 2 orders of magnitude of t.
Fig. 4.
Temporal evolution of the displacement probability distributions. (A) Gs(r, t) for diffusion of particles with radius 100 nm in F-actin (ξ = 300 nm) at delay time t: 1 s (circles), 5 s (triangles), and 20 s (crosses). (Inset) Master curve obtained by normalizing the probability distribution by the square root of the time step, rλ = r(t)/, with delay times ranging from 50 ms to 5 s. (B) Decay lengths λ(t) defined in A are plotted against time on log–log scales. Experimental conditions are a = 50 nm, ξ = 300 nm (crosses); a = 100 nm, ξ = 450 nm (triangles); and a = 100 nm, ξ = 300 nm (circles). Lines have slopes of 1/2. The uncertainty in fitting is less than the symbol size.
We now compare trajectories that span subdiffusive, cross-over, and Fickian diffusion regimes (Fig. 4A, the system with a/ξ ≈ 0.3). It is evident that the displacement distribution is exponential in all 3 regimes and that the decay lengths of the exponential collapse onto the same curve in Fig. 4B (circles). Again, probability distributions collapse to form a master curve when normalized by λ(t) (Fig. 4A Inset), showing universal exponential tails and Gaussians disappearing with time. The fact that λ(t) ∝ is more generic than 〈Δr2〉 ∝ t is striking.
Transition Probability Density.
In the same spirit of comparing mean-square displacement and the full displacement probability functions, we measured conditional probability density, also called transition probability density. From this analysis (SI Text, and see Figs. S4 and S5), we conclude that although both systems have zero-mean displacement correlation and Markovian characteristics, the transitional probability density presents heterogeneous and exponential behavior.
Discussion
We focus below on generic aspects of these observations but first make some system-specific comments. For the first system described here, colloids on lipid tubules, physically, one expects slow entropic forces to promote diffusion because adsorption perturbs spontaneous membrane fluctuations. For the second system described here, colloids in actin networks, entropic forces arise from coupling between these diffusing particles and transverse fluctuations of actin filaments. Considering that the presence of particles might modify the thermal fluctuation of the environment as well, it is reasonable to speculate that these phenomena have an intermittent nature consisting of a long sequence of stochastic bursts resulting in a broad distribution of time scales; analysis along these lines is presented in SI Text. The main point is experimental: the ubiquitous observation of exponential tails.
Regarded just on its own, data for the second system might suggest activated diffusion between pores in the entangled F-actin networks, in the same spirit as activated diffusion and exponential tails observed in glassy systems (3,4). But data for the first system show diffusion nearly as rapid as for the same colloids in free suspension. Although the exponential tail is reminiscent of slow dynamics in a glassy system, in fact, these dynamics are exceptionally rapid.
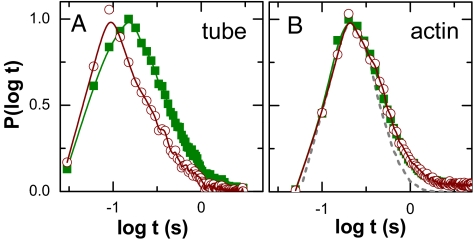
It is tempting to investigate these data in the framework of the continuous-time random walk (CTRW) model, in the same spirit as for glassy systems (3). An exponential-like displacement distribution was implied long ago (20) and also has been derived with approximations for the situation where the transition rate is heterogeneous (3). It has been suggested as well that MSD can be linear in time even when the central limit theorem is not satisfied (21). To pursue this idea, from our raw data, we calculated the “persistence” and “exchange” time distributions (Fig. 5, SI Text, and Fig. S6), introduced to characterize dynamic heterogeneity in random walks (3, 22, 23). In the first system, the lipid tubule system, decoupling of these 2 times can be observed (Fig. 5A), but in the second system, the actin network system, these 2 distributions are the same when the process is Fickian (Fig. 5B). For trajectories that are subdiffusive at early times (Fig. S6), a slight decoupling is observed. Taken together, these findings suggest that exponential statistics is more general than the picture of CTRW models. Interestingly, in all cases, the exchange and persistence time distributions have broader tails than those generated from simulated random walks with Gaussian statistics. Moreover, comparing trajectories on different time scales (Fig. S2), intermittency disappears on long time scales, but exponential tails persist. Most important of all, calculations following this line of reasoning do not necessarily reproduce the power law relation, λ(t) ∝ , which seems to be universal in our observations.
Fig. 5.
Exchange and persistence time distributions (circles and squares, respectively) for particles diffusing (A) on lipid tubules and (B) in actin networks when a = 50 nm and ξ = 300 nm. The corresponding displacement probability distributions are shown in Figs. 1–4. Here, a cutoff displacement length, d, which locates the peak of time distributions at the center of the experimentally accessible time range and serves to define large-scale motions, is defined as 0.5 μm in A and 1 μm in B. Similar results were obtained for d in the range 0.1–5 μm. The dashed line in B presents the exchange and persistence time distributions obtained from a simulated random walk with Gaussian statistics. The exchange and persistence time distributions are identical and have narrower tails.
This discrepancy led us to consider other similar models (Lévy walker and dynamic disorder), which also are discussed in SI Text. Taken together, the common difficulties in evaluating this sort of model are 2-fold. First: how to legitimize on physical grounds the fitting parameters? Second: how to rationalize that the probability distribution function described not only slow dynamics (the second system) but also enhanced diffusion (the first system)?
Another line of explanation, attractive in its simplicity, is to assume that the exponential tail of the probability distribution is a series of Gaussian distributions with different variance. Then the total can be written as G(x) = Σp(x)ω(σ), where ω(σ) is the weight of the Gaussian distribution with given variance. Approximately, the sum can be performed by integration, which gives
assuming that
It follows that λ ∼ . Because each elemental process is diffusive, the variance of the total should be λ2 ∼ t—also diffusive. In this interpretation, the enhanced diffusion observed in our first system reflects contributions from those Gaussians with large variances. Physically, each Gaussian connects to a certain level of force on the particle as a consequence of the central limit theorem, and the weightings reflect Boltzmann distributions of those states (1). Observed in the laboratory frame, as we have done in this experimental study, diffusion is then the superposition of a packet of diffusive processes.
These arguments are similar in spirit to notions about distributions of dynamic activity in supercooled liquids (24, 25). For this picture to be consistent, dynamic heterogeneity must flip very fast in our systems. On the one hand, this is supported by the observations of Fickian diffusion, no significant velocity autocorrelation on the experimental time scales, and exchange and persistence time distributions that are nearly the same. This contrasts with glasses, where correlations of heterogeneity are long lived, finally leading to bistability of trajectories (26) and spatial distribution of fast and slow populations (27). On the other hand, there are difficulties. It is not clear how to justify the assumption of independent Gaussian processes when they are highly entangled nor that variances are related to one another in this assumed way. Also, one must establish explicitly the connection between environmental fluctuations and dynamic heterogeneity in trajectory space.
The data presented in this article raise fundamental questions concerning what is the statistical nature of the diffusive process when the physical situation is such that the assumption of Einstein's classic derivation of Brownian motion are not satisfied. It is our hope that this experimental study will call renewed theoretical and experimental attention to the problem of random walks under conditions where the environment fluctuates on similar time scales as the random walk itself. Additional analysis is in SI Text.
Materials and Methods
The experiments were conducted by imaging the diffusion of tracer submicron-sized particles by using epifluorescence microscopy and quantifying their trajectories by using single-particle tracking. The preparation of tubular lipid vesicles and the assembly of F-actin filaments followed standard protocols. Details can be found in SI Text.
Supplementary Material
Acknowledgments.
We are indebted to J. F. Douglas, Y. Oono, and K. S. Schweizer for discussions and to Shan Jiang and Mo Jiang for experimental help. This work was supported by the US Department of Energy, Division of Materials Science, under Award. DEFG02-02ER46019. S.M.A. acknowledges a Graduate Research Assistantship from the National Science Foundation.
Footnotes
The authors declare no conflict of interest.
This article is a PNAS Direct Submission.
This article contains supporting information online at www.pnas.org/cgi/content/full/0903554106/DCSupplemental.
References
- 1.McLennan JA. Introduction to Non-Equilibrium Statistical Mechanics. Englewood Cliffs, NJ: Prentice Hall; 1989. [Google Scholar]
- 2.Anthony S, Zhang L, Granick S. Methods to track single-molecule trajectories. Langmuir. 2006;22:5266–5272. doi: 10.1021/la060244i. [DOI] [PubMed] [Google Scholar]
- 3.Chaudhuri P, Berthier L, Kob W. Universal nature of particle displacements close to glass and jamming transitions. Phys Rev Lett. 2007;99 doi: 10.1103/PhysRevLett.99.060604. 060604. [DOI] [PubMed] [Google Scholar]
- 4.Saltzman EJ, Schweizer KS. Large-amplitude jumps and non-Gaussian dynamics in highly concentrated hard sphere fluids. Phys Rev E. 2008;77 doi: 10.1103/PhysRevE.77.051504. 051504. [DOI] [PubMed] [Google Scholar]
- 5.Bailey NP, Schrøder TB, Dyre JC. Exponential distributions of collective flow-event properties in viscous liquid dynamics. Phys Rev Lett. 2009;102 doi: 10.1103/PhysRevLett.102.055701. 055701. [DOI] [PubMed] [Google Scholar]
- 6.Stariolo DA, Fabricius G. Fickian crossover and length scales from two point functions in supercooled liquids. J Chem Phys. 2006;125 doi: 10.1063/1.2221309. 064505. [DOI] [PubMed] [Google Scholar]
- 7.Wang B, Zhang L, Bae SC, Granick S. Nanoparticle-induced surface reconstruction of phospholipid membranes. Proc Natl Acad Sci USA. 2008;105:18171–18175. doi: 10.1073/pnas.0807296105. [DOI] [PMC free article] [PubMed] [Google Scholar]
- 8.Zhang L, Granick S. Slaved diffusion in phospholipid bilayers. Proc Natl Acad Sci USA. 2005;102:9118–9121. doi: 10.1073/pnas.0502723102. [DOI] [PMC free article] [PubMed] [Google Scholar]
- 9.Ewers H, et al. Single-particle tracking of murine polyoma virus-like particles on live cells and artificial membranes. Proc Natl Acad Sci USA. 2005;102:15110–15115. doi: 10.1073/pnas.0504407102. [DOI] [PMC free article] [PubMed] [Google Scholar]
- 10.Przybylo M, et al. Lipid diffusion in giant unilamellar vesicles is more than 2 times faster than in supported phospholipid bilayers under identical conditions. Langmuir. 2006;22:9096–9099. doi: 10.1021/la061934p. [DOI] [PubMed] [Google Scholar]
- 11.Leitenberger SM, Reister-Gottfried E, Seifert U. Curvature coupling dependence of membrane protein diffusion coefficients. Langmuir. 2008;24:1254–1261. doi: 10.1021/la702319q. [DOI] [PubMed] [Google Scholar]
- 12.Kaizuka Y, Groves JT. Hydrodynamic damping of membrane thermal fluctuations near surfaces imaged by fluorescence interference microscopy. Phys Rev Lett. 2006;96:118201. doi: 10.1103/PhysRevLett.96.118101. [DOI] [PubMed] [Google Scholar]
- 13.Deserno M. Elastic deformation of a fluid membrane upon colloid binding. Phys Rev E. 2004;69 doi: 10.1103/PhysRevE.69.031903. 031903. [DOI] [PubMed] [Google Scholar]
- 14.Fournier J-B, Galatola P. Critical fluctuations of tense fluid membrane tubules. Phys Rev Lett. 2007;98 doi: 10.1103/PhysRevLett.98.018103. 018103. [DOI] [PubMed] [Google Scholar]
- 15.Koster G, VanDuijin M, Hofs B, Dogterom M. Membrane tube formation from giant vesicles by dynamic association of motor proteins. Proc Natl Acad Sci USA. 2003;100:15583–15588. doi: 10.1073/pnas.2531786100. [DOI] [PMC free article] [PubMed] [Google Scholar]
- 16.El-Sayed MY, Guion TA, Fayer MD. Effect of cholesterol on viscoelastic properties of dipalmitoylphosphatidylcholine multibilayers as measured by a laser-induced ultrasonic probe. Biochemistry. 1986;25:4825–4832. doi: 10.1021/bi00365a016. [DOI] [PubMed] [Google Scholar]
- 17.Sheterline P, Clayton J, Sparrow JC. Actin. 4th Ed. New York: Oxford Univ Press; 1998. [Google Scholar]
- 18.Wong IY, et al. Anomalous diffusion probes microstructure dynamics of entangled F-actin networks. Phys Rev Lett. 2004;92:178101. doi: 10.1103/PhysRevLett.92.178101. [DOI] [PubMed] [Google Scholar]
- 19.Janmey PA, et al. The mechanical properties of actin gels: Elastic modulus and filament motions. J Biol Chem. 1994;269:32503–32513. [PubMed] [Google Scholar]
- 20.Montroll EW, Weiss GH. Random walks on lattices II. J Math Phys. 1965;6:167–181. [Google Scholar]
- 21.Tunaley JKE. Theory of ac conductivity based on random walks. Phys Rev Lett. 1974;33:1037–1039. [Google Scholar]
- 22.Hedges LO, Maibaum L, Chandler D, Garrahan JP. Decoupling of exchange and persistence times in atomistic models of glass formers. J Chem Phys. 2007;127:211101. doi: 10.1063/1.2803062. [DOI] [PubMed] [Google Scholar]
- 23.Berthier L, Chandler D, Garranhan JP. Length scale for onset of Fickian diffusion in supercooled liquids. Europhys Lett. 2005;69:320–326. [Google Scholar]
- 24.Merolle M, Garrahan JP, Chandler D. Space–time thermodynamics of the glass transition. Proc Natl Acad Sci USA. 2005;102:10837–10840. doi: 10.1073/pnas.0504820102. [DOI] [PMC free article] [PubMed] [Google Scholar]
- 25.Xia X, Wolynes PG. Microscopic theory of heterogeneity and nonexponential relaxations in supercooled liquids. Phys Rev Lett. 2001;86:5526–5529. doi: 10.1103/PhysRevLett.86.5526. [DOI] [PubMed] [Google Scholar]
- 26.Hedges LO, Jack RL, Garrahan JP, Chandler D. Dynamic order–disorder in atomistic models of structural glass formers. Science. 2009;323:1309–1313. doi: 10.1126/science.1166665. [DOI] [PubMed] [Google Scholar]
- 27.Swallen SF, Bonvallet PA, McMahon RJ, Ediger MD. Self-diffusion of tris-naphthylbenzene near the glass transition temperature. Phys Rev Lett. 2003;90 doi: 10.1103/PhysRevLett.90.015901. 015901. [DOI] [PubMed] [Google Scholar]
Associated Data
This section collects any data citations, data availability statements, or supplementary materials included in this article.


