

Abstract
The binding kinetics of the intercalative binding of Triostin A to λ-DNA was investigated by measuring the force extension response of the DNA-ligand complexes with an optical tweezers system. These force response curves, containing the information about different binding properties, were analyzed based on a recent method (put forth by another research group) for monointercalators that was extended to bisintercalators. Our binding analysis reveals an exponential dependence of the association constant on the applied external force as well as a decreasing binding site size. In general, our results are in agreement with those for the monointercalator ethidium. However, to explain the high-force binding site size, a new model for bisintercalation of Triostin A at high forces is proposed.
Introduction
The measurement of elastic properties of double-stranded DNA with optical tweezers has proven to be a useful method for exploring the characteristics of specific ligand-DNA complexes (1–4). For stretching a DNA molecule beyond its contour length to an extension x, a specific external force F is needed. Plotting F vs. x results in a typical force-extension curve (5), in which the elastic regime can be described by the wormlike chain equation (6) for forces up to 50 pN. Additional stretching results in a characteristic force plateau at ∼65 pN, which stems from structural cooperative transitions, including unwinding of the double helix and force-induced melting of the DNA basepairs (7).
In general, adding a solution of DNA-binding ligands results in a significantly changed force-extension response. This changed elastic behavior allows the discrimination of different binding modes like intercalation or groove binding (1–4).
The intercalation-binding mode is characterized by stacking of planar aromatic parts of the ligand between adjacent DNA basepairs. The result is an increased DNA contour length that can easily be distinguished from force-extension diagrams (1).
To detect possible cooperative or higher order binding phenomena, we investigated the binding kinetics of the bisintercalator Triostin A to double-stranded λ-DNA. As a member of the quinoxaline family of antibiotics, Triostin A consists of a cyclic disulfide bridged backbone with two covalently linked quinoxalines that are well oriented for bisintercalation in dsDNA (Fig. 1 a) (8,9).
Figure 1.
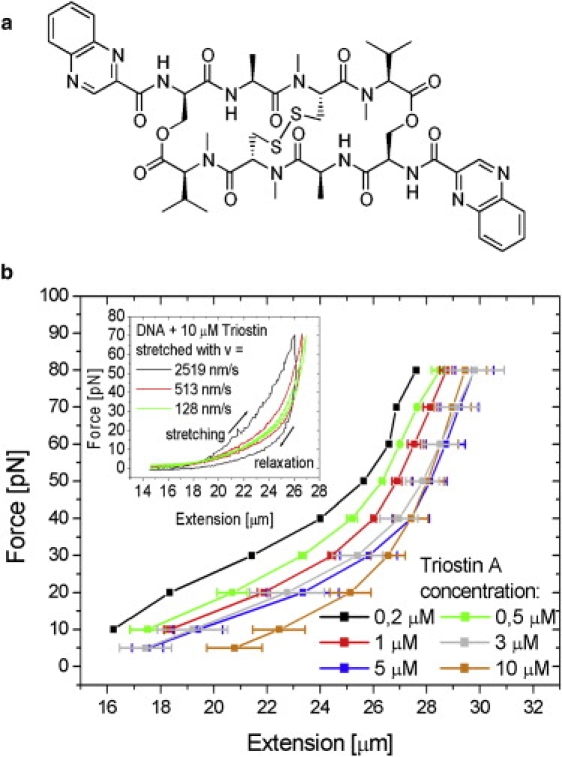
(a) Chemical structure of Triostin A. (b) Equilibrium force-extension curves of a single λ-DNA molecule in the presence of different Triostin A concentrations (colored curves) show a different force response compared to ligand-free DNA. Each data point of each curve was determined by averaging three individual force-clamp measurements (see text). Error bars were derived from standard deviation. (Inset) The velocity dependence of the force-extension response measured at a Triostin A concentration of 10 μM. The curves were measured at velocities of 2519 nm/s (black curve), 513 nm/s (red), and 128 nm/s (green), respectively. The hysteresis, indicating a nonequilibrium binding behavior, becomes smaller, the slower the chosen velocity is.
Our goal was to measure the ligand concentration-dependent DNA force-extension response with our previously described (10) optical tweezers system and analyze the results based on a method that Vladescu et al. used on mono-intercalators like ethidium (11). This method had to be modified and extended for the analysis of a bisintercalator like Triostin A.
Materials and Methods
All experiments were conducted in our homebuilt fluid chamber, which is described in detail elsewhere (10). λ-DNA (Promega, Madison, WI) was biochemically labeled with multiple biotin molecules at both ends. Streptavidin-coated microbeads (Spherotech, Lake Forest, IL; diameter 3.28 μm), the biotin-labeled DNA, and Triostin A were dissolved in phosphate-buffered saline (136 mM NaCl, 2.7 mM KCl, 8.1 mM Na2PO4, 1.5 mM KH2PO4) with pH 7.4 containing 1 μM EDTA. Bead solution was diluted to 1.5 × 10⁻⁴% w/v, DNA solution to a concentration of 2 pM, and Triostin A to different concentrations ranging from 0.2 μM to 10 μM.
At the beginning of each experiment, two beads were captured. One bead remained on the tip of a glass micropipette, whereas the other was held in the optical trap to act as a force sensor. The optical trap was calibrated using the drag force acting on the trapped bead due to Stokes' law (10).
The immobilization of λ-DNA molecules between the two beads was achieved by biotin-streptavidin binding. After injecting DNA solution at a velocity of ∼1.5 mm/s into the fluid chamber, a step of ∼5 pN in the force signal could be observed, indicating that one λ-DNA molecule had bound to the trapped bead. Now the pipette with the bead on its tip was moved closer to the trap, until the DNA was properly tethered between the two beads. The λ-DNA was then stretched by moving the pipette relative to the optical trap by a piezo stage with nanometer precision. The velocity of the stage could be regulated between 25 nm/s and 100 μm/s. Our experimental setup was controlled by a LabVIEW (National Instruments, Austin, TX) program.
After the immobilization procedure, we measured a 30-s force-extension cycle of a single λ-DNA-molecule in the absence of Triostin A as a reference. Then, Triostin A solution of a specific concentration C was injected into the fluid chamber. Stretching the DNA-ligand complex was done by moving the stage with a typical velocity of 1.2 μm/s to a specified distance or until a predefined force acted on the trapped bead. Afterwards the stage returned to its initial position, relaxing the complex again. This was accomplished by a specific routine in our LabVIEW program.
Results
All force-extension curves exhibited a distinct hysteresis over the complete stretching/relaxation cycle (Fig. 1 b, inset), which is being formed by the force curve of the molecule's relaxation taking a different course than that taken during stretching. This is in contrast to mono-intercalators.
The size of the hysteresis area between the stretching and the relaxation part of the curve is gradually increasing with higher stretching velocity. Both the hysteresis and the velocity dependence indicate that the DNA-intercalator complex is not in equilibrium during our measurements. At smaller velocities, the hysteresis effects got smaller, reflecting the fact that the complex was closer to equilibrium. A sudden elongation of the DNA to a fixed length leads to an exponential retention-force decay with a time constant in the one-digit second range until a constant equilibrium force is reached. This force decay is another indication for a nonequilibrium phenomenon (1), until a stable extension state is reached.
Even at the smallest available pulling rate of 25 nm/s, or down to forces of 10 pN, hysteresis phenomena occurred. Since common binding equations like the law of mass action are typically not valid for systems in nonequilibrium, equilibrium curves are needed for further analysis. Therefore, we used the force-clamp measuring mode for each individual concentration of Triostin A with different predefined forces, where each force is held constant by the control software. First, the ligand-DNA complex is stretched at high velocity (typically 1.2 μm/s), until the predefined force is reached. Because of the retention-force decay, the extension has to be continuously readjusted by the program to retain the target force until the ligand-DNA complex reaches its equilibrium state. The resulting equilibrium extension lengths for several forces were combined to equilibrium curves, as shown in Fig. 1 b.
As the DNA elongation curves for each ligand concentration contain all information about the intercalative binding, an analysis of key values like binding constant and binding site size is now possible.
Vladescu et al. (11) have demonstrated a method for binding analysis of DNA-complexes with mono-intercalators such as ethidium that is a basis for our following analysis.
Since the DNA-Triostin A complex shows a relative elongation compared to the ligand free DNA as a result of the intercalation, the concentration-dependent fractional elongation per basepair γ(F, C) can be determined for each force,
| (1) |
where x(F, C) is the extension of the Triostin A-DNA complex and x(F, C=0) is the extension of the ligand free DNA at the same force. γ(F, C) cannot be calculated for forces above 60 pN because of the overstretching force-plateau at 65 pN. This problem can be eliminated by determining x(F, C=0) from a wormlike chain fit of the pure DNA curve, thereby neglecting the force plateau, as done by Vladescu et al. (personal communication, M. C. Williams, 2009).
Further, this fractional elongation is related to v, the fractional number of molecules intercalated per binding site in the binding equation of McGhee and von Hippel (12):
| (2) |
KA is the force-dependent equilibrium association constant for intercalative binding and n is the binding site size in basepairs of a ligand molecule.
In Vladescu et al. (11), it is assumed that γ(F, C) = v. This would imply that, e.g., 50% occupied binding sites result in a 50% increased DNA contour length, which is only valid if each intercalating molecule would lengthen the DNA molecule by an amount Δx equal to the basepair distance xbp(F, C=0) of the ligand-free DNA, which is ∼0.33 nm in the range of forces used here. Since this cannot be assumed in general, a correction has to be taken into account for the calculation of v,
| (3) |
The factor 0.5 accounts for the analysis of bisintercalators, containing two intercalating molecule parts. Combining Eqs. 2 and 3, we get a modified binding equation:
| (4) |
Our data was fitted to Eq. 4 with KA, n and Δx as parameters. The resulting γ vs. C curves for eight different forces are shown in Fig. 2. The three parameters were evaluated from the fits and plotted against F to investigate their force dependence (see Fig. 3, a and b, and inset). KA shows an exponential dependence on the applied force as expected from theoretical considerations (13). Extending the dsDNA double helix requires mechanical work, which has to be done by the Triostin A molecules to intercalate. This work equals the free energy change of the system. Therefore an external force, stretching the DNA molecule, reduces the intercalation free energy, which is the energy required for the binding of the ligands. In other words, an applied force leads to an increased binding of Triostin A molecules along with a higher association constant. This can be expressed as (11)
| (5) |
where K0 is the binding equilibrium constant at zero force, Δx the DNA elongation of a single intercalated molecule moiety, and kBT the thermal energy. Fitting our data in Fig. 3 a with Eq. 5 results in a zero force-binding constant of K0 = (5.8 ± 0.3) × 105 M−1. For this fitting procedure, we used a fixed value of Δx, which we obtained from Eq. 4: Since Δx exhibits only very small fluctuations, it can be assumed as constant with an average value of Δx = 0.316 nm (see Fig. 3 b, inset).
Figure 2.
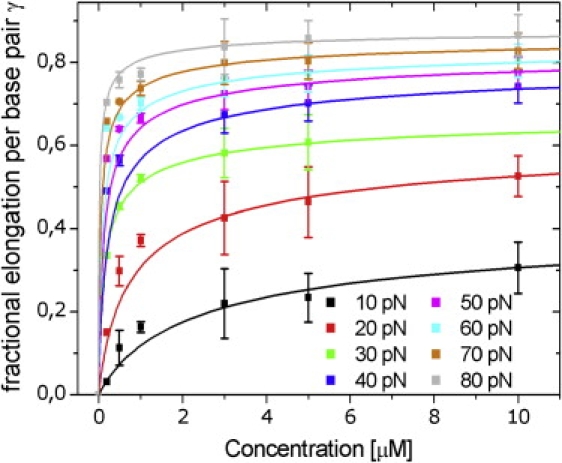
Fractional elongation of the DNA as a function of the Triostin A concentration for different forces. Data points were calculated from the equilibrium force extension curves in Fig. 1. The lines represent fits to the modified version of the McGhee and von Hippel (12) binding equation (Eq. 4).
Figure 3.
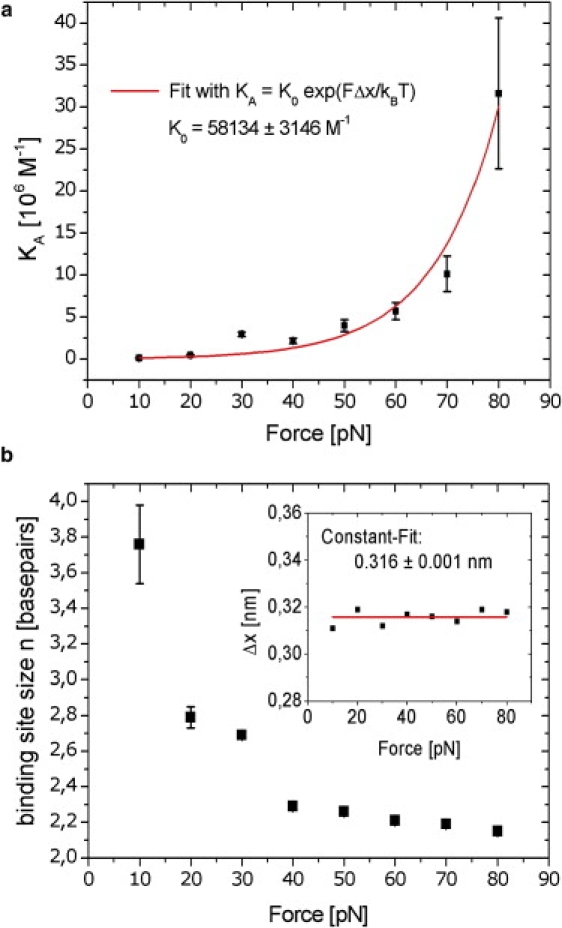
Dependence of association constant, binding site size, and DNA elongation per intercalated Triostin A molecule part on the applied force. (a) The binding constant shows exponential force dependence. The red line represents a fit to Eq. 5 (with a fixed value for Δx = 0.316 nm; see also inset of panel b), leading to a value for the zero force binding constant K0. (b) Binding site size decreases exponential-like with force. At forces >10 pN, the binding site size is smaller than three, which requires a binding mode that cannot be explained by the closest packing mode without neighbor exclusion. (Inset) Δx is almost constant at all measured forces, denoting that the DNA elongation upon a single intercalation event is independent of force.
The fitted values for n ranged between 3.76 bp at F = 10 pN and 2.15 bp at F = 80 pN (see Fig. 3 b).
The influence of the correction term in Eq. 4 was addressed in Fig. 4, where we calculated fits of Eq. 4 with five different Δx values. Whereas the parameter n shows a considerable dependence on Δx, only minor, negligible fluctuations of the binding constant are apparent (not shown), emphasizing the importance and validity of our corrections.
Figure 4.
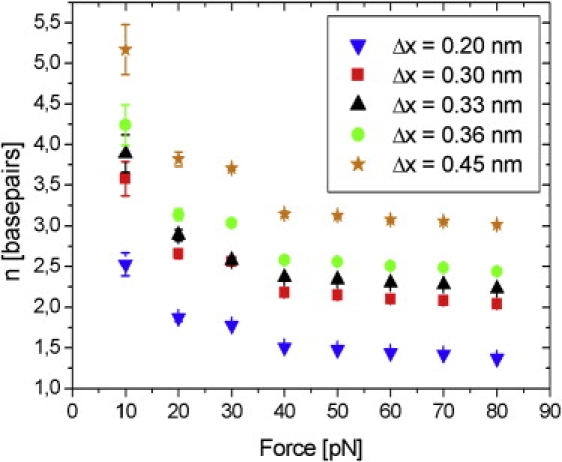
The fit results of our data show considerable dependence of the parameter Δx on n, when repeating the fit procedure analog to Fig. 3b, but with other values of Δx: Five exemplary fit results to our data using Eq. 4 with five different, fixed values for Δx are shown. Only a fixed value of Δx = 0.316 nm would lead to the same result as shown in Fig. 3b.
Discussion
The force-dependent binding kinetics of the bisintercalator Triostin A was investigated. Because an applied force promotes intercalator binding, more and more ligands can bind to the DNA during the stretching cycle. This leads to a further elongation of the DNA contour length.
A hysteresis in force-extension curves is a clear sign for the rather slow kinetics of Triostin A binding to DNA, causing a nonequilibrium binding behavior under all pulling velocities. This seems to be a general characteristic of bisintercalators (1,2), whereas complexes of DNA and most mono-intercalators are in equilibrium during stretching experiments, showing no signs of hysteresis or retention-force decay. Nevertheless, exceptions exist, e.g., Daunomycin is a mono-intercalator that shows small nonequilibrium effects (1).
The binding analysis method of Vladescu et al. was adapted and applied for analysis of bisintercalators. Our method provides comparable results for the force dependence of the association constant to the results presented for ethidium (11). The derived zero force binding constant of K0 = (5.8 ± 0.3) × 105 M−1 compares favorably with a previously published value of KA (at F = 0) ≈ 106 M−1, which was determined by a solvent partition method (8,9).
According to our fit results, each intercalated Triostin A molecule part increases the DNA contour length by Δx = 0.316 nm, which is in good agreement to already published values for other intercalators, varying between Δx = 0.18 nm and 0.45 nm (11).
The decreasing binding site size per molecule n with increasing force is consistent with the results of Vladescu et al. Interestingly, our results show, however, a different behavior than for ethidium at lower forces (between 10 pN and 20 pN). We observed an exponential-like decay of n, resulting in n = 2.15 bp at a force of 80 pN. However, a binding site size of <3, which we observed for forces larger than 10 pN, requires a binding mode that cannot be explained by the closest packing mode without neighbor exclusion (see Fig. 5 a).
Figure 5.
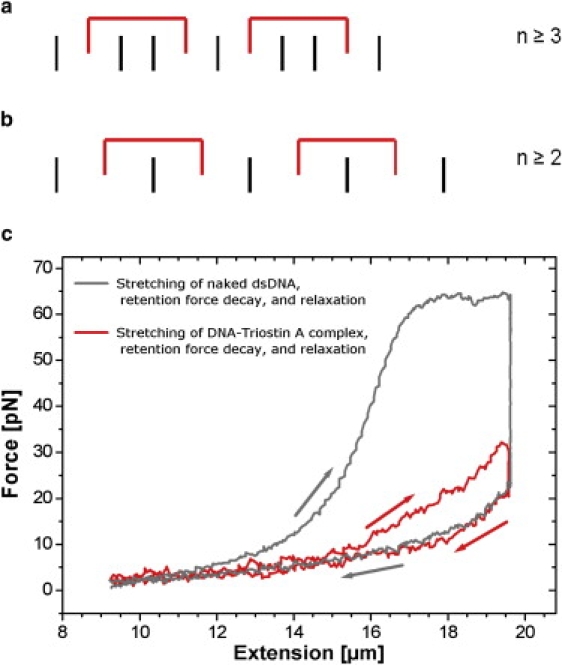
Estimation of a lower limit for the binding site size n. The black lines represent DNA basepairs, whereas Triostin A molecules are displayed by the red brackets. (a) Closest packing of ligands without nearest-neighbor exclusion. (b) Closest packing under the assumption that Triostin A can bind by enclosing only one DNA basepair. (c) Triostin A (concentration of 2 μM) was added to an overstretched, naked dsDNA (gray). The following retention-force decay to 20 pN (vertical part of graph) and the relaxation curve were identical to those of a DNA-Triostin A complex (red). In both cases, Triostin A molecules are supposed to bind by enclosing only one basepair.
To discuss the plausibility of this interesting and unexpected result, the structure of Triostin A has to be considered. The nearest-neighbor exclusion principle (14) implies that between two intercalated molecules, at least one binding site has to be unoccupied. Even if this principle is assumed to be violated, a value of n < 3 bp cannot be achieved. To date, Triostin A has been reported to always enclose two adjacent DNA basepairs between its quinoxaline molecule clamp (15), predicting n ≥ 3 bp even at closest package and without neighbor exclusion.
To answer this obvious conflict between theory and experiment, we propose a novel binding mode that occurs under external forces of >10 pN. Namely, upon continuously (over)stretching a DNA-Triostin A complex, its local structure is affected by the additional strain energy inducing some Triostin A molecules to dissociate and to reassociate (otherwise, no hysteresis would occur). Reassociation under external forces now favorably support a novel binding mode where only one basepair between the two Triostin clamps is enclosed (Fig. 5 b) which, in turn, is more likely the larger the external forces are. In this model, a minimum binding site size of n = 2 bp is possible, in full consistency with our results.
To investigate these binding properties with respect to the initial state-dependent effects, Triostin A was added at predefined concentrations (0.1–2 μM) to an already overstretched, naked dsDNA molecule that was held at constant extension (initial stretching force: 64 pN). Since in this overstretched DNA the double helix is deformed and the average distance between adjacent basepairs is increased (7), we expect that Triostin A molecules are supposed to bind by enclosing one basepair only. During this Triostin A binding, a retention force decay to a lower level was observed, which is identical to the force decay that could be observed when a originally relaxed DNA-Triostin complex was rapidly stretched and held at the same extension. Furthermore, both relaxation curves were found to be identical (Fig. 5 c). These observations conclusively prove that the proposed binding mode (see Fig. 5 b) is a general binding phenomenon between the bisintercalating ligand Triostin A and DNA under external forces >10 pN.
Acknowledgments
We gratefully acknowledge financial support from the Deutsche Forschungsgemeinschaft (grant No. SFB 613).
References
- 1.Sischka A., Tönsing K., Eckel R., Wilking S.D., Sewald N. Molecular mechanisms and kinetics between DNA and DNA binding ligands. Biophys. J. 2005;88:404–411. doi: 10.1529/biophysj.103.036293. [DOI] [PMC free article] [PubMed] [Google Scholar]
- 2.Bennink M.L., Schärer O.D., Kanaar R., Sakata-Sogawa K., Schins J.M. Single-molecule manipulation of double-stranded DNA using optical tweezers: interaction studies of DNA with RecA and YOYO-1. Cytometry. 1999;36:200–208. doi: 10.1002/(sici)1097-0320(19990701)36:3<200::aid-cyto9>3.0.co;2-t. [DOI] [PubMed] [Google Scholar]
- 3.Vladescu I.D., McCauley M.J., Rouzina I., Williams M.C. Mapping the phase diagram of single DNA molecule force-induced melting in the presence of ethidium. Phys. Rev. Lett. 2005;95:158102. doi: 10.1103/PhysRevLett.95.158102. [DOI] [PubMed] [Google Scholar]
- 4.Husale S., Grange W., Hegner M. DNA mechanics affected by small DNA interacting ligands. Single Mol. 2002;3:91–96. [Google Scholar]
- 5.Smith S.B., Cui Y., Bustamante C. Overstretching B-DNA: the elastic response of individual double-stranded and single-stranded DNA molecules. Science. 1996;271:795–798. doi: 10.1126/science.271.5250.795. [DOI] [PubMed] [Google Scholar]
- 6.Marko J.F., Siggia E.D. Stretching DNA. Macromolecules. 1995;28:8759–8770. [Google Scholar]
- 7.Williams M.C., Rouzina I., Bloomfield V.A. Thermodynamics of DNA interactions from single molecule stretching experiments. Acc. Chem. Res. 2002;35:159–166. doi: 10.1021/ar010045k. [DOI] [PubMed] [Google Scholar]
- 8.Lee J.S., Waring M.J. Bifunctional intercalation and sequence specificity in the binding if quinomycin and Triostin antibiotics to deoxyribonucleic acid. Biochem. J. 1978;173:115–128. doi: 10.1042/bj1730115. [DOI] [PMC free article] [PubMed] [Google Scholar]
- 9.Cornish A., Fox K.R., Waring M.J. Preparation and DNA-binding properties of substituted Triostin antibiotics. Antimicrob. Agents Chemother. 1983;23:221–231. doi: 10.1128/aac.23.2.221. [DOI] [PMC free article] [PubMed] [Google Scholar]
- 10.Sischka A., Eckel R., Tönsing K., Ros R., Anselmetti D. Compact, microscope based optical tweezers system for molecular manipulation. Rev. Sci. Instrum. 2003;74:4827–4831. [Google Scholar]
- 11.Vladescu I.D., McCauley M.J., Nuñez M.E., Rouzina I., Williams M.C. Quantifying force-dependent and zero-force DNA intercalation by single-molecule stretching. Nat. Methods. 2007;4:517–522. doi: 10.1038/nmeth1044. [DOI] [PubMed] [Google Scholar]
- 12.McGhee J.D., von Hippel P.H. Theoretical aspects of DNA-protein interactions. J. Mol. Biol. 1974;86:469–583. doi: 10.1016/0022-2836(74)90031-x. [DOI] [PubMed] [Google Scholar]
- 13.Bustamante C., Chemla Y.R., Forde N.R., Izhaky D. Mechanical processes in biochemistry. Annu. Rev. Biochem. 2004;73:705–748. doi: 10.1146/annurev.biochem.72.121801.161542. [DOI] [PubMed] [Google Scholar]
- 14.Crothers D.M. Calculation of binding isotherms for heterogeneous polymers. Biopolymers. 1968;6:575–584. doi: 10.1002/bip.1968.360060411. [DOI] [PubMed] [Google Scholar]
- 15.Wang A.H.-J., Ughetto G., Quigley G.J., Hakoshima T., van der Marel G.A. The molecular structure of a DNA-Triostin A complex. Science. 1984;225:1115–1121. doi: 10.1126/science.6474168. [DOI] [PubMed] [Google Scholar]