

Abstract
It is here shown that there is a considerable system size-dependence in the area compressibility calculated from area fluctuations in lipid bilayers. This is caused by the contributions to the area fluctuations from undulations. This is also the case in experiments. At present, such a contribution, in most cases, is subtracted from the experimental values to obtain a true area compressibility. This should also be done with the simulation values. Here, this is done by extrapolating area compressibility versus system size, down to very small (zero) system size, where undulations no longer exist. The area compressibility moduli obtained from such simulations do not agree with experimental true area compressibility moduli as well as the uncorrected ones from contemporary or earlier simulations, but tend, instead, to be ∼50% too large. As a byproduct, the bending modulus can be calculated from the slope of the compressibility modulus versus system-size. The values obtained in this way for the bending modulus are then in good agreement with experiment.
Introduction
It is well known that the area compressibility modulus measured in experiments on lipid vesicles contains contributions from undulations as well as from true area changes (1–4). The reported experimental area compressibilities currently obtained are usually true ones, which have been corrected for undulations (2). Molecular dynamics simulations of lipid bilayer were originally done on small systems and for short times making the effects of undulations a negligible problem. In simulations, the area compressibility is usually calculated from projected area fluctuations and is therefore an apparent one that also contains contributions from undulations. System size dependencies of calculated area compressibility moduli has, however, been observed by Marrink and Mark (5) for a united-atom model and by den Otter and Briels (6) for a coarse-grained model. This was attributed and interpreted in terms of undulations for the coarse-grained model by den Otter (7). This problem was also studied by Imparato (8) for systems with fixed area at nonzero surface tension. In the Theory section, we show that a Helfrich-type theory (9) results in a system size-dependent difference between the true and apparent area compressibility that is due to undulations. The size of this correction depends also on the bending modulus. We show then from simulations of differently sized lipid bilayers containing dimyristoyl-phosphatidylcholine (DMPC) and dipalmitoyl-phosphatidylcholine (DPPC) that the calculated area compressibilities indeed follow the theoretically predicted systems size-dependence and that the true (bare) compressibilities can be calculated by extrapolating down to system area zero. For the smallest system sizes (256 lipids), the corrections are ∼5–10%, which is of the same order of magnitude or smaller than the statistical errors in present simulations. Since the correction to the compressibility is linear in system size, it becomes substantial and has to be considered in larger systems. The area compressibility modulus obtained in this way are ∼50% larger than experimental ones. From the variation of the undulation contribution with system size, the bending modulus can be determined. The values are in good agreement with experiment and with the values obtained from simulations using other methods (10).
Theory
The area compressibility modulus is defined as
| (1) |
where γ is the surface tension and A is the area of the system. Here we consider bilayers at surface tension zero and the area has therefore to be chosen such that the surface tension is zero. For a flat undulation-free system, we do not need to make a distinction between projected area and local area. For real systems, we have undulations. Therefore, we have two contributions to the area compressibility—one intrinsic (bare one), KAtrue, due to a change in area per lipid along the actual curved membrane surface, and another one since the projected area can change due to various degrees of undulation (buckling) of the bilayer. The projected area may change in this way without any change of the actual curved surface area. In experiments as well as simulations, apparent area compressibility is measured that includes contributions from both these effects. In experiments done on vesicles, this is usually, but not always, corrected for, and a true area compressibility is reported. The undulation correction depends on vesicle size and in that case, one may derive the area compressibility from the relative area change due to an applied surface tension, γ from the equation (1)
| (2) |
with kc being the bending modulus and c a dimensionless constant. From simulations, the compressibility modulus is usually calculated from projected area fluctuations as (in analogy with the relation between density fluctuations and volume compressibility)
| (3) |
where a = 2A/N is the area per lipid and N is the number of lipids in the bilayer and σa2 = σA2(2/N)2 is the mean-square fluctuations in the area per lipid. Alternatively, it may be calculated as a numerical derivative from Eq. 1 using the projected areas. The area compressibility thus obtained will be an apparent one that contains contributions from the true compressibility as well as from undulations. If it is assumed that undulations and area changes in the curved surface occur independently of each other, one may write
| (4) |
For an undulating surface u(x, y), the true area (A) can be expressed in terms of the projected area (A0) as
| (5) |
which gives
| (6) |
for small thermally excited undulations. This is more conveniently handled by making a Fourier decomposition of the surface
| (7) |
Then we may write the true area as
| (8) |
The amplitudes of the Fourier modes are obtained from a Helfrich-type model, which has an energy containing two quadratic terms,
| (9) |
where kc is the bending modulus and γ the surface tension. After Fourier decomposition, the energy becomes
| (10) |
Since the energy is quadratic in the amplitudes, we may invoke the equipartition theorem, which states that each Fourier mode has the average energy kBT/2. Then we get the average squared amplitudes
| (11) |
and thus, the average area
| (12) |
The sum over the q:s goes over all wave vectors that fit the periodic boundary conditions, which means with n and m being 0, ±1, ±2… except the zero mode with n = m = 0. This means that there is a low-q cutoff at , but it is also reasonable to make a high-q cutoff when the wavelengths reach the molecular dimensions. We may take this at , where a = 2A0/N is the projected area per lipid. This gives us N/2 Fourier modes. We now put γ = 0, which is the usual situation in lipid bilayers, using an integral approximation and circular cutoffs. We may calculate the sum and then obtain
| (13) |
Thus, we note that the area ratio diverges logarithmically with system size. We also note that the high-q cutoff is necessary to prevent a divergence for finite systems. (See, e.g., Safran (11) or Boal (12) for a further discussion of this.) The area ratio is, however, quite close to 1 for all realistic system sizes (using a high-q cutoff close to the molecular dimensions as suggested above). For DPPC with kc = 6.7 × 10⁻²⁰ J, we obtain 1.013 for the smallest systems (256 lipids). The ratio increases up to 1.018 for 2304 lipids, which is largest system size in our simulations. For a vesicle with 200-nm radius having approximately a million lipids, the ratio would increase to 1.038 while even a macroscopic (mm-sized) vesicle would have a ratio no larger than ∼1.1. A more general formula that is valid for nonzero surface tension could easily be derived as
| (14) |
but this area ratio is even closer to one. This equation may be used for a straightforward derivation of Eq. 2 by taking the area difference between a system at a finite surface tension and tension zero. The results show that it will be an excellent approximation to put A = A0 for most purposes. The situation is however, different for the area compressibility modulus. Then, we have to take the derivative with respect to γ first and then put γ = 0. The apparent and true area compressibilities (inverse moduli) are
| (15) |
Thus, we get from Eq. 12
| (16) |
After insertion of , we get, after some algebra (keeping in mind that A0 is a function of γ),
| (17) |
Now, it is a good approximation to put the upper limit equal to infinity. An integral approximation using a circular lower cutoff at n2 + m2 = 1 gives, then,
| (18) |
This result gives, at γ = 0 and A/A0 ≈ 1, the equation
| (19) |
obtained by den Otter (7) in a different way. The integral approximation is, however, poor for low q-values. A numerical calculation of the sum can easily be performed for γ = 0 and gives, then, a-value, which is approximately twice as large as the integral (10). This results in the following relation between the true and apparent compressibilities:
| (20) |
For a large enough nonzero γ, the integral approximation improves, and in this limit, we obtain
| (21) |
where the last term in the parentheses usually can be neglected, as applied surface tensions are much smaller than the area compressibilities. One could derive approximate equations that bridge the gap between the high γ and γ = 0 equations. Equation 20 shows that for the interesting case of zero surface tension, the true area compressibility (inverse modulus) is equal to the apparent area compressibility minus a term that is linear in system size and inversely proportional to the bending modulus squared. Equation 2 given by Evans and Rawicz (1) is different from Eq. 20, but in the limit of low surface tension the logarithm in Eq. 2 may be series-expanded, which gives our result with the constant c = 1/2.1π2 (or 1/4π2 in agreement with den Otter (7) if the integral approximation is used). These values are different from the value 1/π2 given in Evans and Rawicz (1) without derivation. The second term is the undulation contribution to the area compressibility. Thus, we may obtain the true area compressibility modulus by fitting simulations at different surface areas to a straight line and extrapolate this line to zero system size. From the slope of that straight line, we may obtain the bending modulus of the bilayer easily. This is much less cumbersome than to fit the bilayer to a surface and plot the Fourier components of its amplitude versus wave number, as done in Lindahl and Edholm (10).
Methods
Computational details
All simulations were performed using the 5.0 version of the GROMACS package (13) on a cluster of quad core machines at the Center for Parallel Computers, KTH, Stockholm, Sweden. All systems were subject to periodic boundary conditions in all directions. Separate Nosé-Hoover thermostats (14,15) for the water and the lipids were used to keep the temperature constant. DPPC was simulated at 323 K while the temperature for the DMPC systems was kept at 303 K. The pressure was fixed to 1 atm in all spatial directions using Parrinello-Rahman barostat (16,17), with angular frequency 0.1 ps−1. The integration of the equations of motion was performed by using a leapfrog algorithm with a time-step of 4 fs. Bond lengths were kept fixed using the LINCS algorithm (18) in the lipids and the analytic SETTLE algorithm for the water molecules (19). All analysis was performed on 80-ns production simulations that were preceded by equilibration, which, depending on system size, lasted for 2–10 ns. The simulations included between 256 and 2304 lipids at slightly different hydrations, but all well above 30 waters per lipid.
Force fields
The force-field parameters are described in detail by Berger et. al. (20) and do reproduce experimental quantities like area and volume per lipid (21) and order parameters (22) fairly well. A comparison of different force fields and careful reparameterization done by Chiu et al. (23) indicates, however, that further improvements can be done. United atoms were used for the CH2 and CH3 groups in the lipids, reduced the number of atoms per lipid to 46 for dimyristoyl-phosphatidylcholine (DMPC) and to 50 for dipalmitoyl-phosphatidylcholine (DPPC). Fractional atomic charges for the polar atoms were taken from ab initio quantum mechanical calculation (24). The headgroup Lennard-Jones (LJ) parameters were taken from the optimized potentials-for-liquid-simulations force field (25), while the tail parameters were those of Berger (20). The 1, 4 electrostatic interactions were reduced by a factor 2 and 1, 4 LJ interactions by a factor 8. Bond rotations in the carbon tails were modeled with Ryckaert-Bellemans dihedrals (26) and corresponding 1, 4 interactions removed. A cutoff of 1.0 nm was used for LJ interactions. The electrostatic interaction were calculated using, in real-space, out to 1.0 nm and then summed up out to infinity in Fourier space using a particle-mesh Ewald method (27,28). For the water, we have used the SPC model (29).
Error analysis
The statistical inaccuracy in the area per lipid could easily be determined by comparing subaverages over different parts of the simulation. Alternatively, we estimate it as , where σa is the standard deviation in the area per lipid, τ the correlation time of the area fluctuations, and T the total simulation time. The correlation time is then defined as the integral from zero to infinity of the normalized area correlation function:
| (22) |
It is more difficult to estimate the statistical error in the area compressibility through the area fluctuations by the subaverage method, as area fluctuations grow with the time duration of the part of the trajectory from which they are calculated. In principle, they can be calculated from the “fluctuations in the fluctuations” and their correlation time τf, which will be different from the correlation time τ above. The statistical error will then be . In this case, the area distribution is Gaussian to a good approximation as seen from Fig. 1. Then, this expression can be simplified and one obtains the statistical error in σa2 as . The correlations time τf has, however, to be estimated separately from a correlation function of the fluctuations
| (23) |
Figure 1.
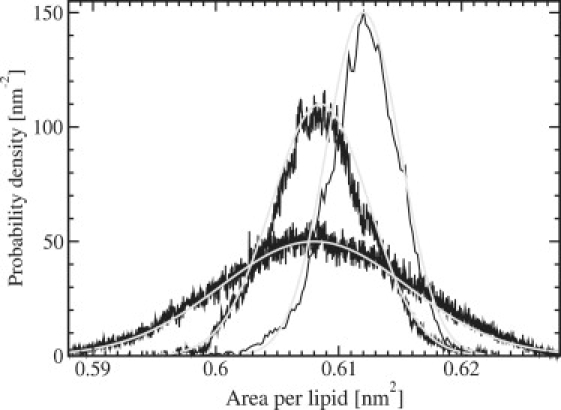
Normalized distribution of the area per lipid, together with Gaussian fits.
A detailed error analysis will be done and presented for DMPC below, assuming that similar results are valid for DPPC.
Results and Discussion
The area per lipid is a sensitive and easily calculated measure for the ordering of the lipids and may be used to validate the quality of simulations. It is calculated as a projected area from the size of the periodic simulation box. We have calculated the true area per lipid as well by using Eq. 13. Experimental data used to be quite scattered, but presently there are rather accurate data for a few lipids including DPPC and DMPC due to the work of Nagle and Tristram-Nagle (30) and Kucerka et al. (31). It is seen from Table 1 that the area per lipid for both lipids is reproduced within the experimental accuracy. However, the area might be slightly on the high side for the DMPC systems. There is no system size dependence for the area per lipid in contrast to earlier cutoff simulations (10), but in agreement with simulations using lattice summation for the electrostatics (particle-mesh Ewald) (32). The error calculated by the subaverage method is ±(0.001–0.004) with the somewhat larger number for the smaller system. This is significantly small (<0.1%). In Fig. 2, the normalized area correlation function (Eq. 22) is shown. It exhibit an average correlation time of ∼2 ns. This gives an error of ∼±(0.0005–0.002). These figures are a factor 2 smaller than those from the subaverages and do show the same type of variation with the system size.
Table 1.
Projected area per lipid (a0), true area (a), and area compressibility as calculated from simulations of lipid bilayers of different system size and from experiments
| # of lipids | DMPC |
DMPC |
DPPC |
DPPC |
DMPC |
DPPC |
|---|---|---|---|---|---|---|
| a0[nm2] | a[nm2] | a0[nm2] | a[nm2] | KA [N/m] | KA [N/m] | |
| 256 | 0.608 | 0.620 | 0.628 | 0.641 | 0.341 | 0.322 |
| 1024 | 0.608 | 0.623 | 0.626 | 0.642 | 0.318 | 0.279 |
| 2304 | 0.612 | 0.625 | 0.626 | 0.644 | 0.245 | 0.213 |
| Experimental | — | 0.606 | — | 0.630 | 0.234 | 0.231 |
Figure 2.
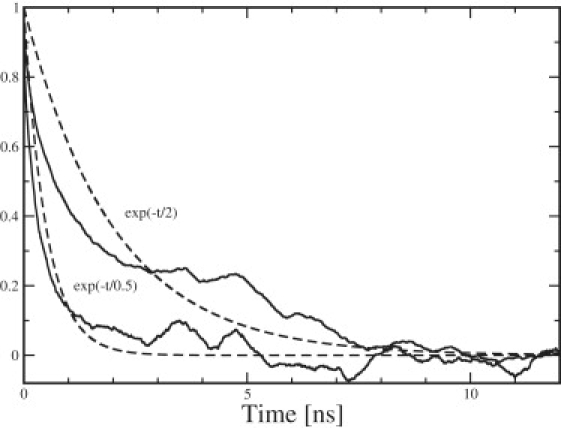
The normalized area autocorrelation function (Eq. 22) averaged over the three DMPC simulations of different size shown versus time, together with an exponential curve with 2-ns decay time (upper curves). The normalized fluctuations autocorrelation function (Eq. 23) averaged over the same three simulations versus time with an exponential curve with 0.5-ns decay time (lower curves).
The area compressibility moduli calculated from Eq. 3 (presented in Table 1) show strong system size-dependence. They are plotted for both lipids versus the total area of the system in Fig. 3. The three points corresponding to the different system sizes can, for both lipids, be fitted to straight lines in accordance with Eq. 20. From the intercept at area zero, the true area compressibility (modulus) may be determined, while the bending modulus of the membranes may be calculated from the slope of the lines.
Figure 3.
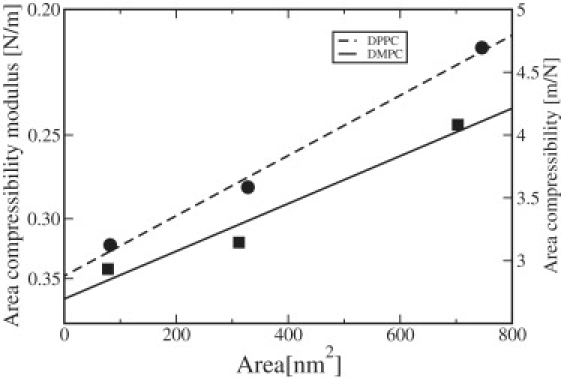
Area compressibility (inverse modulus) versus system size for DMPC and DPPC.
The accuracy of the intercept is difficult to estimate. On the one hand, the statistical accuracy estimated from subaverages of the area fluctuations indicates errors of 10–20% in the individual points. On the other hand, the three points fall fairly well on straight lines, indicating that 20% might be a too-conservative error estimate. We suggest an error of ∼10% or 0.030–0.040 N/m. In principle, there could be systematic errors as well, simply because 80 ns might be too short a time for sampling the full fluctuations. This would then result in values that were too large for the area compressibility modulus. This can be seen in older simulations that, by necessity, were shorter. Feller and Pastor (33) obtained, in this way, much smaller area fluctuations and therefore, larger compressibility moduli. To investigate this problem, we therefore calculated the area compressibility modulus from the area fluctuations of parts of the simulation having different lengths, and plotted this against time and inverse time. The correct value is then obtained by extrapolating to infinite time. It is seen from Fig. 4 that the plots form fairly straight lines that would drop another 0.020 N/m if extrapolated to inverse time-length zero, which is smaller than the statistical error. More problematic is that the curves deviate considerably from straight lines, at long times, in a nonsystematic manner. This indicates poor statistics. One way to solve this problem would be to use fluctuations during shorter time periods for which the statistics are better, and remove the systematic error by extrapolation against inverse time. We also calculated this error by the correlation method. For a simulation time of 80 ns and an average correlation time of 0.5 ns for the fluctuation autocorrelation function (Eq. 23), we get a relative error of or 11%, which gives an absolute error of ∼(0.023–0.037) N/m in the area compressibility modulus. This is similar to the experimental accuracy 0.0234 (2) for DMPC and 0.020 for DPPC (30). The situation is a bit better with the bending modulus, since the slope of the lines is inversely proportional to the square of the bending modulus, according to Eq. 20. Thus, the relative error in the bending modulus is only half of that in the slope. We estimate the final error to be <10%, which is the same order of magnitude as that of the experimental figures.
Figure 4.
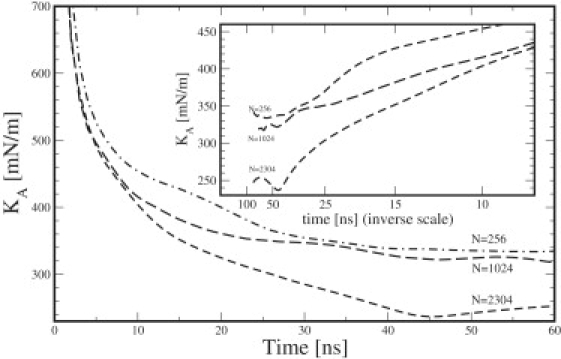
Calculated area compressibility modulus versus time and inverse time duration for different system sizes.
The final estimates of area compressibility and bending moduli are shown in Table 2 together with experimental values from the literature. In comparison with experiment and earlier simulations, we conclude that our values for the compressibility moduli are 50% larger.
Table 2.
True area compressibility moduli and bending moduli from simulations and experiments
| DMPC |
DPPC |
DMPC |
DPPC |
|
|---|---|---|---|---|
| KA [N/m] | KA [N/m] | kc [J] | kc [J] | |
| This article | 0.371 | 0.348 | 6.5 × 10⁻²⁰ | 6.1 × 10⁻²⁰ |
| Experimental | 0.234 | 0.231 | 6.9 × 10⁻²⁰ | 6.7 × 10⁻²⁰ |
For the bending moduli we obtain 6.1 × 10⁻²⁰ J for DPPC and 6.5 × 10⁻²⁰ J for DMPC, which are in fair agreement with experimental values 6.7 × 10⁻²⁰ J (34) and 6.9 × 10⁻²⁰ J (31), keeping in mind that the accuracy is ∼10% in the experimental as well as in the simulated value. Direct calculations of the bending modulus from the intensity of the Fourier modes by using Eq. 11 or its integrated form for zero surface tension,
| (24) |
performed by Lindahl and Edholm (10), gave the value 4 × 10⁻²⁰ J for DPPC from considerably shorter simulations.
In a comparison between the parameter values obtained for DMPC and DPPC, one has to keep in mind that there are three things that differ between these systems—chain length of the lipid; area per lipid; and temperature. For bending as well as area compressibility, one would expect that larger area and higher temperature would favor such motions, while longer chain length would work the opposite way. Thus, it is a delicate balance between these effects that determines the outcome.
One simple model to interpret these results is a polymer brush model, as suggested in Rawicz et al. (2). This gives a relation between the compressibility and bending moduli and the membrane hydrophobic thickness (h),
| (25) |
where h = hpp – h0, with hpp being the peak-to-peak distance in the electron density and h0 = 1 nm is double the distance between these peaks and the end of the hydrophobic core. They observe good adherence to this relation for a few saturated lipids and lipids with one double bond in the fatty acid chains. We note that the final estimates from our simulations as well as the newest experimental data (Table 2) indicate similar values in these material constants for DMPC and DPPC. The increase in directly measured hydrophobic thickness with chain length is apparent from the last two columns in Table 3. This differs from the constant thickness (first two columns of Table 3) obtained from the brush model with Eq. 25 using material constants from either simulation or experiment. We further note that the too-high area compressibility modulus from the simulations results in far too small a value for the hydrophobic thickness of both lipids.
Table 3.
Hydrophobic thickness (h[nm]) directly from simulations and experiments and from the brush model (Eq. 25)
| Brush simulations | Brush experiments | Direct simulations | Direct experiments | |
|---|---|---|---|---|
| DMPC | 2.05 | 2.65 | 2.56 | 2.54 |
| DPPC | 2.05 | 2.65 | 2.97 | 2.86 |
Summary
It has been shown that the area compressibilities calculated from our simulations exhibit a considerable system size-dependence. This is due to a difference between the projected area of the lipid bilayers and the true area that follows the undulating surface. Thus, there will be a contribution to the apparent fluctuations (the fluctuations in projected area) from undulations. This can be theoretically described within the framework of a Helfrich type of theory. The resulting equation indicates that the apparent area compressibility should increase linearly with the size of the system, and that the slope of the line is inversely proportional to the square of the bending modulus of the bilayer. This makes it possible to calculate a true area compressibility by extrapolating the straight line that describes the systems size-dependent area compressibility down to zero system-size. From the slope of the line, we may also calculate the bending modulus of the bilayer.
For DPPC and DMPC, we get similar values for both these parameters, and it is hard to judge which one is smaller or larger within the statistical accuracy of the simulations. This situation is similar to that with the experimental values, which also do not allow for a clear conclusion at this point. As for the absolute values, the bending modulus obtained is in agreement with experiment, and in agreement with the values obtained from simulations using direct methods to determine this parameter from the magnitude of the undulations.
The true area compressibilities, obtained by the method used for our simulations, are 30% smaller (corresponding to the compressibility moduli, which are 50% larger) than the corresponding experimental true area compressibilities, which were corrected in a similar manner by the experimentalists for undulation contributions. DPPC and DMPC behave very similarly.
Acknowledgments
Q.W. acknowledges support by a grant from the Higher Education Commission, Pakistan. O.E. acknowledges support by a grant from the Swedish Research Council.
References
- 1.Evans E., Rawicz W. Entropy-driven tension and bending elasticity in condensed-fluid membranes. Phys. Rev. Lett. 1990;64:2094–2097. doi: 10.1103/PhysRevLett.64.2094. [DOI] [PubMed] [Google Scholar]
- 2.Rawicz W., Olbrich K.C., Mclntosh T., Evans E. Effect of chain length and unsaturation on elasticity of lipid bilayers. Biophys. J. 2000;79:328–339. doi: 10.1016/S0006-3495(00)76295-3. [DOI] [PMC free article] [PubMed] [Google Scholar]
- 3.Fournier J.B., Ajdari A., Peliti L. Effective area elasticity and tension of micromanipulated membranes. Phys. Rev. Lett. 2001;86:4970–4973. doi: 10.1103/PhysRevLett.86.4970. [DOI] [PubMed] [Google Scholar]
- 4.Henriksen J.R., Ipsen J.H. Measurement of membrane elasticity by micropipette aspiration. Eur. Phys. J. E. 2004;14:149–167. doi: 10.1140/epje/i2003-10146-y. [DOI] [PubMed] [Google Scholar]
- 5.Marrink S.J., Mark A.E. Effect of undulations on surface tension in simulated bilayers. J. Phys. Chem. 2001;105:6122–6127. [Google Scholar]
- 6.den Otter W.K., Briels W.J. The bending rigidity of an amphiphilic bilayer from equilibrium and nonequilibrium molecular dynamics. J. Chem. Phys. 2003;118:4712–4720. [Google Scholar]
- 7.den Otter W.K. Area compressibility and buckling of amphiphilic bilayers in molecular dynamics simulations. J. Chem. Phys. 2005;123:214906. doi: 10.1063/1.2132287. [DOI] [PubMed] [Google Scholar]
- 8.Imparato A. Surface tension in bilayer membranes with fixed projected area. J. Chem. Phys. 2006;124:154714. doi: 10.1063/1.2189847. [DOI] [PubMed] [Google Scholar]
- 9.Helfrich W., Servuss R.M. Undulations, steric interaction and cohesion of fluid membranes. Il Nuovo Cimento D. 1984;3:137–151. [Google Scholar]
- 10.Lindahl E., Edholm O. Mesoscopic undulation and thickness fluctuation in lipid bilayers from molecular dynamics simulations. Biophys. J. 2000;79:426–433. doi: 10.1016/S0006-3495(00)76304-1. [DOI] [PMC free article] [PubMed] [Google Scholar]
- 11.Safran A.S. Westview Press; Boulder, CO: 2003. Statistical Thermodynamics of Surfaces, Interfaces, and Membranes. [Google Scholar]
- 12.Boal D. Cambridge University Press; Cambridge, UK: 2002. Mechanics of the Cell. [Google Scholar]
- 13.van der Spoel D., Lindahl E., Hess B., Groenhof G., Mark A.E. GROMACS: fast, flexible and free. J. Comput. Chem. 2005;26:1701–1718. doi: 10.1002/jcc.20291. [DOI] [PubMed] [Google Scholar]
- 14.Nose S. A molecular dynamic method for simulation in the canonical ensemble. Mol. Phys. 1984;52:255–268. [Google Scholar]
- 15.Hoover W.G. Canonical dynamics: equilibrium phase-space distribution. Phys. Rev. A. 1985;31:1695–1697. doi: 10.1103/physreva.31.1695. [DOI] [PubMed] [Google Scholar]
- 16.Parrinello M., Rahman A. Polymorphic transition in single crystals: a new molecular dynamic method. J. Appl. Phys. 1981;52:7182–7190. [Google Scholar]
- 17.Nose S., Klein M.L. Constant pressure molecular dynamics for molecular systems. Mol. Phys. 1983;50:1055–1076. [Google Scholar]
- 18.Hess B., Bekker H., Berendsen H.J.C., Fraaije J.G.E.M. LINCS: a linear constraint solver for molecular simulations. J. Comput. Chem. 1997;18:1463–1472. [Google Scholar]
- 19.Miyamoto S., Kollman P.A. SETTLE: an analytical version of the SHAKE and RATTLE algorithms for grid water models. J. Comput. Chem. 1992;13:952–962. [Google Scholar]
- 20.Berger O., Edholm O., Jahnig F. Molecular dynamic simulation of fluid bilayer of dipalmitoylphosphatidylcholine at full hydration, constant pressure, and constant temperature. Biophys. J. 1997;72:2002–2013. doi: 10.1016/S0006-3495(97)78845-3. [DOI] [PMC free article] [PubMed] [Google Scholar]
- 21.Weiner M.C., Nagle J.F. Structure of fully hydrated bilayer dispersions. Biochim. Biophys. Acta. 1988;942:1–10. doi: 10.1016/0005-2736(88)90268-4. [DOI] [PubMed] [Google Scholar]
- 22.Seelig A., Seelig J. The dynamic structure of fatty acyl chains in a phospholipid bilayer measured by deuterium magnetic resonance. Biochemistry. 1974;13:4839–4845. doi: 10.1021/bi00720a024. [DOI] [PubMed] [Google Scholar]
- 23.Chiu S.-W., Pandit S.A., Scott H.L., Jakobsson E. An improved united atom force field for simulation of mixed lipid bilayers. J. Phys. Chem. B. 2009;113:2748–2763. doi: 10.1021/jp807056c. [DOI] [PubMed] [Google Scholar]
- 24.Chui S.W., Clark M., Balaji V., Subramaniam S., Scott H.L. Incorporation of surface tension into molecular dynamics simulation of an interface: a fluid phase lipid bilayer membrane. Biophys. J. 1995;69:1230–1245. doi: 10.1016/S0006-3495(95)80005-6. [DOI] [PMC free article] [PubMed] [Google Scholar]
- 25.Jorgensen W., Tirado-Rives J. The OPLS potential function for proteins, energy minimization for crystals of cyclic peptides and crambin. J. Am. Chem. Soc. 1988;110:1657–1666. doi: 10.1021/ja00214a001. [DOI] [PubMed] [Google Scholar]
- 26.Ryckaert J.P., Ciccotti G., Berendsen H.J.C. Numerical integration of the Cartesian equations of motion of a system with constraints; molecular dynamics of n-alkanes. J. Comput. Phys. 1977;23:327–341. [Google Scholar]
- 27.Darden T., York D., Pedersen L. Particle mesh Ewald: an Nlog(N) method for Ewald sums in large systems. J. Chem. Phys. 1993;98:10089–10092. [Google Scholar]
- 28.Essmann U., Perera L., Berkowitz M.L., Darden T., Lee H. A smooth particle mesh Ewald method. J. Chem. Phys. 1995;103:8577–8593. [Google Scholar]
- 29.Berendsen H.J.C., Postma J.P.M., van Gunsteren W.F., Hermans J. Interaction models for water in relation to protein hydration. In: Pullman B., editor. Intermolecular Forces. D. Reidel Publishing Company; Dordrecht, The Netherlands: 1981. [Google Scholar]
- 30.Nagle J.F., Tristram-Nagle S. Structure of lipid bilayers. Biochim. Biophys. Acta. 2000;1469:159–195. doi: 10.1016/s0304-4157(00)00016-2. [DOI] [PMC free article] [PubMed] [Google Scholar]
- 31.Kucerka N., Liu Y., Petrache H.I., Tristam-Nagle S., Nagle J.F. Structure of fully hydrated fluid phase DMPC and DLPC lipid bilayers using x-ray scattering from oriented multilamellar arrays and from unilamellar vesicles. Biophys. J. 2005;88:2626–2637. doi: 10.1529/biophysj.104.056606. [DOI] [PMC free article] [PubMed] [Google Scholar]
- 32.Wohlert J., Edholm O. The range and shielding of dipole-dipole interactions in phospholipid bilayers. Biophys. J. 2004;87:2433–2445. doi: 10.1529/biophysj.104.044222. [DOI] [PMC free article] [PubMed] [Google Scholar]
- 33.Feller S.E., Pastor R.W. Constant surface tension simulations of lipid bilayers: the sensitivity of surface areas and compressibilities. J. Chem. Phys. 1999;111:1281–1287. [Google Scholar]
- 34.Guler S.D., Ghosh D.D., Pan J., Mathai J.C., Zeidel M.L. Effects of ether vs. ester linkage on lipid bilayer structure and water permeability. Chem. Phys. Lipids. 2009;160:33–44. doi: 10.1016/j.chemphyslip.2009.04.003. [DOI] [PMC free article] [PubMed] [Google Scholar]
- 35.Kucerka N., Nagle J.F., Sachs J.N., Feller S.E., Pencer J. Lipid bilayer structure determined by the simulation analysis of neutron and x-ray scattering data. Biophys. J. 2008;95:2356–2367. doi: 10.1529/biophysj.108.132662. [DOI] [PMC free article] [PubMed] [Google Scholar]