Abstract
Background: As already documented, a high prostate specific antigen in men with normal size of prostate gland is more likely to be associated with an aggressive cancer as compared to others with the same prostate specific antigen and a large gland size. In this retrospective study we tested the association between Prostate Specific Antigen Density (PSAD) and tumor aggressiveness in patients with clinically localized Prostate Cancer (PCa) surgically treated by radical prostatectomy.
Methods: We evaluated data from patients records in a cohort of 72 patients who underwent radical prostatectomy between January 2000 and June 2007. PSAD was calculated as ratio between the preoperative total prostatic specific antigen (PSA) in nanograms per milliliter with the prostate weight (PW) of prostatectomized specimen in grams or prostate volume measured with ultrasound (US). The patients were stratified into four PSAD categories: 0.1-0.15, 0.16- 0.20, 0.21-0.5 and greater than 0.51 ng/ml/gr. Parameters that were included into analysis were: PSA, measurement of the prostate volume by ultrasound (preoperatively) and prostate weight, pathological tumor stage, Gleason sum, Gleason grade, metastatic lymph nodes, seminal vesicle involvement and organ confine disease (postoperatively). Worsening of the clinicopathological properties was defined as aggressiveness.
Results: There was a significant correlation between US-PSAD and PW-PSAD (p<0.001). In US-PSAD categories the statistic tests found significant correlation with the primary tumor (R=0.303, p<0.01), metastatic lymph nodes (R=0.331, p<0.01), and the organ confine disease (R=0.296, p<0.05). The PW-PSAD categories correlated significantly with the pathologic findings from other parameters. Hence, a statistically significant correlation was found with Gleason sum (R=0.246, p<0.05), Gleason grade (R=0.234, p<0.05), primary tumor (R=0.285, p<0.05), metastatic lymph node (R=0.287, p<0.05) and organ confine disease (R=0.303, p<0.01).
Conclusions: Prostate specific antigen density measurement is useful tool for the assessment of the degree of aggressiveness in clinically localized prostate cancer, and further investigation regarding its possible use as a prediction marker is justified.
Keywords: prostate-specific antigen, prostatic cancer, aggressiveness of prostate cancer
Prostate cancer (PCa) is the most common form of cancer and the second leading cause of cancer death among US men, with an incidence of slightly less than 190,000 new cases and mortality of around 29,000 in 20081. Since 1995 the incidence has been increased by 1% annually, whereas mortality decreased by 4%2. International incidence rates vary more than 65-fold time, from a low-risk (China) to a high-risk range population in US1,3.
PSA is a glycoprotein which belongs to the kallikrein family of neutral serine proteases, weighing approximately 34 kDa4. It is a product of secretion of the prostate epithelium produced by normal, benign and cancerous cells5. Moreover, PSA is present in the seminal fluid, serum and urine6.
Flocks was the first who experimented with the anantigens in the prostate7. Thereafter, the presence of the precipitative antigens in prostate was reported by Ablin et al8. The first description of PSA referred to a prominent protein in human seminal plasma as seminoprotein9. Furthermore, Wang et al purified a tissue-specific antigen "Prostate antigen"10, which was at the beginning measured quantitatively in the blood11.
As a screening tool PSA is known predictive factor of adverse pathologic findings12 and outcome after primary treatment13,14. Normal PSA levels are defined as between 0-4.0 ng/ml15. Increased levels of PSA may suggest the presence of prostate cancer. However, prostate cancer can also be present in the complete absence of an elevated PSA level, in which case the test result would be a false negative16. PSA levels can be also elevated due to the prostate infection, irritation, benign prostatic hypertrophy (BPH), i.e. enlargement or recent ejaculation17, in which cases it may again give false positive results18.
To distinguish the condition between BPH and prostate cancer (in order to minimize unnecessary biopsies in men without cancer) and slow the fast growing cancers, various PSA markers have been used: PSA velocity, ageadjusted PSA, PSA density (PSAD) and free versus attached PSA.
The PSA density can be calculated when the PSA value in ng/ml is divided by the prostate volume measured by transrectal ultrasonography (US-PSAD), or by its weight measured from the prostatectomised specimens in grams (PW-PSAD). However, the goal should be to improve the specificity of PSA testing for prostate cancer screening, at the same time preserving its sensitivity19.
Material and Methods
Between January 2000 and June 2007, seventy nine (79) patients underwent radical retro-pubic prostatectomy for treatment of clinically localized prostate cancer, at the Department of Urology, University Hospital, Skopje. Seven cases were excluded because of insufficient data. All patients were in clinical stage of T2N0M0, in a good health condition and life expectancy of about 10 years. They had not received neoadjuvant hormonal or radiotherapy before the surgery. Parameters that were analyzed included preoperative PSA (measured before or 28 days after biopsy in Clinical laboratory with immunodiagnostic system "Vitros ECI") and measurement of prostate volume by transrectal ultrasound, and after prostatectomy measurement of the prostate weight, pathological tumor stage, Gleason sum (is a sum of the primary grade and a secondary grade of the tumor and is a number ranging from 2 to 10), Gleason grade (information determined by the pathologist who examines the biopsy specimen taken from the prostate), metastatic lymph nodes, seminal vesicle involvement and organ confine disease. Patients were stratified into four PSAD categories: 0.1-0.15; 0.16-0.20; 0.21-0.5 and greater than 0.51 ng/ml/gr.
Descriptive statistics such as frequency and cross tabulation were used for data analysis. Data from parametric variables were expressed as mean ± SD (range) and as proportion (percentage) when appropriate. Comparisons between groups were made by using x-square test, and Fisher's exact test when appropriate, while correlation between investigated parameters was assessed with the help of Spearman's rank correlation coefficient. The acceptable levels of probability for rejecting the null hypotesis in compatibility with the international biostatistical standards for "p" were <0.05. The statistical program used was SPSS for windows, version 10 (SPSS, Chicago, IL, USA).
Results
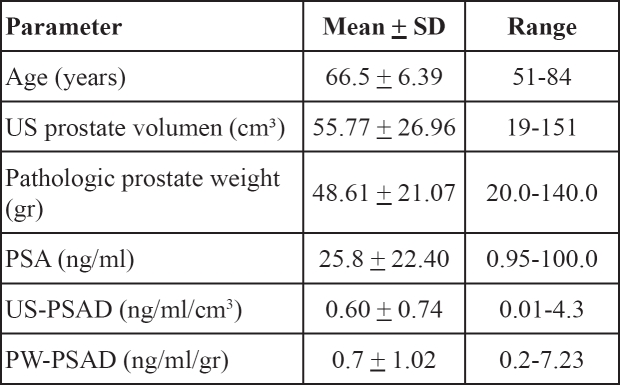
The data from 72 patients who underwent radical prostatectomy for treatment of localized prostate cancer were analysed. The patients' data and data related to prostete measurements are shown in Table 1. Pathologic data from cancer tissue of prostatectomized specimens are summarized in Table 2.
Table 1: Clinical data related to the prostate measurements in all patients (n=72).
Table 2: Pathologic and data related to the cancer tissue of prostatectomized specimen.
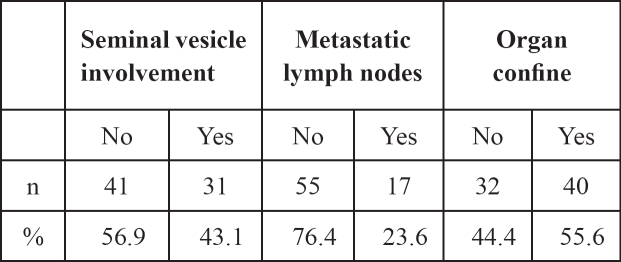
In addition, histopathologic data from the prostatectomized and lymphadenectomized specimen related to the local progression of the disease are summarized in Table 3.
Table 3: Pathologic and data related to the prostatectomized and lymphadenectomized specimen.
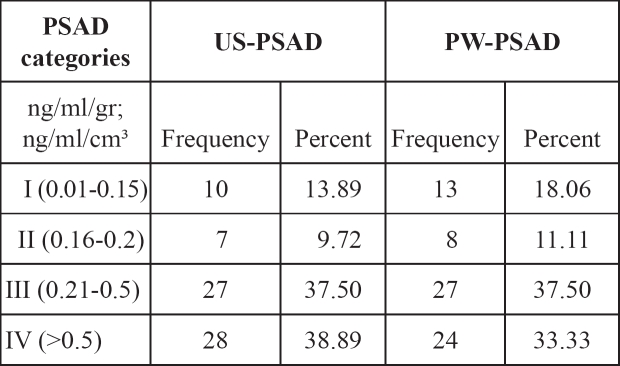
The distribution of patients in various groups according to the PSAD levels measured by ultrasound and weight of the prostate specimens after radical prostatectomy are presented in Table 4.
Table 4: The distribution of patients in categories according to PSAD levels.
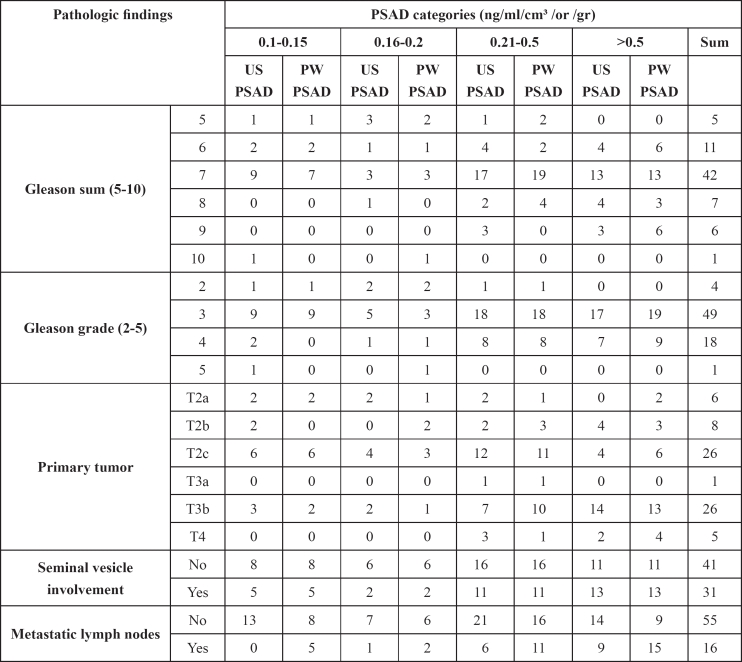
A cross tabulation between PSAD categories and Gleason sum, Gleason grade, primary tumor, vesiculoseminal involvement and metastatic lymph nodes are presented in Table 5.
Table 5: Cross tabulation between PSAD categories and pathologic results.
In addition, with the non-parametric Spearman's correlation we found highly significant association between US-PSAD and PW-PSAD (R=0.837, p<0.01); and a statistically significant correlation with primary tumor (R=0.303, p<0.01); metastatic lymph nodes (R=0.331, p<0.01); and with organ confine disease (R=0.296, p<0.05). On the other hand, there was a statistically significant association between PW-PSAD and organ confined disease (R=0.303, p<0.01); Gleason sum (R=0.246, p<0.05); Gleason grade (R=0.234, p<0.05); metastatic lymph nodes (R=0.287, p<0.05); and primary tumor (R=0.285, p<0.05). In addition, there was a significant trend of worsening the clinicopathological prognostic features associated with an increase in the prostate specific antigen density as presented in the Table 6.
Table 6: The distribution of patients in categories according to PSAD levels and organ confine disease.
In US-PSAD groups there were 10 (76.9%), 6 (75%), 16 (55.6%) and 8 (33.3%) patients with organ confined disease according to the particular PSAD strata adopted standards (I – IV), respectively.
In PW-PSAD groups there were 8 (80%), 6 (85.7%), 15 (55.5%) and 11 (39.3%) patients with organ confined disease if PSAD was found less than < 0.15, 0.16 to 0.2, 0.21 to 0.50 and greater than 0.51 ng/ml/gr, respectively (p <0.001).
Discussion
According to previous reports in the literature prostate cancer tissue releases approximately 10-fold higher PSA into serum per gram of tissue than benign prostate tissue20. With the introduction of PSA-based screening in the early 1990s the number of new cases of prostate cancer dramatically raised although the mortality from the disease was significantly reduced21.
Benson et al introduced the concept of PSAD in order to correlate PSA levels in serum with the prostate volume22. Several studies suggested that PSA density higher than 0.15 ng/ml/cm3 increases the cancer detection rate23–25. In addition, Radwan et al suggested that value of PSAD higher than 0.2 ng/ml/gr strongly correlated with the extracapsular extension of the cancer26.
The present study is among the very few others addressing the association of PSA density with the pathological features in prostatectomy specimens. Our study results suggest that an increase in PSAD, may be associated with worsening of the Gleason sum, Gleason stage, primary tumor, seminal vesicle and the lymph node involvement. We also confirmed that the value of PSAD higher than 0.2 ng/ml/gr correlated well with the extracapsular extension of the cancer.
We also conformed with the results from the study of Brassell et al. who examined patients with radical prostatectomy and reported that PSA level and PSAD predicted the adverse pathologic features27. Freedland et al examined PSAD in the preoperative and postoperative settings, as well, finding PW-PSAD as a strong predictor of adverse pathologic features and biochemical failures in patients undergoing radical prostatectomy28.
However, a serious shortcoming of our study was the lack of data about the time to progression or median time of survival of our patients. Hence, here the term "aggressiveness" was solely related to the pathological findings and not to the clinical course of the disease itself.
Conclusion
Concluding the incorporation of the PSAD into the work-up for the risk assessment might provide useful prognostic information in addition to the grade, stage and PSA level in patients with prostate cancer. Prostate specific antigen density measurements can be useful in determining the aggressiveness of the clinically localized prostate cancer, and might be used as an adjunct in predicting insignificant cancers, their outcome after local therapy and further prognosis of the patients.
The PW-PSAD is not clinically useful to predict the adverse pathologic features, since in this case the prostate has already been removed. The strong correlation between US-PSAD and PW-PSAD strongly suggests the usefulness of the US-PSAD as a prognostic tool in the treatment and follow up of the prostate cancer.
References
- 1.Joniau S, Hsu CY, Poppel H. PSA density is a stronger prognostic factor than PSA for adverse final histopathological outcomes and biochemical progression free survival in CT3a prostate cancer. Eur Urol Suppl. 2008;7:153. In http://download. journals.elsevierhealth.com/pdfs/journals/1569-9056/PIIS1569905608603267.pdf. [Google Scholar]
- 2.Ries LAG, Harkins D, Krapcho M, et al., editors. SEER Cancer Statistics Review, 1975-2003. Bethesda: National Cancer Institute; 2006. In http://seer.cancer.gov/csr/1975_2003/results_merged/sect_23_pro-state.pdf. [Google Scholar]
- 3.Matsuda T, Saika K. Comparison of time trends in prostate cancer incidence (1973-1997) in East Asia, Europe and USA, from Cancer Incidence in Five Continents, Vols IV - VIII. Jpn J Clin Oncol. 2007;37:556–557. doi: 10.1093/jjco/hym100. [DOI] [PubMed] [Google Scholar]
- 4.Wang MC, Valenzuela LA, Murphy GP, et al. Purification of a human prostate specific antigen. Invest Urol. 1979;17:159–163. [PubMed] [Google Scholar]
- 5.Sokoll LJ, Chan DW. Prostate-specific antigen. Its discovery and biochemical characteristics. Urol Clin North Am. 1997;24:253–259. doi: 10.1016/s0094-0143(05)70370-0. [DOI] [PubMed] [Google Scholar]
- 6.Steven P, Balk SP, Ko YJ, Bubley GJ. Biology of Prostate-Specific Antigen. Journal of Clinical Oncology. 2003;28:383–391. doi: 10.1200/JCO.2003.02.083. [DOI] [PubMed] [Google Scholar]
- 7.Flocks RH, Urich VC, Patel CA, et al. Studies on the antigenic properties of prostatic tissue. I. J Urol. 1960;84:134–143. doi: 10.1016/S0022-5347(17)65503-4. [DOI] [PubMed] [Google Scholar]
- 8.Ablin RJ, Soanes WA, Bronson P, Witebsky E. Precipitating antigens of the normal human prostate. J Reprod Fertil. 1970;22:573–574. doi: 10.1530/jrf.0.0220573. [DOI] [PubMed] [Google Scholar]
- 9.Hara M, Koyanagi Y, Inoue T, et al. Some physiochemical characteristics of gamma-seminoprotein, an antigenic componenspecific for human seminal plasma. Jpn J Legal Med. 1971;25:32232–32234. [PubMed] [Google Scholar]
- 10.Wang MC, Valenzuela LA, Murphy GP, et al. Purification of a human prostate specific antigen. Invest Urol. 1979;17:159–163. [PubMed] [Google Scholar]
- 11.Papsidero LD, Kuriyama M, Wang MC, et al. Prostate antigen: a marker for human prostate epithelial cells. J Natl Cancer Inst. 1981;66:37–42. [PubMed] [Google Scholar]
- 12.Partin AW, Mangold LA, Lamm DM, et al. Contemporary update of prostate cancer staging nomograms (Partin tables) for the new millennium. Urology. 2001;58:843–848. doi: 10.1016/s0090-4295(01)01441-8. [DOI] [PubMed] [Google Scholar]
- 13.Kattan MW, Wheeler TM, Scardino PT, et al. Postoperative nomogram for disease recurrence after radical prostatectomy for prostate cancer. J Clin Oncol. 1999;17:1499–1507. doi: 10.1200/JCO.1999.17.5.1499. [DOI] [PubMed] [Google Scholar]
- 14.Kattan MW, Eastham JA, Stapleton AM, et al. A preoperative nomogram for disease recurrence following radical prostatectomy for prostate cancer. J Natl Cancer Inst. 1998;90:766–771. doi: 10.1093/jnci/90.10.766. [DOI] [PubMed] [Google Scholar]
- 15.Myrtle JF. Normal levels of prostate-specific antigen (PSA) In: Catalona WJ, Coffey DS, Karr JP, editors. Clinical aspects of prostate cancer: assessment of new diagnostic and management procedures. New York: Elsevier; 1989. pp. 183–189. [Google Scholar]
- 16.Thompson I, Pauler D, Goodman P, et al. Prevalence of prostate cancer among men with a prostate-specific antigen level </ or =4.0 ng per milliliter. N Engl J Med. 2004;350:2239–2246. doi: 10.1056/NEJMoa031918. [DOI] [PubMed] [Google Scholar]
- 17.Herschman JD, Smith DS, Catalona WJ. Effect of ejaculation on serum total and free prostate-specific antigene concentrations. Urology. 1997;50:239–243. doi: 10.1016/S0090-4295(97)00209-4. [DOI] [PubMed] [Google Scholar]
- 18.American Cancer Society Can Prostate Cancer Be Found Early? Detailed Guide: Prostate Cancer. 2006.
- 19.Benson MC, Whang IS, Pantuck A, et al. Prostate specific antigen density: a means of distinguishing benign prostatic hypertrophy and prostate cancer. J Urol. 1992;147:815–816. doi: 10.1016/s0022-5347(17)37393-7. [DOI] [PubMed] [Google Scholar]
- 20.Kanahera H, Ueda H, Katsuoka Y. The efficacy of PSA density for the early detection of prostate cancer. Nippon Rinsho. 1998;56:2012. [PubMed] [Google Scholar]
- 21.Tarane RE, Chu KC, Brawley OW. Implications of stage-specific survival rates in assessing recent declines in prostate cancer mortality rates. Epidemiology. 2000;11:167–170. doi: 10.1097/00001648-200003000-00014. [DOI] [PubMed] [Google Scholar]
- 22.Benson MC, Whang IS, Olsson CA, et al. The use of prostate specific antigen density to enhance the predictive value of intermediate levels of serum prostate specific antigen. J Urol. 1992;147:817–821. doi: 10.1016/s0022-5347(17)37394-9. [DOI] [PubMed] [Google Scholar]
- 23.Presti JC, Hovey R, Carroll PR, et al. Prospective evaluation of prostate specific antigen density in the detection of nonpalpabile and stage T1c carcinoma of the prostate. J Urol. 1996;156:1685. [PubMed] [Google Scholar]
- 24.Ohori M, Wheeler TM, Dunn JK, et al. The pathological features and prognosis of prostate cancer detectable with current diagnostic tests. J Urol. 1994;152:1714. doi: 10.1016/s0022-5347(17)32369-8. [DOI] [PubMed] [Google Scholar]
- 25.Epstein JI, Sanderson H, Carter HB, et al. Utility of saturation biopsy to predict insignificant cancer at radical prostatectomy. Urology. 2005;66:356. doi: 10.1016/j.urology.2005.03.002. [DOI] [PubMed] [Google Scholar]
- 26.Radwan MH, Yan Y, Luly JR, et al. Prostate-specific antigen density predicts adverse pathology and increased risk of biochemical failure. Urology. 2007;69:1121–1127. doi: 10.1016/j.urology.2007.01.087. [DOI] [PubMed] [Google Scholar]
- 27.Brassell SA, Kao TC, Sun L, et al. Prostate-specific antigen versus prostate-specific antigen density as predictor of tumor volume, margin status, pathologic stage, and biochemical recurrence of prostate cancer. Urology. 2005;66:1229–1233. doi: 10.1016/j.urology.2005.06.106. [DOI] [PubMed] [Google Scholar]
- 28.Freedland SJ, Wieder JA, Jack GS, et al. Improved risk stratification for biochemical recurrence after radical prostatectomy using a novel risk group system based on prostate specific antigen density and biopsy Gleason score. J Urol. 2002;168:110–115. [PubMed] [Google Scholar]


