

Abstract
p66Shc is shown to negatively regulate the life span in mice through reactive oxygen species (ROS) production. Recent reports, however, revealed that p66Shc protein level is significantly elevated in several human cancer tissues and growth-stimulated carcinoma cells, suggesting a mitogenic and carcinogenic role for p66Shc. In this communication, we demonstrate for the first time that p66Shc mediates androgenic growth signals in androgen-sensitive human prostate cancer cells through mitochondrial ROS production. Growth stimulation of prostate cancer cells with 5α-dihydrotestosterone (DHT) is accompanied by increased p66Shc level and ROS production, which is abolished by antioxidant treatments. However, antioxidant treatments do not affect the transcriptional activity of androgen receptor (AR) as observed by its inability to block DHT-induced prostate-specific antigen expression, an AR-dependent correlate of prostate cancer progression. Elevated expression of p66Shc by cDNA transfection increases the basal cell proliferation and, thus, reduces additional DHT-induced cell proliferation. Furthermore, DHT increases the translocation of p66Shc into mitochondria and its interaction with cytochrome c. Conversely, both redox-negative p66Shc mutant (W134F), which is deficient in cytochrome c interaction, and p66Shc small interfering RNA decrease DHT-induced cell proliferation. These results collectively reveal a novel role for p66Shc–ROS pathway in androgen-induced prostate cancer cell proliferation and, thus, may play a role in early prostate carcinogenesis.
Keywords: p66Shc, prostate cancer, DHT, reactive oxygen species
Introduction
Shc (Src homolog and collagen homolog) proteins are widely known to serve as adapter proteins in receptor protein tyrosine kinase signaling (Ravichandran, 2001). The three isoforms, namely p66Shc, p52Shc and p46Shc, contain overlapping amino-acid sequences that contribute to the SH2 domain at the C terminus and the phosphotyrosine-binding domain at the N terminus, separated by a CH1 domain (Ravichandran, 2001). p66Shc has an additional CH2 domain at its N terminus (Migliaccio et al., 1999). Upon tyrosine phosphorylation, the SH2 domain of Shc protein binds to Grb2 to mediate SOS-associated Ras activation (Ravichandran, 2001). The phosphotyrosine-binding domain binds to the phosphorylated tyrosine residues in receptor protein tyrosine kinases and functions in a manner similar to SH2 domain. The CH1 and CH2 domains are putative SH3-binding regions (Lotti et al., 1996).
p66Shc is expressed predominantly in the epithelial cells, although p52Shc and p46Shc isoforms are ubiquitously expressed. Whereas p46Shc and a fraction of p66Shc localize to mitochondria (Orsini et al., 2004; Ventura et al., 2004; Nemoto et al., 2006), p52Shc is translocated to the plasma membrane from cytosol upon epidermal growth factor treatment (Migliaccio et al., 1997). Shc isoforms, in general, are regulated by tyrosine phosphorylation that transduce receptor protein tyrosine kinase signaling to downstream kinases, such as mitogen-activated protein kinases, and concomitantly mediate cell proliferation (Ravichandran, 2001). p66Shc is also phosphorylated at serine 36 in CH2 domain in response to proapoptotic stress stimuli, such as hydrogen peroxide (H2O2), UV and Taxol (Migliaccio et al., 1999; Yang and Horowitz, 2000).
The presence of the unique CH2 domain in p66Shc imparts functional divergence to the protein. For example, unlike p52Shc, overexpression of p66Shc does not transform NIH3T3 mouse fibroblast cells (Migliaccio et al., 1997) and may negatively regulate epidermal growth factor-induced mitogen-activated protein kinase activation and c-myc promoter activity (Migliaccio et al., 1997; Okada et al., 1997). In addition, p66Shc governs reactive oxygen species (ROS) signaling and acts as a negative regulator of T-cell proliferation and survival (Migliaccio et al., 1999; Pacini et al., 2004; Giorgio et al., 2005; Khanday et al., 2006). In particular, p66Shc increases the intracellular oxidant levels by activating the mitochondrial electron transfer and H2O2 production and/or by altering the mitochondrial metabolism in mouse embryo fibroblasts cells (Giorgio et al., 2005; Nemoto et al., 2006). Alternatively, p66Shc may regulate ROS production through SOS1-mediated Rac1 activation in these cells (Khanday et al., 2006). Interestingly, p66Shc has been proposed as one of the lifespan determinants by virtue of its apoptotic signaling in mouse models (Migliaccio et al., 1999), although its association with human longevity remains to be established (Pandolfi et al., 2005).
Despite the fact that many studies imply p66Shc as a mediator of apoptosis, recent studies also associate p66Shc with human epithelial cell proliferation and carcinogenesis. For example, in ovarian carcinoma cell lines, p66Shc level positively correlates with ErbB-2 expression (Xie and Hung, 1996). In breast cancer, p66Shc protein level is increased in cell lines with higher metastatic ability and is elevated in lymph node-positive tumors (Jackson et al., 2000). However, a negative correlation between p66Shc and tumorigenicity in breast cancer tissues has been reported recently, and further studies are thus required to define its role in breast carcinogenesis (Stevenson and Frackelton, 1998; Davol et al., 2003). Prostate carcinoma tissues display higher p66Shc protein levels in the cancerous cells than the adjacent non-cancerous cells (Lee et al., 2004a). In prostate cancer cell lines, p66Shc protein level positively correlates with their growth rates (Lee et al., 2004a; Veeramani et al., 2005). Importantly, growth stimulation of prostate, testis and breast cancer cell lines with steroid hormones is accompanied by an increase in p66Shc protein level (Lee et al., 2004a), implying its function in steroid-induced proliferation. Thus, the biological outcome of p66Shc signaling might be diverse in different cell types.
Reactive oxygen species mediates different biological functions, including cell proliferation, apoptosis, cell adhesion and migration. Studies in archival prostate cancer specimens display a higher level of ROS in cancerous cells than the non-cancerous cells (Lim et al., 2005). In parallel, highly tumorigenic sublines of LNCaP cells, C4-2 and C4-2B cells, have higher levels of intracellular H2O2 than their parental cells (Lim et al., 2005). Additionally, antioxidant supplements may reduce prostate cancer rates and large clinical trials using selenium and vitamin E, such as SELECT, are currently being conducted (Klein et al., 2001). Thus, the role of ROS in prostate cancer growth and progression deserves attention. In this paper, we report for the first time that p66Shc mediates androgenic proliferation signals, but not prostate-specific antigen (PSA) expression or secretion, in androgen receptor (AR)-positive prostate cancer cells through ROS production. Our data together may suggest a functional role for p66Shc in androgen-induced prostate carcinogenesis.
Results
Androgen requires ROS production for growth stimulation of prostate cancer cells
To investigate whether androgen-induced ROS production is required for androgen-stimulated prostate cancer cell proliferation, we treated androgen-sensitive LNCaP prostate cancer cells with 10 nM 5α-dihydrotestosterone (DHT) in the presence or absence of antioxidants, N-acetyl cysteine (NAC) and vitamin E succinate (VES). In the absence of antioxidants, DHT stimulated cell growth by approximately 40–50% after 48 h of treatment; as NAC significantly abolished DHT-induced cell proliferation in a dose-dependent manner (r = −0.988; P<0.05; Figure 1a). Correspondingly, DHT-induced increase in Cyclin D1 level, a key regulator of cell cycle progression, was blocked by NAC (Figure 1b, lanes 5 vs 6, 7 and 8). The inhibition of cell proliferation was further confirmed by bromodeoxyuridine assay that NAC treatment significantly reduced DHT-induced DNA biosynthesis in LNCaP cells (P<0.01; Figure 1c). Similarly, treatment with VES significantly decreased DHT-induced LNCaP cell proliferation (P<0.01; Figure 1d). Parallel observations were obtained with MDA PCa2b cells that DHT-induced growth stimulation was significantly abolished by VES (P<0.01; Figure 1e) and NAC (data not shown). Collectively, these data suggested that ROS production is required for DHT-induced prostate cancer cell proliferation.
Figure 1.
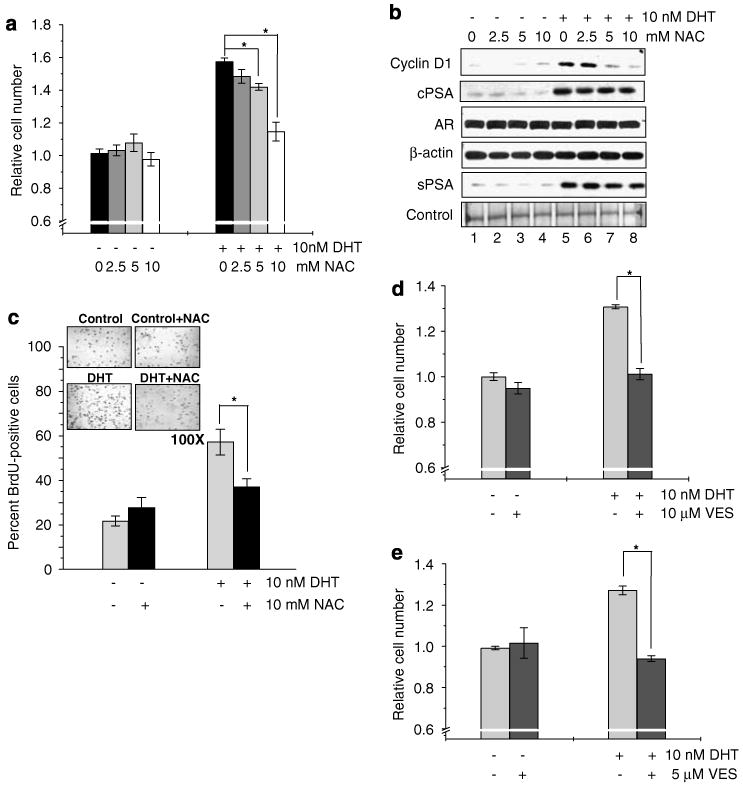
Requirement of reactive oxygen species (ROS) production in dihydrotestosterone (DHT)-induced prostate cancer cell proliferation. (a) LNCaP cells were plated at a density of 1 × 10⁴ cells per cm2 in regular medium. Seventy-two hours later, cells were steroid starved using steroid-reduced medium for 48 h. Cells were then treated with 10 nM DHT in the presence or absence of different doses of N-acetyl cysteine (NAC) (0–10mM) for 48 h. Cell growth was determined by cell counting (*P<0.01; r = −0.988, P<0.05). (b) Immunoblot analysis of Cyclin D1, androgen receptor (AR), prostate-specific antigen (PSA) levels in cell lysates (cPSA) and secreted PSA in condition medium (sPSA) was performed in DHT-treated LNCaP cells in the presence or absence of NAC (0–10 mM). (c) DHT-treated LNCaP cells in the presence or absence of 10mM NAC were immunostained for bromodeoxyuridine (BrdU) incorporation, which showed inhibition of DHT-induced BrdU incorporation by antioxidant (*P<0.01). (d) LNCaP cell growth induced by 10 nM DHT was abolished by 10 μM vitamin E succinate (VES), another antioxidant (*P<0.01). (e) MDA PCa2b cells were plated at a density of 4 × 10⁴ cells per cm2 and were allowed to attach for 3 days. Cells were then starved with steroid-reduced medium, as mentioned in the Methods section, for 48 h. Cells were treated with DHT in the presence or absence of VES (10 μM) and cell growth was measured by cell counting after 72 h (*P<0.01).
Consistent with our hypothesis that ROS can mediate cell proliferation, treatment of LNCaP cells with 10 μM H2O2, a physiologically achievable concentration, increased cell proliferation (Figure 2a) and Cyclin D1 protein levels (Figure 2b, lanes 1 vs 3, 4 and 5) similar to that of 10 nM DHT following a dose-response over a period of 48 h treatment. Furthermore, H2O2-induced cell proliferation showed a time-dependent increase (data not shown). Moreover, overexpression of Mn-superoxide dismutase (Mn-SOD), a mitochondrial enzyme that converts superoxide to H2O2, upregulated proliferation and Cyclin D1 level in LNCaP cells, similar to 10 nM DHT (Figures 2c and d, lanes 1 vs 3). Taken together, the data highlighted the role of ROS in growth stimulation by DHT in prostate cancer cells.
Figure 2.

Stimulation of proliferation of prostate cancer cells by increased intracellular reactive oxygen species (ROS) levels. (a) LNCaP cells plated at a density of 1 × 10⁴ cells per cm2 were steroid starved for 48 h and, later, were treated with different doses of H2O2 (0–20 μm) or 10 nM dihydrotestosterone (DHT) for 48 h. Cell growth was determined by cell counting (*P<0.05; **P<0.01). (b) Immunoblot analysis was performed for Cyclin D1, androgen receptor (AR), prostate-specific antigen (PSA) levels in cell lysates (cPSA) and secreted PSA levels in conditioned medium (sPSA) in LNCaP cells treated with different doses of H2O2 (0–20 μM) or 10 nM DHT. (c) LNCaP cells were plated at a density of 1 × 10⁴ cells per cm2 for 48 h and transfected with superoxide dismutase (SOD) cDNA. Control cells were transfected with empty vector. Cells were steroid starved for 48 h and then were treated with ethanol or 10 nM DHT. Cells were counted 48 h post-treatment (*P<0.05). (d) Immunoblot analysis was performed in SOD-overexpressed LNCaP cells for Cyclin D1 and PSA levels in cell lysates.
Interestingly, ROS did not have any appreciable effect on the expression and secretion of PSA. As shown in Figure 1b, treatment with NAC neither blocked DHT-induced increase in cellular PSA nor its secretion. Similarly, neither H2O2 treatment nor MnSOD overexpression in LNCaP cells had any stimulatory effect on PSA expression and secretion (Figures 2b and d). Furthermore, none of these agents had any detectable effect on AR protein level in those treated cells (Figures 1b and 2b). As PSA expression and secretion are dependent on AR transcriptional activity, the data signified the specificity of ROS in activating DHT-induced cell proliferation, but not AR-dependent gene expression.
p66Shc regulates DHT-induced proliferation in prostate cancer cells
Previous studies indicated that p66Shc, which increases intracellular ROS levels, is elevated in DHT-treated prostate cancer cells (Lee et al., 2004a; Giorgio et al., 2005; Veeramani et al., 2005; Khanday et al., 2006). In parallel, kinetic analyses revealed that p66Shc protein levels in DHT-treated cells are higher than control cells (Figure 3a). Furthermore, semiquantitative analyses of the blots indicated a significantly higher level of p66Shc protein from 8 h of DHT treatment (P<0.05) (Supplementary Figure 1) prior to increase in ROS production (16 h), as indicated by an dichlorofluorescein diacetate (DCF-DA) fluorescence (Figure 3b), and the stimulation of cell proliferation, as indicated by the increase in Cyclin D1 level (24 h) (Figure 3a), the percentage of cells at S-phase (24 h) (Figure 3c) and cell number (48 h) (Figure 3d).
Figure 3.

Elevation of p66Shc prior to reactive oxygen species (ROS) production and cell growth induction in dihydrotestosterone (DHT)-treated LNCaP cells. LNCaP cells were plated and steroid starved for 48 h. Cells were then treated with 10 nM DHT and control cells were treated with equal volume of ethanol. Cells were harvested at specific time periods and were analysed for (a) Shc isoforms, Cyclin D1 and secreted prostate-specific antigen (sPSA) protein levels by immunoblotting, (b) ROS production using DCF-DA analysis (*P<0.05), (c) cell cycle analysis (*P<0.01) by flow cytometry and (d) cell growth analysis (*P<0.01) by cell counting.
The role of p66Shc in androgen-stimulated cell proliferation was further evaluated by the elevated expression of p66Shc through wild-type cDNA transfection in LNCaP cells. Transient transfection of p66Shc cDNA alone led to a significant upregulation of cell proliferation (P<0.01; Figure 4a) and Cyclin D1 expression (Figure 4b, lanes 1 vs 3) equivalent to that of DHT treatment, whereas the addition of DHT to these cells did not have a significant added effect on their proliferation (P>0.05). In addition, stable subclones of LNCaP cells with elevated expression of p66Shc (S-32 and S-36) showed increased cell proliferation (Figure 4c) and Cyclin D1 protein levels (Figure 4d, lanes 1 vs 2 and 3) as compared to the vector-alone transfected control cells (V-1). Similarly, increased expression of p66Shc increased MDA PCa2b cell proliferation (Figure 4e).
Figure 4.

Stimulation of cell proliferation by overexpression of p66Shc in prostate cancer cells. (a) LNCaP cells were plated at a cell density of 1 × 10⁴ cells per cm2 for 48 h and then transfected with p66Shc wild-type cDNA. Control cells were transfected with empty vector. Transfected cells were starved for 48 h and then treated with ethanol or 10 nM dihydrotestosterone (DHT) for 48 h. Cell growth was analysed by cell counting (*P<0.01). (b) Immunoblot analysis was performed for Cyclin D1 protein levels in p66Shc-overexpressed LNCaP cells (lanes 3 and 4) and vector-alone transfected control cells (lanes 1 and 2), in the presence or absence of DHT. (c) LNCaP cells stably transfected with p66Shc cDNA (S-32 and S-36) and with vector-alone cells (V-1) were plated at a density of 8 × 10³ cells per cm2 in regular medium for 3 days. Cells were steroid starved for 48 h and then replenished with steroid-reduced medium. One set of the cells were trypsinized and counted 3 days later. The other set of cells were fed with fresh steroid-reduced medium and trypsinized at day 6 (*P<0.05). (d) Immunoblot analysis was performed for Cyclin D1 and p66Shc levels in p66Shc stable subclone cells that were harvested at day 3 of cell growth experiment. (e) MDA PCa2b cells were plated at a cell density of 4 × 10⁴ cells per cm2 for 48 h and were transfected with p66Shc wild-type cDNA or empty vector. Cells were steroid starved for 48 h and then treated with 10 nM DHT. Cell growth was analysed 72 h after DHT treatment by cell counting (*P<0.05).
p66Shc regulates ROS generation in prostate cancer cells
To determine whether p66Shc induces cell proliferation through ROS production, we measured the intracellular ROS levels in cells with elevated expression of p66Shc. As shown in Figure 5a, elevated expression of p66Shc by transient transfection significantly increased the intracellular ROS level, similar to DHT treatment in LNCaP cells. Treatment of these p66Shc cDNA-transfected LNCaP cells with antioxidants, NAC and VES, decreased their proliferation (Figure 5b). In addition, ectopic expression of glutathione peroxidase 1, an antioxidant mitochondrial enzyme, in p66Shc stable subclone cells significantly decreased their rapid growth (Figure 5c). These data together indicated the requirement of ROS production in p66Shc-stimulated cell proliferation in prostate cancer cells.
Figure 5.

Generation of reactive oxygen species (ROS) in p66Shc overexpressed prostate cancer cells. (a) LNCaP cells were plated at a density of 1 × 10⁴ cells per cm2 and co-transfected with p66Shc cDNA and enhanced cyan fluorescent protein (ECFP) cDNA. Control cells were transfected with empty vector and ECFP cDNA. After 48 h of steroid starvation, cells were treated with 10 nM dihydrotestosterone (DHT) or ethanol. DCF-DA assay was performed with 20 μM of DCF-DA in dimethyl sulfoxide for 15 min. Green DCF-DA fluorescence was measured in ECFP-positive cells by flow cytometry (*P<0.05). (b) LNCaP cells were transiently transfected as above and were steroid starved for 48 h. Cells were then treated with 10 mM N-acetyl cysteine (NAC) or 10 μM vitamin E succinate (VES) for additional 48 h and cell growth was measured (*P<0.05). (c) LNCaP cells stably transfected with p66Shc cDNA (S-32 and S-36) and with vector-alone cells (V-1) were plated at a density of 1 × 10⁴ cells per cm2 and were transfected with different amounts of cDNA encoding glutathione peroxidase 1 (pGPx1). Cells were then steroid starved for 48 h and then replenished with steroid-reduced medium. Forty-eight hours later cells were trypsinized and counted (*P<0.05, **P<0.01).
DHT promotes the interaction between p66Shc and cytochrome c, a mitochondrial protein
In mouse embryonic fibroblast cells, a fraction of p66Shc protein localizes to mitochondria and interacts with cytochrome c (Cyt c) in the electron transport chain to generate ROS (Orsini et al., 2004; Giorgio et al., 2005; Nemoto et al., 2006). Our data revealed that DHT increased the translocation of p66Shc into mitochondria of LNCaP cells by 16 h after DHT treatment (Figure 6a, lanes 6 vs 7), which correlates with the increase in ROS production (Figure 3b). Interestingly, even though the total p66Shc protein level in the total lysate was elevated by 8 h, the mitochondrial translocation did not occur at 8 h (Figure 6a, lanes 2 vs 3). Co-immunoprecipitation analysis by using anti-Myc antibody to pull-down overexpressed Myc-tagged p66Shc revealed that DHT increased the interaction between exogenous p66Shc and Cyt c in LNCaP cells at 16 h time point (Figure 6b, upper panel, lanes 7 vs 8). Similarly, DHT increased the interaction between Cyt c and endogenous p66Shc protein as shown in Cyt c pull-down assay (Figure 6b, lower panel, lanes 5 vs 6).
Figure 6.
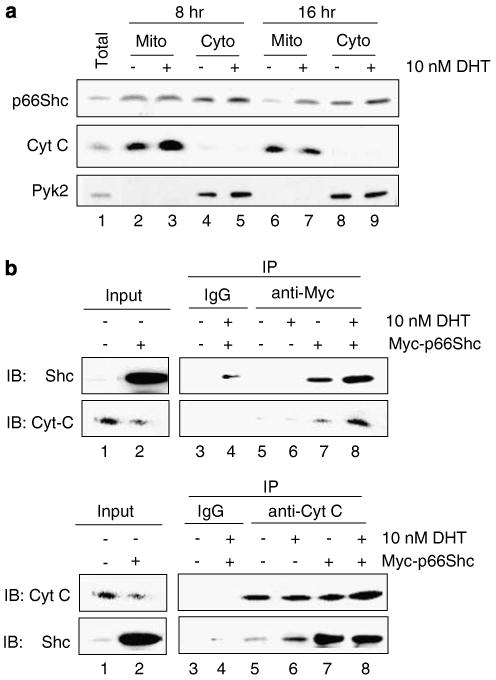
Translocation of p66Shc into mitochondria and its interaction with cytochrome c (Cyt c) in dihydrotestosterone (DHT)-treated LNCaP cells. (a) LNCaP cells were treated with 10 nM DHT and were subfractionated after 8 and 16 h after treatment as described (Giorgio et al., 2005). Total cell lysate (total) and the subfractionated mitochondrial (Mito) and cytosolic (Cyto) fractions were analysed by immunoblotting for p66Shc compartmentalization. Cyt c was used as a mitochondria-specific marker and Pyk2, a cytoplasmic tyrosine kinase, was used a cytosol-specific marker. (b) LNCaP cells were transiently transfected with Myc-tagged p66Shc wild-type cDNA or empty vector and steroid starved for 48 h. Cells were the treated with 10 nM DHT for 16 h. Co-immunoprecipitation assay was performed with anti-Myc antibody (as mentioned in the Materials and methods section) to analyse the interaction between Cyt c and exogenous p66Shc. Interaction was compared between p66Shc-overexpressed cells, which express both endogenous and exogenous p66Shc, in the presence or absence of DHT (upper panel, lanes 7 vs 8). To analyse the endogenous protein interaction, anti-Cyt c antibody was used to pull-down Cyt c and the membrane was probed was anti-Shc antibody. Interaction was compared between empty vector-transfected cells with or without DHT, which express only endogenous p66Shc (lower panel, lanes 5 vs 6).
To further establish the requirement of ROS production through p66Shc–Cyt c interaction in DHT-induced cell proliferation, we ectopically expressed a mutant p66Shc (W134F), which lacks the ability to interact with Cyt c (Giorgio et al., 2005), in LNCaP cells in the presence or absence of DHT. Cells that were transfected with the wild-type p66Shc or empty vector in the presence or absence of DHT served as controls. DCF-DA analyses showed that only the wild-type p66Shc, but not its redox-negative mutant, increased the ROS production (data not shown). Unlike the wild-type p66Shc, the W134F mutant did not increase the basal level of cell proliferation (Figure 7a). Interestingly, the W134F mutant significantly abolished DHT-stimulated cell proliferation in these cells (Figure 7a). In parallel, DHT treatment and wild-type p66Shc transfection increased Cyclin D1 level, whereas W134F mutant blocked the DHT-induced increase in Cyclin D1 expression (Figure 7b, lanes 2, 4 vs 6). Similar results were also observed in MDA PCa2b cells that DHT-induced cell proliferation was significantly blocked by W134F mutant of p66Shc (Figure 7c).
Figure 7.

Requirement of reactive oxygen species (ROS) production by p66Shc in dihydrotestosterone (DHT)-induced LNCaP cell proliferation. (a) LNCaP cells were transfected with wild-type p66Shc cDNA (WT) or W134F mutant or empty vector alone (pcDNA). Cells were steroid starved for 48 h and treated with 10 nM DHT as described above. Cells were trypsinized and counted after 48 h of treatment (*P<0.05). (b) Immunoblot analysis was performed for Cyclin D1 level in LNCaP cells transiently overexpressing WT or W134F mutant in the presence or absence of DHT, as mentioned above. (c) MDA PCa2b cells were plated at 4 × 10⁴ cells per cm2 and transiently transfected WT and W134F mutant of p66Shc and treated with DHT, as mentioned earlier. Seventy-two hours after DHT treatment cells were trypsinized and counted (*P<0.05). (d) Small interfering RNA (siRNA) fragments specific to p66Shc cloned in pSUPER vector (pSUP-p66) was transiently transfected into LNCaP cells as per the conditions mentioned for cDNA transfection. Cells were treated with DHT for 48 h and cell growth was measured (*P<0.01). (e) Immunoblot analysis was performed for Cyclin D1 levels in LNCaP cells transiently transfected with p66Shc-specific siRNA (pSUP-p66).
To further validate the requirement of p66Shc in DHT-stimulated cell proliferation, we analysed the proliferation of p66Shc knocked-down LNCaP cells in response to DHT. Notably, DHT-induced cell proliferation and Cyclin D1 level were significantly decreased in p66Shc knocked-down LNCaP cells as compared to the control cells (P<0.01; Figures 7d and e, lanes 3 vs 4). Furthermore, ectopic expression of WT p66Shc into endogenous p66Shc-knocked-down cells restored their increased basal cell proliferation and ROS production similar to that of DHT treatment; whereas ectopic expression of W134F in these cells failed to significantly increase basal as well as DHT-induced cell proliferation and ROS production (Supplementary Figure 2). Taken together, these data indicated that DHT upregulates ROS production by increasing the interaction of p66Shc with Cyt c that leads to increased prostate cancer cell proliferation.
Discussion
Androgens trigger diverse biological effects in various cells, including cell proliferation and differentiation, through differential molecular signals that require further elucidation. In androgen-sensitive prostate cancer cells, activated AR upregulates cell proliferation and gene expression, such as PSA, an indicator for AR transcriptional activity and a surrogate marker for clinical cancer progression. In this communication, we describe a novel redox pathway by which AR specifically activates cell proliferation, distinct from PSA expression and secretion. Our data clearly show that androgenic treatment of androgen-sensitive prostate cancer cells leads to increased ROS production, which in turn stimulates cell proliferation (Figures 1 and 3). Evidently, antioxidants abolish DHT-induced cell proliferation (Figure 1). However, treatment with antioxidants does not affect DHT-induced PSA expression and secretion, indicating that AR transcriptional activity does not require DHT-induced ROS (Figure 1b). Interestingly, DHT-induced cell proliferation requires the redox activity of p66Shc. For example, overexpression of redox-negative p66Shc mutant (W134F) or knockdown of endogenous p66Shc abolishes DHT-induced proliferation (Figure 7). Nevertheless, knockdown of p66Shc does not affect the ability of DHT-AR to increase PSA level (data not shown). To the best of our knowledge, this is the first report that p66Shc–ROS pathway mediates early androgenic cell proliferation in androgen-sensitive prostate cancer cells, which is independent of AR-dependent gene expression, such as PSA.
Data obtained from this study, thus, provide a molecular explanation for the clinical observations on increased p66Shc and ROS production in archival prostate cancer specimens (Lee et al., 2004a; Lim et al., 2005). In parallel, increased levels of H2O2-producing enzymes, such as Nox1 and SOD, are also noticed in prostate cancer specimens (Kuruma et al., 2005; Lim et al., 2005). These observations signify the possible role of redox signaling in prostate cancer progression. Furthermore, the promotion of prostate cancer cell proliferation by p66Shc–ROS pathway, but not PSA secretion, could explain an important clinical phenomenon observed in a subgroup of prostate cancer patients who do not show elevated PSA levels. Present data further explore a novel mechanism by which steroid hormones contribute to higher ROS levels in prostate cancer cells. As evidenced, p66Shc protein level is increased in DHT-treated prostate cancer cells (Figure 3; Lee et al., 2004a; Veeramani et al., 2005). Our kinetic analysis indicated a causal relationship between p66Shc and ROS production as well as cell proliferation during DHT action in prostate cancer cells (Figure 3). AR is apparently required for DHT effect on p66Shc because Casodex, an antiandrogen, abolished the upregulatory effect of DHT on p66Shc (Lee et al., 2004a). Interestingly, our immunoblot data revealed that the observed increase in p66Shc levels in DHT-treated cells at any given time point is, in part, due to the rapid decline of p66Shc levels in control cells (Figure 3a). Thus, it is apparent that p66Shc protein is degraded over time during androgen deprivation in prostate cancer cells, whereas its stability is increased in DHT-treated cells.
Previous studies indicated that p53 increases p66Shc protein stability in mouse embryonic fibroblast cells (Trinei et al., 2002). However, our study showed that DHT treatment did not increase p53 protein levels (Supplementary Figure 3); whereas DHT increased p66Shc protein levels (Figure 3a). Furthermore, p53 is a tumor suppressor and is either downregulated or mutated in various cancers (Bourdon, 2007), whereas p66Shc protein level is elevated in several cancers, including prostate cancer (Lee et al., 2004a; Park et al., 2005; Grossman et al., 2007). These data together imply that DHT–AR complex might affect the stability of p66Shc protein in DHT-treated cells in a p53-independent manner. Further studies are required on the role of AR in p66Shc protein stability.
p66Shc was initially reported as a proapoptotic molecule, as shown in mouse embryo fibroblasts (Migliaccio et al., 1999; Giorgio et al., 2005; Khanday et al., 2006). However, several lines of evidence suggest that p66Shc might mediate growth signals in epithelial cells and carcinomas (Xie and Hung; 1996; Lee et al., 2004a; Park et al., 2005; Veeramani et al., 2005; Grossman et al., 2007). In our study, elevated expression of p66Shc in androgen-sensitive prostate cancer cells did not induce significant cell death as clearly evidenced by cell counting (Figure 4), intracellular proapoptotic Bax protein levels and subG1 DNA content (Veeramani S and Lin MF, unpublished observations). Thus, further studies are needed to determine whether the physical interaction between p66Shc and Cyt c might hamper apoptotic signaling by preventing Cyt c from leaking into cytoplasm in epithelial cells. Altogether, these observations imply that p66Shc is at the crossroads of proapoptotic and proliferative signal pathways and transduces divergent signals in different cell types that result in distinct biological outcomes.
Even though p66Shc protein does not contain a putative mitochondrial targeting sequence, about 10% of total cellular p66Shc localizes in mitochondrial inner membrane, where it regulates ROS production, through its interaction with Cyt c (Giorgio et al., 2005). Our data reveal that DHT increases the mitochondrial translocation of p66Shc (Figure 6a) and its subsequent interaction with Cyt c to produce ROS (Figure 6b). Furthermore, kinetic analysis on the mitochondrial translocation of p66Shc indicated that although the p66Shc total protein level is significantly elevated at 8 h after DHT treatment, mitochondrial translocation occurs only at 16 h, the subsequent time point analysed (Figures 3a and 6a), which coincides with the increase in Cyt c interaction and ROS production (Figures 3b and 6b). Importantly, W134F mutant, which lacks Cyt c-binding and ROS generating ability, abolishes DHT-induced cell proliferation (Figures 7a and c). These data signify the role of mitochondrial Cyt c oxidation and ROS production in androgen-stimulated cell proliferation in androgen-sensitive prostate cancer cells. In parallel, DHT treatment has been shown to increase the mitochondrial activity in AR-positive prostate cancer cells (Ripple et al., 1997). Nevertheless, the involvement of other redox proteins in DHT-induced ROS production cannot be ruled out in this study.
Serine-36 phosphorylation followed by prolyl isomerization of p66Shc is proposed to be necessary for its mitochondrial translocation in mouse embryonic fibroblast cells treated with proapoptotic concentrations of H2O2 (Pinton et al., 2007). We analysed whether growth stimulants, such as DHT, would also employ a similar mechanism in prostate cancer epithelial cells. Nevertheless, under our experimental conditions, DHT decreased the serine-36 phosphorylation level of p66Shc in a time-dependent manner (Supplementary Figure 4a and b). Furthermore, ectopic expression of S36A mutant of p66Shc did not decrease DHT-induced cell proliferation in these cells (Supplementary Figure 4c). We propose that DHT-induced mitochondrial translocation of p66Shc and subsequent cell growth induction are mediated by a serine-36 phosphorylation-independent mechanism. Furthermore, semiquantification analysis of immunoblots indicated that p66Shc level at 16 h of DHT treatment in total lysate increased by approximately 40%; whereas the increase in the mitochondrial fraction of DHT-treated cells at the same time point was about 200%, indicating that there is a net increase in the translocation of p66Shc (Supplementary Figure 5). Thus, it is apparent that there are differential mechanisms regulating p66Shc signaling depending on the specific cell type (mouse embryonic fibroblast vs prostate epithelial cells) and the type of stimulus (apoptosis vs proliferation) involved. Further studies are required to identify the mechanism of DHT-induced mitochondrial translocation of p66Shc protein.
In summary, our data reveal a novel signaling pathway regulating androgenic cell proliferation that involves p66Shc and ROS production; although, the androgenic stimulation of PSA expression and secretion, a marker for AR activation, is not mediated by the p66Shc–ROS pathway. As shown in Figure 8, as an early event of non-genomic signaling in androgen action, DHT-bound AR increases p66Shc protein levels and its translocation into mitochondria, where p66Shc activates the ROS producing machinery in mitochondria. Increased ROS levels could activate mitogenic signaling pathways, for example, activation of tyrosine kinases through inactivation of their inhibitory phosphatases, which promote cell cycle progression through Cyclin D1 and cell proliferation. The observations that overexpression of p66Shc has a positive effect on the proliferation of AR-positive cells have potential clinical implications because most of the early as well as the advanced prostate cancer cells express functional AR. The observation that p66Shc level is higher in archival cancer specimens warrants further studies to define the role of p66Shc in prostate cancer progression.
Figure 8.

A schematic representation of the p66Shc pathway in androgen action on prostate cancer cell proliferation. Dihydrotestosterone (DHT)-bound androgen receptor (AR) complex can activate two independent pathways—AR-dependent gene expression, such as prostate-specific antigen (PSA), and AR-dependent cell proliferation, involving the p66Shc–reactive oxygen species (ROS) pathway. Stimulation of androgenic proliferation includes an increase in p66Shc protein level after DHT treatment. Increased p66Shc translocates into mitochondria, where it interacts with cytochrome c (Cyt c), localized in the mitochondrial inner membrane, and generates ROS production. Increased ROS production promotes cell cycle progression, through Cyclin D1 and, which in turn, increases cell proliferation. In addition to the activation of p66Shc–ROS pathway, a part of the cell growth is also mediated by the genomic effects of the AR-dependent pathway (Dotted arrow).
Materials and methods
Reagents, cDNA and antibodies
Fetal bovine serum (FBS), gentamicin, L-glutamine, RPMI 1640 medium and DCF-DA were obtained from Invitrogen (Carlsbad, CA, USA). Charcoal/dextran-treated FBS was purchased from HyClone (Logan, UT, USA). Myc-tagged wild-type p66Shc cDNA was constructed in pcDNA3.1 vector (Veeramani et al., 2005). Mutant p66Shc cDNA, whose tryptophan 134 was mutated to phenylalanine (W134F), was created by site-directed mutagenesis and confirmed by DNA sequencing. Full-length cDNA encoding Mn-SOD was a kind gift from Dr Larry W Oberley at University of Iowa College of Medicine (Iowa City, IA, USA). Plasmid encoding an enhanced cyan fluorescent protein (pECFP-N1) was a kind gift from Dr Parmender P Mehta, University of Nebraska Medical Center (Omaha, NE, USA). Full-length glutathione peroxidase 1 cDNA was purchased from OriGene Technologies (Rockville, MD, USA). Polyclonal antibodies recognizing all three Shc isoforms, glutathione peroxidase 1, Mn-SOD, Cyclin D1 were from Santa Cruz Biotechnology Ltd (Santa Cruz, CA, USA). Anti-β-actin antibody, NAC and VES were from Sigma (St Louis, MO, USA). All the other reagents and chemicals used in this study were as described previously (Lin et al., 1998; Meng and Lin, 1998; Lee et al., 2004a, b; Veeramani et al., 2005).
Cell lines
Androgen-sensitive human prostate cancer cell lines, LNCaP-FGC (Horoszewicz et al., 1983) and MDA PCa2b (Navone et al., 1997), were purchased from the American Type Culture Collection (Rockville, MD, USA). LNCaP cells were routinely maintained in phenol red-positive RPMI 1640 medium supplemented with 5% FBS (v/v), 2 mM glutamine and 50 μg/ml gentamicin (Lin et al., 1998). For DHT treatment, LNCaP cells, with passage number less than 35 (Lin et al., 1998) were steroid starved for 48 h in steroid-reduced medium, that is, phenol red-free RPMI 1640 medium containing 5% charcoal/dextran-treated FBS, 2 mM glutamine and 50 μg/ml gentamicin. Cells were then exposed to DHT (10 nM) and harvested after various periods of time, as indicated in each experiment. MDA PCa2b cells were cultured in BRFF-HPC1 medium containing 20% FBS, 2 mM glutamine and 50 μg/ml gentamicin (Lee et al., 2004a; Veeramani et al., 2005). For steroid-reduced conditions, BRFF-BMZERO medium containing 15% charcoal/dextran-treated FBS was used. For cell growth experiments, the cells were trypsinized and counted in a Z1 model Coulter Counter (Coulter Corporation, Miami, FL, USA).
Transfection
For transient transfection experiments, LNCaP cells were plated at a density of 1 × 10⁴ cells per cm2 and transfected using Lipofectamine and Plus reagents. Four hours after transfection, the cells were fed with RPMI media containing 10% FBS for 24 h. The cells were then steroid starved for 48 h before they were treated with 10 nM DHT. Stable subclones of LNCaP cells overexpressing p66Shc were derived as described (Veeramani et al., 2005). MDA PCa2b cells were plated at a density of 4 × 10⁴ cells/cm2 and transfected using Lipofectamine 2000 in the presence of 5% FBS.
Immunoblotting
The protocols for immunoblotting were as described previously (Lin et al., 1998; Meng and Lin, 1998). Briefly, subconfluent cells were scraped and were rinsed with ice-cold 20 mM HEPES-buffered saline, pH 7.0. Cell pellet was lysed in ice-cold high-stringent cell lysis buffer containing protease and phosphatase inhibitors, spun at 200 × g for 10 min. Medium samples were collected and spun at 200 × g for 10 min. β-actin protein levels were used as loading controls for cell lysates. For medium samples, membrane was stained with Coomassie blue R250 to confirm equal loading of samples.
Co-immunoprecipitation
Co-immunoprecipitation was performed using the ExactaCruz kit (Santa Cruz Biotech) as per the recommended protocols. Briefly, 10 μg of anti-Myc or anti-Cyt c antibody (Upstate, Lake Placid, NY, USA) was incubated with mouse IP matrix for 2 h at 4 °C and then washed with IP lysis buffer (20 mM HEPES, pH 7.0, 150mM NaCl, 1% NP-40, 1 mM EDTA, 10 mM MgCl2 and 10% glycerol containing protease and phosphatase inhibitors) for three times. Cell lysate of 1 mg was mixed with antibody-mouse IP matrix complex and incubated for 2 h at 4 °C. The immune complexes were washed three times with IP lysis buffer and the pellet was boiled in 2 × Laemmli sample buffer and subjected to immunoblotting.
ROS measurement
Intracellular H2O2 level was estimated by DCF-DA assay (Giorgio et al., 2005; Khanday et al., 2006). Briefly, the cells were rinsed in Krebs-Ringer buffer and exposed to 20 μM DCF-DA in the dark for 15 min at 37 °C. Subsequently, the cells were trypsinized and resuspended in Krebs-Ringer buffer. Intracellular fluorescence was quantified by flow cytometry (Becton-Dickinson Franklin Lakes, NJ, USA). Relative fluorescence was plotted as ratio to the control cells. In transient transfection experiments, the cells were co-transfected with pECFP-N1 and p66Shc cDNA. After incubation with DCF-DA, ROS levels were measured in ECFP-positive cells using BD LSR II flow cytometer (Becton-Dickinson).
Subcellular fractionation
Subfractionation of LNCaP cells were carried out as described (Giorgio et al., 2005). Briefly, subconfluent cells were scraped and cell pellet was homogenized in ice-cold MTC buffer containing 0.25 m sucrose using a Dounce glass homogenizer. Homogenized cells were centrifuged to pellet down nucleus and cell debris (700 × g). The supernatant was spun at 8000 × g for 15 min to pellet mitochondria. Finally, the lysate was spun at 15 000 × g and the clear supernatant representing cytosolic fraction was isolated. Total cell and mitochondrial pellets were lysed in ice-cold high-stringent lysis buffer. Equal amount of total, mitochondrial and cytosolic proteins were subjected to immunoblotting as described earlier.
RNA silencing
To knockdown p66Shc expression, pSUP-p66, a plasmid-based small interfering RNA system targeted against the CH2 region of p66Shc, was used (Veeramani et al., 2005). Transfection of pSUP-p66 was performed as described for cDNA transfection.
Statistical analysis
Each experiment was performed in duplicates, repeated 2–3 times and the mean and standard error values were calculated. The significance of difference (P-value) was calculated using independent t-test and the P-value less than 0.05 was considered as significant.
Supplementary Material
Supplementary Figure 1: Relative p66Shc protein levels in control and DHT-treated LNCaP prostate cancer cells
Semi-quantification analysis of the immunoblots was performed for p66Shc protein levels in LNCaP cells treated with 10 nM DHT. Control cells were treated with ethanol. β-actin was used as the loading control. Values for p66Shc protein were normalized to β-actin before performing statistical analysis. Data shown is the mean ± SE from three sets of independent experiments (*p<0.05, **p<0.01)
Supplementary Figure 2: Effect of ectopic expression of WT or W134F mutant of p66Shc on androgen stimulation of proliferation in endogenous p66Shc-knocked-down LNCaP cells
(a) LNCaP cells were plated at a density of 1×10⁴ cells/cm2. Cells were co-transfected with siRNA against endogenous p66Shc (pSUP-p66En) and WT or W134F mutant of p66Shc cDNA. Control cells were transfected with pSUPER or pSUP-p66En alone. All the cells were further co-transfected with pECFP cDNA to normalize the transfection efficiency. Cells were then steroid-starved for 48 hours and subsequently treated with ethanol or 10 nM DHT. ROS was measured after 48 hours of DHT treatment using DCF-DA assay. Relative fluorescence units were normalized to pECFP fluorescence to nullify the differences in the transfection efficiency. Data shown is the mean ± SE of the values from two sets of independent experiments (*p<0.05) (B) Cell proliferation for above-mentioned transfected cells was performed by counting the cells as described in the Materials and Methods of the revised manuscript. Results were normalized to the control pSUPER transfected cells treated with ethanol. Data show is the mean ± SE of the values from two sets of independent experiments (*p<0.05).
Supplementary Figure 3: Effect of DHT on p53 protein levels in androgen-sensitive LNCaP cells
LNCaP cells were plated at a density of 1×10⁴ cells/cm2. Cells were allowed to attach for 3 days and then steroid-starved for 48 hours. Cells were then treated with either ethanol or 10 nM DHT. Cells were scraped and harvested at specific time-points and analyzed for p53 protein levels by immunoblotting. β-actin was used as a loading control. Data shown is a representative of two sets of independent experiments.
Supplementary Figure 4: Role of serine-36 phosphorylation of p66Shc in DHT-induced cell proliferation in LNCaP cells
(a) LNCaP cells were plated at a density of 1×10⁴ cells/cm2. Cells were allowed to attach for 3 days and then steroid-starved for 48 hours. Cells were then treated with either ethanol or 10 nM DHT. Cells were scraped and harvested at specific time-points and analyzed for serine-36 phosphorylation using specific monoclonal antibody (Calbiochem, USA). Protein levels of Shc were analyzed by antibody against all the three Shc isoforms as mentioned in the Materials and Methods. β-actin was used as a loading control. Data shown is the representative of two sets of independent experiments. (b) Semi-quantification of the immunoblots mentioned above was performed and ratios of Ser-36-phosphorylation to protein levels of p66Shc were obtained (pSer-36/p66Shc) at different time points. Ratios of DHT-treated cells were normalized to their respective ethanol-treated control cells. Data shown is the mean ± SE values of two independent sets of experiments (*p<0.05) (c) LNCaP cells transfected with either W134F mutant or S36A mutant of p66Shc. Control cells were transfected with pcDNA 3.1 alone. Cells were then steroid starved for 48 hours and treated with either ethanol or 10 nM DHT. Cells were trypsinized and cell numbers were analyzed after 48 hours of treatment. Data shown is the representative of two sets of independent experiments (*p<0.05).
Supplementary Figure 5: Semi-quantitative analysis of mitochondrial translocation of p66Shc in DHT-treated LNCaP cells
Semi-quantitative analysis for p66Shc protein level was performed on the immunoblots containing both the total lysate and the mitochondrial fraction of LNCaP cells treated with DHT for 16 hours, as shown in Figure 6a. Protein levels in DHT-treated cells were normalized to that of ethanol-treated cells. Data shown is the mean ± SE of the values from four sets of independent experiments
Acknowledgments
We thank the technical supports from the Flow Cytometry core facility at UNMC and Eppley Cancer Center (P30CA036727). This study was supported in part by the Department of Defense Grants (W81XWH-04-1-0908 and W81XWH-06-1-0070), National Institutes of Health (R01 CA88184) and UNMC Graduate Student Fellowship. We thank Dr Ming-Shyue Lee for the initial study of DHT effect on serine-36 phosphorylation of p66Shc. We also acknowledge Dr Larry W Oberley at University of Iowa College of Medicine (Iowa City, IA, USA) and Dr Parmender P Mehta, University of Nebraska Medical Center (Omaha, NE, USA) for the plasmids Mn-SOD and pECFP-N1, respectively.
Footnotes
Supplementary Information accompanies the paper on the Oncogene website (http://www.nature.com/onc).
References
- Bourdon JC. p53 and its isoforms in cancer. Br J Cancer. 2007;97:277–282. doi: 10.1038/sj.bjc.6603886. [DOI] [PMC free article] [PubMed] [Google Scholar]
- Davol PA, Bagdasaryan R, Elfenbein GJ, Maizel AL, Frackelton AR., Jr Shc proteins are strong, independent prognostic markers for both node-negative and node-positive primary breast cancer. Cancer Res. 2003;63:6772–6783. [PubMed] [Google Scholar]
- Giorgio M, Migliaccio E, Orsini F, Paolucci D, Moroni M, Contursi C, et al. Electron transfer between cytochrome c and p66Shc generates reactive oxygen species that trigger mitochondrial apoptosis. Cell. 2005;122:221–233. doi: 10.1016/j.cell.2005.05.011. [DOI] [PubMed] [Google Scholar]
- Grossman SR, Lyle S, Resnick MB, Sabo E, Lis RT, Rosinha E, et al. p66 Shc Tumor Levels Show a Strong Prognostic Correlation with Disease Outcome in Stage IIA Colon Cancer. Clin Cancer Res. 2007;13:5798–5804. doi: 10.1158/1078-0432.CCR-07-0073. [DOI] [PubMed] [Google Scholar]
- Horoszewicz JS, Leong SS, Kawinski E, Karr JP, Rosenthal H, Chu TM, et al. LNCaP model of human prostatic carcinoma. Cancer Res. 1983;43:1809–1818. [PubMed] [Google Scholar]
- Jackson JG, Yoneda T, Clark GM, Yee D. Elevated levels of p66 Shc are found in breast cancer cell lines and primary tumors with high metastatic potential. Clin Cancer Res. 2000;6:1135–1139. [PubMed] [Google Scholar]
- Khanday FA, Santhanam L, Kasuno K, Yamamori T, Naqvi A, Dericco J. Sos-mediated activation of rac1 by p66shc. J Cell Biol. 2006;172:817–822. doi: 10.1083/jcb.200506001. [DOI] [PMC free article] [PubMed] [Google Scholar]
- Klein EA, Thompson IM, Lippman SM, Goodman PJ, Albanes D, Taylor PR, et al. SELECT: the next prostate cancer prevention trial. Selenum and Vitamin E Cancer Prevention Trial. J Urol. 2001;166:1311–1315. doi: 10.1016/s0022-5347(05)65759-x. [DOI] [PubMed] [Google Scholar]
- Kuruma H, Egawa S, Oh-Ishi M, Kodera Y, Satoh M, Chen W, et al. High molecular mass proteome of androgen-independent prostate cancer. Proteomics. 2005;5:1097–1112. doi: 10.1002/pmic.200401115. [DOI] [PubMed] [Google Scholar]
- Lee MS, Igawa T, Chen SJ, Van Bemmel D, Lin JS, Lin FF, et al. p66Shc protein is upregulated by steroid hormones in hormone-sensitive cancer cells and in primary prostate carcinomas. Int J Cancer. 2004a;108:672–678. doi: 10.1002/ijc.11621. [DOI] [PubMed] [Google Scholar]
- Lee MS, Igawa T, Lin MF. Tyrosine-317 of p52(Shc) mediates androgen-stimulated proliferation signals in human prostate cancer cells. Oncogene. 2004b;23:3048–3058. doi: 10.1038/sj.onc.1207451. [DOI] [PubMed] [Google Scholar]
- Lim SD, Sun C, Lambeth JD, Marshall F, Amin M, Chung L, et al. Increased Nox1 and hydrogen peroxide in prostate cancer. Prostate. 2005;62:200–207. doi: 10.1002/pros.20137. [DOI] [PubMed] [Google Scholar]
- Lin MF, Meng TC, Rao PS, Chang C, Schonthal AH, Lin FF. Expression of human prostatic acid phosphatase correlates with androgen-stimulated cell proliferation in prostate cancer cell lines. J Biol Chem. 1998;273:5939–5947. doi: 10.1074/jbc.273.10.5939. [DOI] [PubMed] [Google Scholar]
- Lotti LV, Lanfrancone L, Migliaccio E, Zompetta C, Pelicci G, Salcini AE, et al. Shc proteins are localized on endoplasmic reticulum membranes and are redistributed after tyrosine kinase receptor activation. Mol Cell Biol. 1996;16:1946–1954. doi: 10.1128/mcb.16.5.1946. [DOI] [PMC free article] [PubMed] [Google Scholar]
- Migliaccio E, Giorgio M, Mele S, Pelicci G, Reboldi P, Pandolfi PP, et al. The p66shc adaptor protein controls oxidative stress response and life span in mammals. Nature. 1999;402:309–313. doi: 10.1038/46311. [DOI] [PubMed] [Google Scholar]
- Migliaccio E, Mele S, Salcini AE, Pelicci G, Lai KM, Superti-Furga G, et al. Opposite effects of the p52Shc/p46Shc and p66Shc splicing isoforms on the EGF receptor-MAP kinase-fos signalling pathway. EMBO J. 1997;16:706–716. doi: 10.1093/emboj/16.4.706. [DOI] [PMC free article] [PubMed] [Google Scholar]
- Meng TC, Lin MF. Tyrosine phosphorylation of c-ErbB-2 is regulated by the cellular form of prostatic acid phosphatase in human prostate cancer cells. J Biol Chem. 1998;273:22096–22104. doi: 10.1074/jbc.273.34.22096. [DOI] [PubMed] [Google Scholar]
- Navone NM, Olive M, Ozen M, Davis R, Troncoso P, Tu SM, et al. Establishment of two human prostate cancer cell lines derived from a single bone metastasis. Clin Cancer Res. 1997;3:2493–2500. [PubMed] [Google Scholar]
- Nemoto S, Combs CA, French S, Ahn BH, Fergusson MM, Balaban RS, et al. The mammalian longevity-associated gene product p66shc regulates mitochondrial metabolism. J Biol Chem. 2006;281:10555–10560. doi: 10.1074/jbc.M511626200. [DOI] [PubMed] [Google Scholar]
- Orsini F, Migliaccio E, Moroni M, Contursi C, Raker VA, Piccini D, et al. The life span determinant p66Shc localizes to mitochondria where it associates with mitochondrial heat shock protein 70 and regulates trans-membrane potential. J Biol Chem. 2004;279:25689–25695. doi: 10.1074/jbc.M401844200. [DOI] [PubMed] [Google Scholar]
- Okada S, Kao AW, Ceresa BP, Blaikie P, Margolis B, Pessin JE. The 66-kDa Shc isoform is a negative regulator of the epidermal growth factor-stimulated mitogen-activated protein kinase pathway. J Biol Chem. 1997;272:28042–28049. doi: 10.1074/jbc.272.44.28042. [DOI] [PubMed] [Google Scholar]
- Pacini S, Pellegrini M, Migliaccio E, Patrussi L, Ulivieri C, Ventura A, et al. p66SHC promotes apoptosis and antagonizes mitogenic signaling in T cells. Mol Cell Biol. 2004;24:1747–1757. doi: 10.1128/MCB.24.4.1747-1757.2004. [DOI] [PMC free article] [PubMed] [Google Scholar]
- Pandolfi S, Bonafe M, Di Tella L, Tiberi L, Salvioli S, Monti D, et al. p66(Shc) is highly expressed in fibroblasts from centenarians. Mech Ageing Dev. 2005;126:839–844. doi: 10.1016/j.mad.2005.03.004. [DOI] [PubMed] [Google Scholar]
- Park YJ, Kim TY, Lee SH, Kim H, Kim SW, Shong M, et al. p66Shc expression in proliferating thyroid cells is regulated by thyrotropin receptor signaling. Endocrinol. 2005;146:2473–2480. doi: 10.1210/en.2004-1588. [DOI] [PubMed] [Google Scholar]
- Pinton P, Rimessi A, Marchi S, Orsini F, Migliaccio E, Giorgio M, et al. Protein kinase C beta and prolyl isomerase 1 regulate mitochondrial effects of the life-span determinant p66Shc. Science. 2007;315:659–663. doi: 10.1126/science.1135380. [DOI] [PubMed] [Google Scholar]
- Ravichandran KS. Signaling via Shc family adapter proteins. Oncogene. 2001;20:6322–6330. doi: 10.1038/sj.onc.1204776. [DOI] [PubMed] [Google Scholar]
- Ripple MO, Henry WF, Rago RP, Wilding G. Prooxidant-antioxidant shift induced by androgen treatment of human prostate carcinoma cells. J Natl Cancer Inst. 1997;89:40–48. doi: 10.1093/jnci/89.1.40. [DOI] [PubMed] [Google Scholar]
- Stevenson LE, Frackelton AR., Jr Constitutively tyrosine phosphorylated p52 Shc in breast cancer cells: correlation with ErbB2 and p66 Shc expression. Breast Cancer Res Treat. 1998;49:119–128. doi: 10.1023/a:1006007227747. [DOI] [PubMed] [Google Scholar]
- Trinei M, Giorgio M, Cicalese A, Barozzi S, Ventura A, Migliaccio E, et al. A p53-p66Shc signalling pathway controls intracellular redox status, levels of oxidation-damaged DNA and oxidative stress-induced apoptosis. Oncogene. 2002;21:3872–3878. doi: 10.1038/sj.onc.1205513. [DOI] [PubMed] [Google Scholar]
- Ventura A, Maccarana M, Raker VA, Pelicci PG. A cryptic targeting signal induces isoform-specific localization of p46Shc to mitochondria. J Biol Chem. 2004;279:2299–2306. doi: 10.1074/jbc.M307655200. [DOI] [PubMed] [Google Scholar]
- Veeramani S, Igawa T, Yuan TC, Lin FF, Lee MS, Lin JS, et al. Expression of p66(Shc) protein correlates with proliferation of human prostate cancer cells. Oncogene. 2005;24:7203–7212. doi: 10.1038/sj.onc.1208852. [DOI] [PubMed] [Google Scholar]
- Xie Y, Hung MC. p66Shc isoform down-regulated and not required for HER-2/neu signaling pathway in human breast cancer cell lines with HER-2/neu overexpression. Biochem Biophys Res Commun. 1996;221:140–145. doi: 10.1006/bbrc.1996.0559. [DOI] [PubMed] [Google Scholar]
- Yang CP, Horwitz SB. Distinct mechanisms of taxol-induced serine phosphorylation of the 66-kDa Shc isoform in A549 and RAW 264.7 cells. Cancer Res. 2000;60:5171–5178. [PubMed] [Google Scholar]
Associated Data
This section collects any data citations, data availability statements, or supplementary materials included in this article.
Supplementary Materials
Supplementary Figure 1: Relative p66Shc protein levels in control and DHT-treated LNCaP prostate cancer cells
Semi-quantification analysis of the immunoblots was performed for p66Shc protein levels in LNCaP cells treated with 10 nM DHT. Control cells were treated with ethanol. β-actin was used as the loading control. Values for p66Shc protein were normalized to β-actin before performing statistical analysis. Data shown is the mean ± SE from three sets of independent experiments (*p<0.05, **p<0.01)
Supplementary Figure 2: Effect of ectopic expression of WT or W134F mutant of p66Shc on androgen stimulation of proliferation in endogenous p66Shc-knocked-down LNCaP cells
(a) LNCaP cells were plated at a density of 1×10⁴ cells/cm2. Cells were co-transfected with siRNA against endogenous p66Shc (pSUP-p66En) and WT or W134F mutant of p66Shc cDNA. Control cells were transfected with pSUPER or pSUP-p66En alone. All the cells were further co-transfected with pECFP cDNA to normalize the transfection efficiency. Cells were then steroid-starved for 48 hours and subsequently treated with ethanol or 10 nM DHT. ROS was measured after 48 hours of DHT treatment using DCF-DA assay. Relative fluorescence units were normalized to pECFP fluorescence to nullify the differences in the transfection efficiency. Data shown is the mean ± SE of the values from two sets of independent experiments (*p<0.05) (B) Cell proliferation for above-mentioned transfected cells was performed by counting the cells as described in the Materials and Methods of the revised manuscript. Results were normalized to the control pSUPER transfected cells treated with ethanol. Data show is the mean ± SE of the values from two sets of independent experiments (*p<0.05).
Supplementary Figure 3: Effect of DHT on p53 protein levels in androgen-sensitive LNCaP cells
LNCaP cells were plated at a density of 1×10⁴ cells/cm2. Cells were allowed to attach for 3 days and then steroid-starved for 48 hours. Cells were then treated with either ethanol or 10 nM DHT. Cells were scraped and harvested at specific time-points and analyzed for p53 protein levels by immunoblotting. β-actin was used as a loading control. Data shown is a representative of two sets of independent experiments.
Supplementary Figure 4: Role of serine-36 phosphorylation of p66Shc in DHT-induced cell proliferation in LNCaP cells
(a) LNCaP cells were plated at a density of 1×10⁴ cells/cm2. Cells were allowed to attach for 3 days and then steroid-starved for 48 hours. Cells were then treated with either ethanol or 10 nM DHT. Cells were scraped and harvested at specific time-points and analyzed for serine-36 phosphorylation using specific monoclonal antibody (Calbiochem, USA). Protein levels of Shc were analyzed by antibody against all the three Shc isoforms as mentioned in the Materials and Methods. β-actin was used as a loading control. Data shown is the representative of two sets of independent experiments. (b) Semi-quantification of the immunoblots mentioned above was performed and ratios of Ser-36-phosphorylation to protein levels of p66Shc were obtained (pSer-36/p66Shc) at different time points. Ratios of DHT-treated cells were normalized to their respective ethanol-treated control cells. Data shown is the mean ± SE values of two independent sets of experiments (*p<0.05) (c) LNCaP cells transfected with either W134F mutant or S36A mutant of p66Shc. Control cells were transfected with pcDNA 3.1 alone. Cells were then steroid starved for 48 hours and treated with either ethanol or 10 nM DHT. Cells were trypsinized and cell numbers were analyzed after 48 hours of treatment. Data shown is the representative of two sets of independent experiments (*p<0.05).
Supplementary Figure 5: Semi-quantitative analysis of mitochondrial translocation of p66Shc in DHT-treated LNCaP cells
Semi-quantitative analysis for p66Shc protein level was performed on the immunoblots containing both the total lysate and the mitochondrial fraction of LNCaP cells treated with DHT for 16 hours, as shown in Figure 6a. Protein levels in DHT-treated cells were normalized to that of ethanol-treated cells. Data shown is the mean ± SE of the values from four sets of independent experiments