

Abstract
The villin headpiece subdomain, HP36, is the smallest naturally occurring protein that folds cooperatively. Its small size, rapid folding, and simple three-helix topology have made it an extremely popular system for computational studies of protein folding. The role of unfolded state structure in rapid folding is an area of active investigation, but relatively little is known about the properties of unfolded states under native conditions. A peptide fragment, HP21, which contains the first and second helices of HP36 has been shown to be a good model for structure in the unfolded state of the intact domain but a detailed description of the conformational propensities of HP21 is lacking and the balance between native and nonnative interactions is not known. A series of three-dimensional NMR experiments were performed on 13C, 15N-labeled HP21 to investigate in detail its conformational propensities. Analysis of 13Cα, 13Cβ, 13CO chemical shifts, Δδ13Cα − Δδ13Cβ secondary shifts, the secondary structure propensity scores, NOEs, 15N R2 values and comparison of experimental chemical shifts with those of HP36 and with chemical shifts calculated using the SHIFTS and SHIFTX programs all indicate that there is significant native like structure in the HP21 ensemble, and thus by implication in the unfolded state of HP36.
Keywords: unfolded state, rapid folding, NMR, chemical shift analysis, villin headpiece
Introduction
A detailed understanding of the process of protein folding is still lacking. Most of the experimental and theoretical effort has focused on characterizing the transition state for folding and on the analysis of the properties of any intermediates which may be populated. In contrast, relatively little attention has been directed towards the unfolded state, however knowledge of the conformational propensities of the unfolded state is essential for understanding the protein folding process because it is the starting point for folding and can be the starting state for aggregation.1–5 The potential role of preformed structure in the unfolded state has received increasing attention, particularly for rapid folding proteins.2,6,7 The free energy balance for folding and the normally cooperative nature of folding mean that only a tiny fraction of molecules normally populate the unfolded state under native conditions, and the vast majority of the reported studies of unfolded proteins are performed under strongly denaturing conditions, such as in the presence of denaturant, acid or high temperature. The unfolded state which is populated under native conditions is the unfolded state which is directly relevant for protein folding, and it is clear that the conformation propensities of this unfolded ensemble can be dramatically different from the unfolded state populated under strongly denaturing conditions. However, studies of the unfolded ensemble under native conditions are still rare owing to their difficulty.
The 36-residue villin headpiece helical subdomain HP36 is the smallest naturally occurring protein which folds cooperatively.8–11 Its small size and rapid folding have made it an extraordinarily popular system for computational and theoretical studies.12–42 The domain is made up of three α-helices and contains a well-packed hydrophobic core made up in part of a cluster of three phenylalanines, Phe47, Phe51, Phe58 (see Fig. 1). The numbering system used here is derived from that used for the intact headpiece. The helical subdomain begins at Leu42. An additional Met results from the expression of the domain and is designated Met41. This notation is widely used in the literature. Peptides which corresponded to each of the individual helices of HP36 have been shown to be largely unstructured in isolation while a peptide which included the first two helices was found to contain considerable α-helical structure as judged by CD and proton NMR.43,44 The peptide, denoted HP21 (HP1/2 in Ref.43), comprises the first 21 residues of HP36 and includes the three core phenylalanines. HP21 has been shown to be a good model for structure populated in the unfolded state of the intact subdomain.43 Previously reported CD studies of this peptide indicate the presence of some residual structure but CD obviously can not define the location of the helices.43 In addition, the CD signal of short α-helices is much weaker than “normal” α-helical spectra thus it is difficult to directly relate the rotational strength observed in CD spectra of systems such as HP21 to helical content. In contrast, NMR chemical shifts are dependent on local conformation and thus are sensitive reporters of ψ, ϕ preferences. The initial characterization of HP21 provided important information but necessarily could not define the limits of the structured regions and was unable to determine if non-native structure was populated. The purpose of this work is to define the structural propensities of the HP21 ensemble at high resolution, using 1H, 13C, 15N triple resonance NMR methods.
Figure 1.
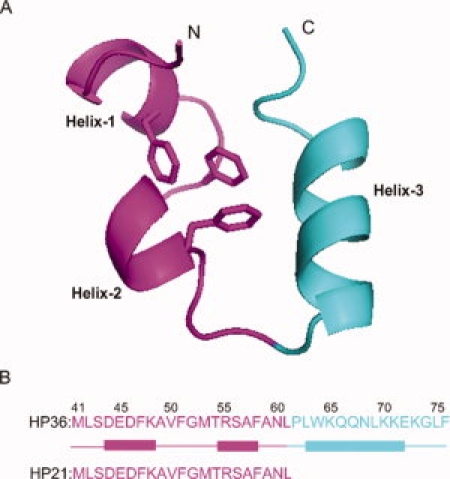
Primary structure of the villin headpiece subdomain HP36. (A) Ribbon diagram of HP36 created using PyMOL (PDB entry; 1VII). The fragment corresponding to HP21 is in purple. The three phenylalanines are shown, and the N- and C-termini are labeled. (B) Primary sequence of HP36 and HP21 with α-helices represented by rectangles. The numbering system for the full length villin headpiece subdomain is used, where the helical subdomain starts from residue Leu42. An additional Met at the N-terminus results from the expression of the protein, and this residue is designated as Met41. In the NMR structure (PDB entry 1VII), the three helices run from Asp44 to Lys48, Arg55 to Phe58, and Leu63 to Glu72, and are donated as helix-1, helix-2, and helix-3 respectively. In the X-ray structure,33 the boundaries of the helices are Asp44 to Phe51, Arg55 to Asn60, and Leu63 to Lys73.
Results
To obtain a detailed picture of the conformational propensities of HP21 and by implication of the unfolded state of HP36 under native like conditions, we obtained complete 1Hα, 1HN, 15N, 13Cα, 13Cβ, and 13CO NMR assignments for HP21. Assignments were also obtained for the native state of HP36 to serve as a basis of comparison since complete 13C assignments of HP36 wild type have not been reported. Figure 2 compares the 15N-1H HSQC spectra of HP36 and HP21. The spectrum of HP36 is very well resolved and the resonances are sharp as expected for a well folded small monomeric protein. The spectrum of HP21 is also well dispersed. 13Cα chemical shifts were obtained from HNCA and HN(CO)CA triple resonance experiments, with reference to the previously assigned 15N-1H HSQC spectrum.44 13Cβ chemical shifts were obtained from the CBCA(CO)NH experiment, and 13CO chemical shifts were obtained from a HNCO experiment. The assignments are included in the Supporting Information. Assignments for HP36 were obtained using a similar strategy with reference to the previously HP36 assignments.8 They are also included in the Supporting Information. The estimated uncertainties are about 0.02 ppm for 1H chemical shifts, 0.20 ppm for 15N and 13C chemical shifts.
Figure 2.
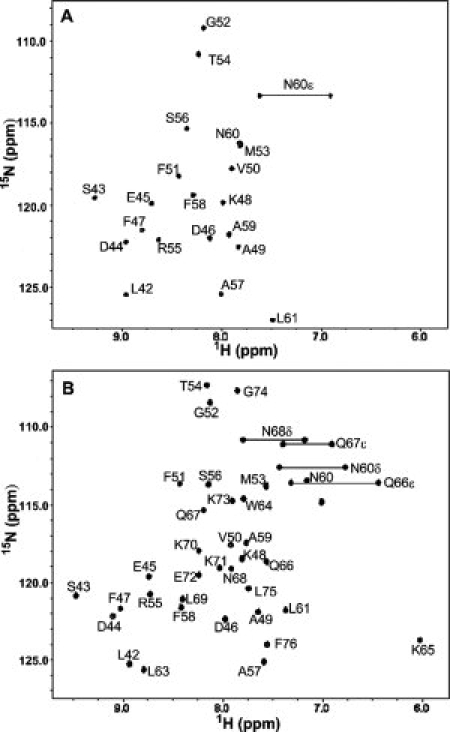
(A) The 15N-1H HSQC spectrum of HP21 recorded at pH 5.4 and 12°C. (B) 15N-1H HSQC spectrum of HP36 recorded at pH 5.0 and 25°C. The samples contained 150 mM sodium chloride and 10 mM sodium acetate. The resonances are labeled via residue number.
It is well known that the NMR chemical shifts are sensitive to secondary structure. In particular, the deviations of observed shifts relative to their random coil values (Δδ = δobserved − δrandomcoil), i. e., secondary shifts, are very useful for indentifying secondary structure. Figure 3 displays plots of the 13Cα, 13Cβ and 13CO secondary shifts for HP21 and HP36. 13Cα secondary shifts are very sensitive to α-helical structure, and downfield 13Cα shifts often indicate a propensity to populate α-helical conformations. Figure 3(A) shows the 13Cα secondary shifts for HP21. Residues Asp44–Phe51 and Arg55–Ala59 are helical in the X-ray structure of intact HP36.33 For the regions corresponding to the native helices, residues Asp44–Phe51 and Arg55–Ala59, the 13Cα secondary shifts of HP21 are positive and large with values ranging from 0.97 to 3.71 ppm. The average deviations from random coil values are 2.71 ppm for the region corresponding to helix-1 and 1.88 ppm for helix-2. Figure 3(B) displays the 13Cα secondary shifts for the HP36 native state for comparison. In the native state of HP36, positive 13Cα secondary shifts ranging from 0.14 to 4.26 ppm are detected in the region of Asp44–Phe51 and Arg55–Ala59. The patterns of 13Cα secondary shifts are strikingly similar in HP21 and HP36, suggesting a clear propensity to populate native like α-helical content in the ensemble of HP21.
Figure 3.

Deviation of the 13C chemical shifts of HP21 and HP36 from random coil values. Data are plotted as observed—random coil. (A) HP21 13Cα, (B) HP36 13Cα, (C) HP21 13CO, (D) HP36 13CO, (E) HP21 13Cβ, and (F) HP36 13Cβ. Data were collected at 12°C and pH 5.4 for HP21, and 25°C and pH 5.0 for HP36. Both samples contain 10 mM sodium acetate and 150 mM sodium chloride. Random coil values of Wishart et al. were used.45
Like 13Cα secondary shifts, 13CO secondary shifts are expected to exhibit downfield-shifted, (positive), values in α-helices. As shown in Figure 3(C), positive 13CO secondary shifts are observed in the region of Asp44–Phe51 and Arg55–Phe58 for HP21. The values range from 1.01 ppm to 2.40 ppm, with an average secondary shift of 1.67 ppm in helix-1 and 1.45 ppm in helix-2. Ala59 shows a very small negative secondary shift of −0.06 ppm. Figure 3(D) shows the 13CO secondary shifts for HP36. Positive deviations from random coil values are found for residues Asp44–Phe51 and Arg55–Phe58. The deviations range from 1.68 to 3.20 ppm. The 13CO secondary shifts have very similar patterns in HP21 and HP36, including Ala59 which has a negative deviation of −0.09 ppm in HP36.
13Cβ secondary shifts also depend on secondary structure, although they are not as sensitive as other secondary shifts to α-helical structure. 13Cβ chemical shifts relative to random coil values are mostly up-field shifted in α-helices but, they can exhibit down-field shifted values as well.46 The 13Cβ secondary shifts for HP21 and HP36 are displayed in Figure 3(E) and Figure 3(F) respectively. For HP36 residues Asp44–Phe51 and Arg55–Ala59 display 13Cβ secondary shifts which are generally upfield-shifted with values ranging from −0.62 to −2.42 ppm. A different pattern of deviations is detected in HP21: those residues located in the helical regions in the native state display small downfield-shifted deviations ranging from 0.34 ppm to 1.49 ppm except for Ser56 for which the deviation is −0.39 ppm. However, as noted above, the 13Cβ secondary shift is not as sensitive as the 13Cα, 13CO, or 1Hα secondary shifts for the identification of helical structure, and previous statistical analysis has shown that a considerable percentage of 13Cβ secondary shifts in helices show positive deviations from random coil values.
Individual sets of secondary shifts provide useful information about secondary structure preferences, but a more reliable picture can be obtained from analyzing combinations of shifts. A common method is to use the difference in 13Cα and 13Cβ shifts, Δδ13Cα − Δδ13Cβ.47 One practical advantage of this approach is that it cancels out any potential uncertainty in chemical shift referencing. Positive Δδ13Cα − Δδ13Cβ values are an indication of α-helical structure, and negative values indicate a propensity to populate β-strand structure. Δδ13Cα − Δδ13Cβ values for HP21 and HP36 are shown in Figures 4(A,B) respectively. For HP21 in the region of Asp44–Phe51 and Arg55–Ala59, Δδ13Cα − Δδ13Cβ values range from −0.07 to 2.86 ppm with an average value of 1.85 ppm for helix-1 and 1.22 ppm for helix-2. The same regions in HP36 display values ranging from 2.31 to 6.04 ppm with an average value of 4.18 ppm for helix-1 and 3.76 ppm for helix-2. The pattern of Δδ13Cα − Δδ13Cβ values for HP21 and HP36 are strikingly similar to each other, including negative values for the two residues located N-terminal to helix-1 and helix-2. This provides additional evidence that native like α-helical structure is populated in the ensemble of HP21.
Figure 4.
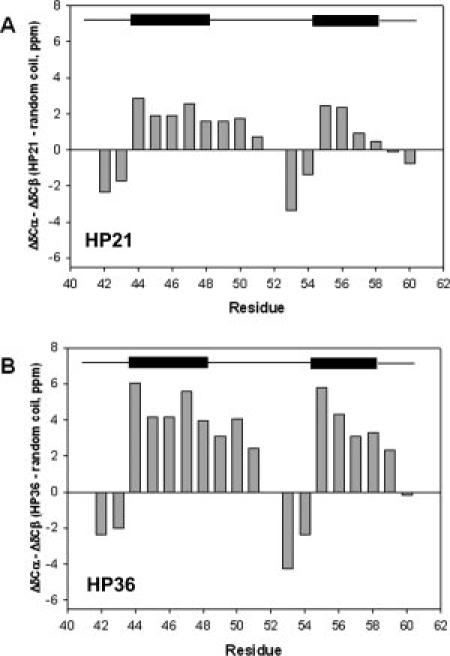
Plots of Δδ13Cα − Δδ13Cβ values for (A) HP21 and (B) HP36. A schematic diagram of the boundaries of the helices in the NMR structure of HP36 (PDB entry 1VII) is shown at the top. Positive values indicate α-helical propensity and negative values indicate β-strand structure propensity.
Another very useful method to quantify and compare secondary structure propensities is the secondary structure propensity (SSP) score developed by Forman-Kay and coworkers for application to natively disordered sequences.47 This method combines different chemical shifts to generate a single SSP score for each residue. An SSP score of 1 is interpreted to indicate fully formed α-helical structure and a value of −1 is assumed to represent fully formed β-strand structure. SSP scores for HP21 and HP36 calculated from 13Cα, 1Hα, and 13Cβ chemical shifts are shown in Figure 5. Most of the residues in the helical regions of HP36 show positive SSP scores near 1. The pattern of SSP scores is very similar for HP21 and HP36, although the values calculated for HP21 are smaller. The SSP scores for the sequence Asp44–Phe51 in HP21 range from 0.07 to 0.55, with average value of 0.35 for helix-1. In the region corresponds to residues Arg55–Ala59, the SSP scores range from 0.12 to 0.27 with an average value of 0.18 for helix-2, while the SSP scores are much closer to 0 for residues which are not helical in the native state. The SSP analysis is consistent with the analysis of the Δδ13Cα − Δδ13Cβ values, and further confirms that the HP21 ensemble contains native like α-helical structure. SSP scores are sometimes calculated using only 13Cα and 13Cβ chemical shifts. SSP scores based on just the 13Cα and 13Cβ chemical shifts are very similar to the SSP scores calculated from the combination of 13Cα, 1Hα and 13Cβ shifts (Supporting Information).
Figure 5.
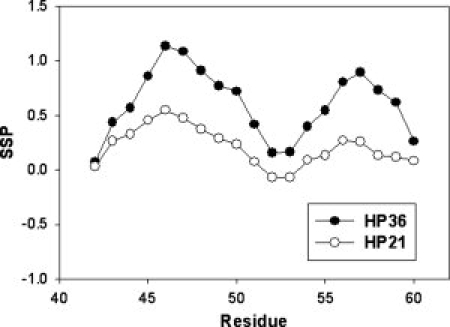
Secondary structure propensity (SSP) analysis of HP21 (○) and first 21 residues of HP36 (•) using the program developed by Forman-Kay and coworkers.47 Positive values represent α-helical propensity and negative values indicate β-strand propensity. The calculations were based on 13Cα, 13Cβ, and 1Hα chemical shifts.
There is a strong correlation between the observed SSP scores of HP21 and HP36 as well as a significant correlation between the respective values of Δδ13Cα − Δδ13Cβ (see Fig. 6). Both plots are linear with r2 = 0.96 for Δδ13Cα − Δδ13Cβ and r2 = 0.78 for the SSP scores. As expected the slopes are less than one consistent with HP21 populating native like secondary structure a fraction of the time. The observed correlation strongly suggest a tendency for HP21 to adopt native like secondary structure. This is reinforced by comparison of the experimental shifts of HP21 to those calculated from a “native like” model generated by taking the first 21 residues of the high resolution crystal structure of HP36. The observed shifts for HP21 are compatible with a strong tendency for the peptide to adopt native like structure as judged by comparison of the experimental shifts to those expected if HP21 adopts the same structure in isolation as it does in the intact domain (Supporting Information).
Figure 6.
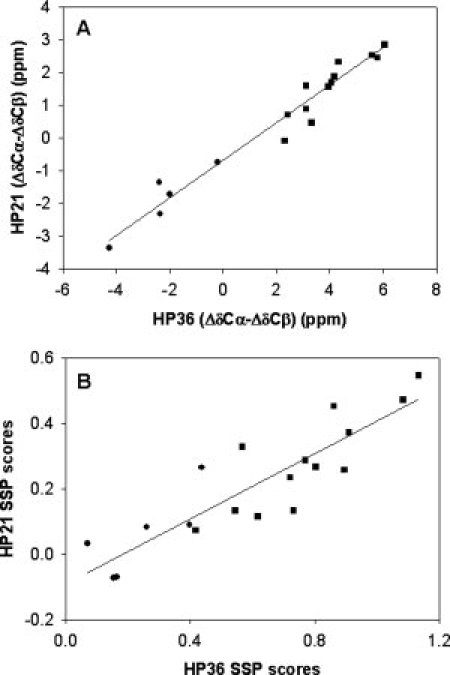
(A) Comparison of Δδ13Cα − Δδ13Cβ for HP36 and HP21. The value of r2 is 0.96. (B) Comparison of the SSP scores for HP36 and HP21. The value of r2 is 0.78. Residues which are helical in the native state are indicated as ▪, while residues located in nonhelical regions in the native state are indicated as •.
We supplemented the chemical shift data by conducting NOE measurements. A 3D 15N-1H NOESY-HSQC experiment was performed to detect sequential NOEs in HP21. The data is summarized in Figure 7. Sequential HN to HN NOEs were observed in the helical region from Asp44 to Phe51 and Arg55 to Ala59. In general the NOEs for residues in the central region of helices have larger intensities than those for residues at the boundaries of helices. Interestingly, sequential HN to HN NOEs were also observed in the turn region from Gly52 to Thr54, where the adjacent amide proton distances are within 5 Å in the X-ray structure.33 Those sequential HN to HN NOEs were also observed in the native state of HP36.9 In addition, a series of sequential Hα to HN NOEs and Hβ to HN NOEs were observed in the two helical regions of HP21, while few such NOEs were observed for the nonhelical residues. The observed sequential HN to HN NOEs in HP21 and their comparison with those in native state HP36 strongly suggest that native like secondary structure is populated in HP21.
Figure 7.
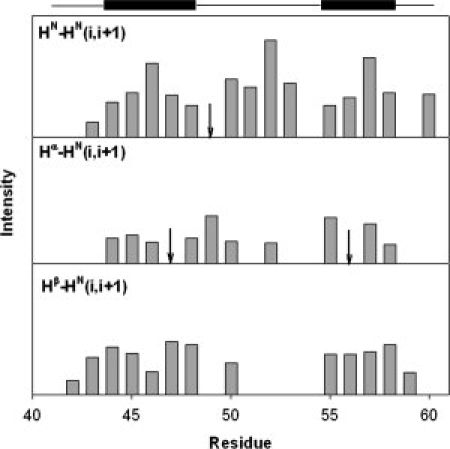
Summary of sequential NOEs observed for HP21 including HN-HN(i,i+1), Hα-HN(i,i+1) and Hβ-HN(i,i+1) obtained from a three-dimensional NOESY-HSQC spectrum of HP21. “↓” indicates that the corresponding NOEs were observed but their intensities could not be obtained accurately due to peak overlap. A schematic diagram of the boundaries of the helices in the NMR structure of HP36 (PDB entry 1VII) is shown at the top.
15N transverse relaxation rates R2 are frequently used to study the unfolded state of proteins because they are strongly influenced by local motions. A phenomenological model was developed by Schwalbe and coworkers to describe the R2 values of random coil polypeptide.48,49 In this model, an intrinsic relaxation rate Rint of an amide 15N nucleus and an apparent persistence length λ of the peptide chain are used to fit the experimental relaxation data. Completely unstructured peptides are expected to produce relatively uniform R2 values. Deviations from the predicted values often indicate the presence of hydrophobic clusters. Figure 8 shows the plot of the measured R2 values for HP21 and the values calculated using the random coil model excluding the two obvious outliers Phe51 and Thr54. The calculated R2 values are relatively uniform with an average value of 3.98 s−1. Most residues exhibit relatively uniform experimental values near the calculated random coil values, but several residues have R2 values which are obviously large. These include Leu42, Ser43, Phe51, Met53, Thr54, and Ala59. The observed deviations are significantly larger than the uncertainty in the experimental values. This suggests that these residues are involved in either local or long range contacts. The same R2 values were detected for 130 μM and 65 μM protein samples, strongly arguing that the effects are not due to self association, especially as ultracentrifugation studies at 150 μM give an apparent molecular weight which is in excellent agreement with true molecular weight.43 In the native state of HP36, several NOEs were observed involving the residues, which display large R2 values in HP21. These include NOEs between Phe51 and Leu42, Phe51 and Met53, Met53 and Thr54.9 NOEs between the aromatic protons of Phe51 and the δ protons of Leu42 were also observed in the 2D 1H-1H NOESY spectrum of HP21,44 indicating the Leu42 and Phe51 may be involved in the native like hydrophobic clustering in HP21.
Figure 8.

A plot of 15N R2 values for HP21 (○). The error bars were obtained from the nonlinear fitting of the experimental data with NMRViewJ. The solid line is the best fit to the phenomenological model of Schwalbe and coworkers.48 Experiments were conducted at 12°C, pH5.4 in 10 mM sodium acetate, 150 mM sodium chloride. Same results were obtained using 130 μM and 65 μM samples.
Discussion
The extensive chemical shift data reported here together with the calculations are consistent with a strong propensity to preferentially adopt native like backbone dihedral angles ϕ and ψ. It is striking how similar the details of the patterns of 13Cα, 13CO shifts, Δδ13Cα − Δδ13Cβ and SSP scores are for HP21 and HP36. Values for individual residues in HP21 are smaller in magnitude than those observed for HP36 but display virtually identical patterns. Consider for example, the plots of Δδ13Cα − Δδ13Cβ displayed in Figure 4. The first two residues before each α-helix display negative values with the residue immediately adjacent to the helix exhibiting smaller values. Exactly the same relative pattern is observed for HP21 and HP36. Furthermore the residues which display the largest positive deviations in HP36 do so in HP21 with the same rank order. The agreement in the pattern of SSP scores is also strikingly similar. The excellent agreement between the observed shifts of HP21 and those calculated for the native model reinforces these conclusions. These observations are supported by the NOE experiments which reveal an extensive set of native like backbone NOEs. Solid state NMR studies of the villin headpiece at low temperature in mixed water glycerol frozen glasses in the presence of denaturant suggest a propensity to sample helix structure in helix-2.50 However, it is very difficult to compare that study to the present work which was conducted under native conditions at 12°C.
As previously noted the helical structure found in HP21 is not due to an exceptionally high propensity for the individual helices to fold in isolation. The helices need to be stabilized by tertiary interactions and the R2 relaxation analysis identifies several likely candidates that could contribute, such as Leu42, Phe51, Met53, Thr54, and Ala59. At least some of the side-chains of these residues are close in the folded structure, including Phe51 and Leu42 as well as Phe51 and Met53.
Studies of several other small helical proteins have shown that preorganized secondary structure in the unfolded state plays an important role in the fast folding process.51–53 The propensity for native like backbone structure in the ensemble of HP21 observed here gives rise to the possibility that it could play a role in the fast folding of HP36 by restricting the initial conformational search. However if the free energy barrier is dominated by the need to form the third helix and dock it onto the HP21 motif then mutations which alter the denatured state structure in the region corresponding to HP21 need not significantly affect the folding rate. This scenario can arise if the structure is almost as well formed in the unfolded state as in the transition state. In this case mutations which alter the structure captured by our HP21 model would have little effect on the folding rate since the free energy level of the transition state and unfolded state would be perturbed by similar amount. This might offer an explanation for why a double Phe to Leu mutant of HP36 folds at virtually the same rate as wild type even though the mutations significantly reduce the structure in the unfolded state as judged by its effect on HP21.14,43
Finally we note that the presence of significant amount of structure in the unfolded state of HP36 can complicate φ-value analysis of the transition state for its folding. φ-values, defined as φ = ΔΔGTS/ΔΔG° where ΔΔGTS is the change in activation free energy and ΔΔG° is the change in stability, are traditionally viewed as representing the development of native like structure in the transition state. This quasi-structural analysis is valid when mutations do not perturb the free energy of the unfolded state. In contrast, small φ-values can arise for mutations which perturb the unfolded state even though they may have significant effects on the transition state.54 Thus potential unfolded state effects should be considered when interpreting mutational studies of the folding HP36, particularly as the measured φ-values for HP36 are all small.
Materials and Methods
Peptide/protein expression and purification
HP21 enriched with 15N, HP21 enriched with 15N and 13C, and HP36 enriched with 15N and 13C were prepared recombinantly as fusion peptides with the N-terminal domain of L9 (NTL9) in M9 minimal medium as described previously.44,55 The M9 minimal medium contains 0.8 g/L 15NH4Cl as the nitrogen source and 10 g/L 13C-glucose as the carbon source. The proteins were purified as previously described.55 3 mg pure HP21 was obtained from 1 L culture and 10 mg pure HP36 was obtained from 1 L culture.
NMR sample preparation
HP21 and HP36 samples for NMR experiments were prepared in 90% H2O/10% 2H2O with 10 mM sodium acetate and 150 mM sodium chloride (pH 5.4 for HP21 and pH 5.0 for HP36). The HP21 sample was prepared at a concentration of ∼100 μM to avoid self-association.43 The concentration of HP36 was ∼1 mM. 2,2-Dimethyl-2-silapentane-5-sulfonate sodium salt (DSS) was added as an internal reference (0.00 ppm) for both samples.
NMR spectroscopy
All NMR experiments on HP21 were conducted on a 500 MHz Bruker spectrometer with a cryoprobe at the New York Structural Biology Center at 12°C, and all NMR spectra for HP36 were recorded on 800 MHz Bruker spectrometer at 25°C. The 1H offset frequency was set at the water resonance and the 15N offset frequency was set at 118.0 ppm for all experiments.
The 15N-1H HSQC spectrum of 13C, 15N-labeled HP21 was collected with a matrix size of 1024 (1H) × 256 (15N), and the spectral widths were 5000 Hz (1H) × 1115 Hz (15N). The following triple-resonance experiments were conducted to generate 13C assignments: HNCA, HN(CO)CA, HNCO, and CBCA(CO)NH. All four of the triple-resonance experiments were collected with a matrix size of 1024 (1H) × 30 (15N) × 40 (13C). For the HNCA experiment, the 13C offset frequency was set at 54 ppm and the spectral widths were 5000 Hz (1H) × 1115 Hz (15N) × 2767 Hz (13C). For the HN(CO)CA experiment, the 13C offset frequency was also set at 54 ppm and the spectral widths were 7003 Hz (1H) × 1774 Hz (15N) × 4024 Hz (13C). For the HNCO experiment, the 13C offset frequency was set at 176 ppm and the spectrum was collected with spectral widths of 5000 Hz (1H) × 1115 Hz (15N) × 1887 Hz (13C). For the CBCA(CO)NH experiment, the 13C offset frequency was 39 ppm and the spectral widths were 5000 Hz (1H) × 1115 Hz (15N) × 8177 Hz (13C). The chemical shift assignments for the 1Hα, 1HN and backbone 15N resonances have been reported previously.44 A 3D 15N-1H NOESY-HSQC spectrum of 15N-labeled HP21 was collected with a matrix size of 1024 (1H) × 22 (15N) × 128 (1H), and the spectral widths were 5000 Hz (1H) × 1115 Hz (15N) × 5001 (1H); a mixing time of 300 ms was used.
For 13C, 15N-labeled HP36, a 15N-1H HSQC spectrum was collected with a matrix size of 1024 (1H) × 256 (15N), and the spectral widths were 9615 Hz (1H) × 2433 Hz (15N). The following triple-resonance experiments were conducted to generate 13C assignments: HNCO, CBCA(CO)NH, and (H)CC(CO)NH. A HNCO spectrum was collected with a matrix size of 1024 (1H) × 40 (15N) × 64 (13C) and spectral widths of 9615 Hz (1H) × 2433 Hz (15N) × 5031 Hz (13C). CBCA(CO)NH was collected with a matrix size of 1024 (1H) × 40 (15N) × 128 (13C) and spectral widths 9615 Hz (1H) × 2433 Hz (15N) × 13,078 Hz (13C). (H)CC(CO)NH was collected with a matrix size of 1024 (1H) × 40 (15N) × 128 (13C) and spectral widths 9615 Hz (1H) × 2433 Hz (15N) × 15090 Hz (13C). A HBHACONH experiment was conducted to generate 1Hα and 1Hβ chemical shifts. The HBHACONH spectrum was collected with a matrix size of 1024 (1H) × 40 (15N) × 128 (1H) and spectral widths 9615 Hz (1H) × 2433 Hz (15N) × 5601 Hz (1H).
The R2 relaxation experiments conducted with HP21 were carried out as described.56 The R2 relaxation time were set to 16.64, 33.28, 49.92, 66.56, 83.20, 99.84, 116.48, 133.12, and 149.76 ms. The spectra were collected with a matrix size of 1024 (1H) x 256 (15N) and spectral widths 5000 Hz (1H) × 1267 Hz (15N). A recycle delay of 3 s was used. Experiments were conducted at two protein concentrations, 130 μM and 65 μM to test for any potential self association. The R2 values were the same for both samples.
Data processing and analysis
Data were processed with the NMRPipe software package developed by Delaglio and coworkers, and the chemical shifts were analyzed with the NMRViewJ software package developed by Johnson and coworkers.57,581H chemical shifts were referenced to DSS directly, 15N, 13C chemical shifts were indirectly referenced using standard methods. The random coil values of Wishart et al. were used to calculate the secondary shifts.45 The SSP program developed by Forman-Kay and coworkers (http://pound.med.utoronto.ca/software.html) was used to calculate SSP scores for HP21 and HP36.47 Structure based calculations of chemical shifts for HP21 and HP36 were obtained using the SHIFTS program of Xu and Case (http://casegroup.rutgers.edu/qshifts/qshifts.htm),59,60 and the SHIFTX program of Wishart and coworkers (http://redpoll.pharmacy.ualberta.ca/shiftx/).61 The “native model” of HP21 was generated by taking residues 41–61 of the X-ray structure determined by Bi et al.33 This is a structure of a K70M mutant of HP36. The file used for the calculations includes an in silico mutation of the Met back to Lys: Met70 was replaced by a Lys with χ1, χ2 set to the same values as those for Met70, and χ3, χ4 set to 180°. 15N transverse relaxation rates R2 were calculated with NMRViewJ by fitting the peak intensities to two-parameter monoexponential decay shown in Eq. (1):
| (1) |
where I(t) is the peak intensity after a delay of time t and I0 is the intensity at the time point t = 0. The R2 rates were analyzed using a simple model by fitting the experimental R2 rates to Eq. (2):
 |
(2) |
where R2(i) is the experimental R2 value for residue i, R2(int) is the intrinsic relaxation rate of the chain which depends on the temperature and the viscosity of the solution, N is the chain length, and λ is related to the apparent persistence length of the chain.49
Acknowledgments
The authors thank Ms. Lauren Wickstrom for helpful discussions and assistance with the chemical shift calculations and Mr. Vadim Patsalo for assistance with the chemical shift calculations.
Glossary
Abbreviations:
- DSS
2,2-Dimethyl-2-silapentane-5-sulfonate sodium salt
- HP21
21-residue peptide starting from the N-terminus of HP36
- HP36
the villin headpiece helical subdomain corresponding to residues 791–825 of chicken villin and residues 42–76 of the chicken villin headpiece domain with an additional Met at the N-terminus.
References
- 1.Wright PE, Dyson HJ, Lerner RA. Conformation of peptide fragments of protein in aqueous solution: implications for initiation of protein folding. Biochemistry. 1988;27:7167–7175. doi: 10.1021/bi00419a001. [DOI] [PubMed] [Google Scholar]
- 2.Ferguson N, Fersht AR. Early events in protein folding. Curr Opin Struct Biol. 2003;13:75–81. doi: 10.1016/s0959-440x(02)00009-x. [DOI] [PubMed] [Google Scholar]
- 3.Munoz V, Serrano L. Local versus nonlocal interactions in protein folding and stability: an experimentalist's point of view. Folding Des. 1996;1:R71–R78. doi: 10.1016/S1359-0278(96)00036-3. [DOI] [PubMed] [Google Scholar]
- 4.Baldwin RL. A new perspective on unfolded proteins. Adv Protein Chem. 2002;62:361–367. doi: 10.1016/s0065-3233(02)62014-5. [DOI] [PubMed] [Google Scholar]
- 5.Dill KA, Shortle D. Denatured states of proteins. Annu Rev Biochem. 1991;60:795–825. doi: 10.1146/annurev.bi.60.070191.004051. [DOI] [PubMed] [Google Scholar]
- 6.Viguera AR, Villegas V, Aviles FX, Serrano L. Favorable native-like helical local interactions can accelerate protein folding. Folding Des. 1997;2:23–33. doi: 10.1016/S1359-0278(97)00003-5. [DOI] [PubMed] [Google Scholar]
- 7.Plaxco KW, Simons KT, Baker D. Contact order, transition state placement and the refolding rates of single domain proteins. J Mol Biol. 1998;277:985–994. doi: 10.1006/jmbi.1998.1645. [DOI] [PubMed] [Google Scholar]
- 8.McKnight CJ, Doering DS, Matsudaira PT, Kim PS. A thermostable 35-residue subdomain within villin headpiece. J Mol Biol. 1996;260:126–134. doi: 10.1006/jmbi.1996.0387. [DOI] [PubMed] [Google Scholar]
- 9.McKnight CJ, Matsudaira PT, Kim PS. NMR structure of the 35-residue villin headpiece subdomain. Nat Struct Biol. 1997;4:180–184. doi: 10.1038/nsb0397-180. [DOI] [PubMed] [Google Scholar]
- 10.Vardar D, Buckley DA, Frank BS, McKnight CJ. NMR structure of an F-actin-binding “headpiece” motif from villin. J Mol Biol. 1999;294:1299–1310. doi: 10.1006/jmbi.1999.3321. [DOI] [PubMed] [Google Scholar]
- 11.Chiu TK, Kubelka J, Herbst-Irmer R, Eaton WA, Hofrichter J, Davies DR. High-resolution x-ray crystal structures of the villin headpiece subdomain, an ultrafast folding protein. Proc Natl Acad Sci USA. 2005;102:7517–7522. doi: 10.1073/pnas.0502495102. [DOI] [PMC free article] [PubMed] [Google Scholar]
- 12.Wang M, Tang Y, Sato S, Vugmeyster L, McKnight CJ, Raleigh DP. Dynamic NMR line-shape analysis demonstrates that the villin headpiece subdomain folds on the microsecond time scale. J Am Chem Soc. 2003;125:6032–6033. doi: 10.1021/ja028752b. [DOI] [PubMed] [Google Scholar]
- 13.Kubelka J, Eaton WA, Hofrichter J. Experimental tests of villin subdomain folding simulations. J Mol Biol. 2003;329:625–630. doi: 10.1016/s0022-2836(03)00519-9. [DOI] [PubMed] [Google Scholar]
- 14.Brewer SH, Vu DM, Tang Y, Li Y, Franzen S, Raleigh DP, Dyer RB. Effect of modulating unfolded state structure on the folding kinetics of the villin headpiece subdomain. Proc Natl Acad Sci USA. 2005;102:16662–16667. doi: 10.1073/pnas.0505432102. [DOI] [PMC free article] [PubMed] [Google Scholar]
- 15.Islam SA, Karplus M, Weaver DL. Application of the diffusion-collision model to the folding of three-helix bundle proteins. J Mol Biol. 2002;318:199–215. doi: 10.1016/S0022-2836(02)00029-3. [DOI] [PubMed] [Google Scholar]
- 16.Duan Y, Kollman PA. Pathways to a protein folding intermediate observed in a 1-microsecond simulation in aqueous solution. Science. 1998;282:740–744. doi: 10.1126/science.282.5389.740. [DOI] [PubMed] [Google Scholar]
- 17.Duan Y, Wang L, Kollman PA. The early stage of folding of villin headpiece subdomain observed in a 200-nanosecond fully solvated molecular dynamics simulation. Proc Natl Acad Sci USA. 1998;95:9897–9902. doi: 10.1073/pnas.95.17.9897. [DOI] [PMC free article] [PubMed] [Google Scholar]
- 18.Sullivan DC, Kuntz ID. Protein folding as biased conformational diffusion. J Phys Chem B. 2002;106:3255–3262. [Google Scholar]
- 19.Shen MY, Freed KF. All-atom fast protein folding simulations: the villin headpiece. Proteins: Struct Funct Genet. 2002;49:439–445. doi: 10.1002/prot.10230. [DOI] [PubMed] [Google Scholar]
- 20.Srinivas G, Bagchi B. Folding and unfolding of chicken villin headpiece: energy landscape of a single-domain model protein. Curr Sci. 2002;82:179–185. [Google Scholar]
- 21.Fernandez A, Shen MY, Colubri A, Sosnick TR, Berry RS, Freed KF. Large-scale context in protein folding: villin headpiece. Biochemistry. 2003;42:664–671. doi: 10.1021/bi026510i. [DOI] [PubMed] [Google Scholar]
- 22.Zagrovic B, Snow CD, Shirts MR, Pande VS. Simulation of folding of a small α-helical protein in atomistic detail using worldwide-distributed computing. J Mol Biol. 2002;323:927–937. doi: 10.1016/s0022-2836(02)00997-x. [DOI] [PubMed] [Google Scholar]
- 23.Zagrovic B, Snow C, Khaliq S, Shirts M, Pande V. Native-like mean structure in the unfolded ensemble of small proteins. J Mol Biol. 2002;323:153–164. doi: 10.1016/s0022-2836(02)00888-4. [DOI] [PubMed] [Google Scholar]
- 24.Lin CY, Hu CK, Hansmann UHE. Parallel tempering simulations of HP-36. Proteins: Struct Funct Genet. 2003;52:436–445. doi: 10.1002/prot.10351. [DOI] [PubMed] [Google Scholar]
- 25.He JB, Zhang ZY, Shi YY, Liu HY. Efficiently explore the energy landscape of proteins in molecular dynamics simulations by amplifying collective motions. J Chem Phys. 2003;119:4005–4017. [Google Scholar]
- 26.Jang SM, Kim E, Shin S, Pak Y. Ab initio folding of helix bundle proteins using molecular dynamics simulations. J Am Chem Soc. 2003;125:14841–14836. doi: 10.1021/ja034701i. [DOI] [PubMed] [Google Scholar]
- 27.van der Spoel D, Lindahl E. Brute-force molecular dynamics simulations of villin headpiece: comparison with NMR parameters. J Phy Chem B. 2003;107:11178–11187. [Google Scholar]
- 28.Ripoll DR, Vila JA, Scheraga HA. Folding of the villin headpiece subdomain from random structures. Analysis of the charge distribution as a function of Ph. J Mol Biol. 2004;339:915–925. doi: 10.1016/j.jmb.2004.04.002. [DOI] [PubMed] [Google Scholar]
- 29.Kim SY, Lee J, Lee J. Folding simulations of small proteins. Biophys Chem. 2005;115:195–200. doi: 10.1016/j.bpc.2004.12.040. [DOI] [PubMed] [Google Scholar]
- 30.De Mori GMS, Colombo G, Micheletti C. Study of the villin headpiece folding dynamics by combining coarse-grained Monte Carlo evolution and all-atom molecular dynamics. Proteins: Struct Funct Bioinf. 2005;58:459–471. doi: 10.1002/prot.20313. [DOI] [PubMed] [Google Scholar]
- 31.De Mori GMS, Micheletti C, Colombo G. All-atom folding simulations of the villin headpiece from stochastically selected coarse-grained structure. J Phys Chem B. 2004;108:12267–12270. [Google Scholar]
- 32.Godoy-Ruiz R, Henry ER, Kubelka J, Hofrichter J, Munoz V, Sanchez-Ruiz JM, Eaton WA. Estimating free energy barrier heights for an ultrafast folding protein from calorimetric and kinetic data. J Phys Chem B. 2008;112:5938–5949. doi: 10.1021/jp0757715. [DOI] [PubMed] [Google Scholar]
- 33.Bi Y, Cho JH, Kim EY, Shan B, Schindelin H, Raleigh DP. Rational design, structural and thermodynamic characterization of a hyperstable variant of the villin headpiece helical subdomain. Biochemistry. 2007;46:7497–7505. doi: 10.1021/bi6026314. [DOI] [PubMed] [Google Scholar]
- 34.Ensign DL, Kasson PM, Pande VS. Heterogeneity even at the speed limit of folding: large-scale molecular dynamics study of a fast-folding variant of the villin headpiece. J Mol Biol. 2007;374:806–816. doi: 10.1016/j.jmb.2007.09.069. [DOI] [PMC free article] [PubMed] [Google Scholar]
- 35.Hansmann UHE. Protein-folding simulations in generalized ensembles. Int J Quant Chem. 2002;90:1515–1521. [Google Scholar]
- 36.Jayachandran G, Vishal V, Garcia AE, Pande VS. Local structure formation in simulations of two small proteins. J Struct Biol. 2007;157:491–499. doi: 10.1016/j.jsb.2006.10.001. [DOI] [PMC free article] [PubMed] [Google Scholar]
- 37.Lei HX, Duan Y. Two-stage folding of HP-35 from ab initio simulations. J Mol Biol. 2007;370:196–206. doi: 10.1016/j.jmb.2007.04.040. [DOI] [PMC free article] [PubMed] [Google Scholar]
- 38.Micheletti C, Colombo G. Study of the villin headpiece folding dynamics by combining coarse-grained Monte Carlo evolution and all-atom molecular dynamics (vol 58, pg 459, 2005) Proteins: Struct Funct Bioinf. 2008;70:309. doi: 10.1002/prot.20313. [DOI] [PubMed] [Google Scholar]
- 39.Mukherjee A, Bagchi B. Correlation between rate of folding, energy landscape, and topology in the folding of a model protein HP-36. J Chem Phys. 2003;118:4733–4747. [Google Scholar]
- 40.Piana S, Laio A, Marinelli F, Van Troys M, Bourry D, Ampe C, Martins JC. Predicting the effect of a point mutation on a protein fold: the villin and advillin headpieces and their Pro62Ala mutants. J Mol Biol. 2008;375:460–470. doi: 10.1016/j.jmb.2007.10.020. [DOI] [PubMed] [Google Scholar]
- 41.Wei Y, Nadler W, Hansmann UHE. Backbone and side-chain ordering in a small protein. J Chem Phys. 2008;128:025105. doi: 10.1063/1.2819679. [DOI] [PubMed] [Google Scholar]
- 42.Yang JS, Wallin S, Shakhnovich EI. Universality and diversity of folding mechanics for three-helix bundle proteins. Proc Natl Acad Sci USA. 2008;105:895–900. doi: 10.1073/pnas.0707284105. [DOI] [PMC free article] [PubMed] [Google Scholar]
- 43.Tang YF, Rigotti DJ, Fairman R, Raleigh DP. Peptide models provide evidence for significant structure in the denatured state of a rapidly folding protethe villin headpiece subdomain. Biochemistry. 2004;43:3264–3272. doi: 10.1021/bi035652p. [DOI] [PubMed] [Google Scholar]
- 44.Tang YF, Goger MJ, Raleigh DP. NMR characterization of a peptide model provides evidence for significant structure in the unfolded state of the villin headpiece helical subdomain. Biochemistry. 2006;45:6940–6946. doi: 10.1021/bi052484n. [DOI] [PubMed] [Google Scholar]
- 45.Wishart DS, Bigam CG, Holm A, Hodges RS, Sykes BD. 1H, 13C and 15N random coil NMR chemical shifts of the common amino acids. I Investigations of nearest-neighbor effects. J Biol NMR. 1995;5:67–81. doi: 10.1007/BF00227471. [DOI] [PubMed] [Google Scholar]
- 46.Spera S, Bax A. Empirical correlation between protein backbone conformation and Cα and Cβ 13C nuclear magnetic resonance chemical shifts. J Am Chem Soc. 1991;113:5490–5492. [Google Scholar]
- 47.Marsh JA, Singh VK, Jia Z, Forman-Kay JD. Sensitivity of secondary structure propensities to sequence differences between α- and γ-synucleimplications for fibrillation. Protein Sci. 2006;15:2795–2804. doi: 10.1110/ps.062465306. [DOI] [PMC free article] [PubMed] [Google Scholar]
- 48.Klein-Seetharaman J, Oikawa M, Grimshaw SB, Wirmer J, Duchardt E, Ueda T, Imoto T, Smith LJ, Dobson CM, Schwalbe H. Long-range interactions within a nonnative protein. Science. 2002;295:1719–1722. doi: 10.1126/science.1067680. [DOI] [PubMed] [Google Scholar]
- 49.Schwalbe HF, Fiebig KM, Buck M, Jones JA, Grimshaw SB, Spencer A, Glaser SJ, Smith LJ, Dobson CM. Structural and dynamical properties of a denatured protein. Heteronuclear 3D NMR experiments and theoretical simulations of lysozyme in 8 M urea Biochemistry. 1997;36:8977–8991. doi: 10.1021/bi970049q. [DOI] [PubMed] [Google Scholar]
- 50.Havlin RH, Tycko R. Probing site-specific conformational distributions in protein folding with solid-state NMR. Proc Natl Acad Sci USA. 2005;102:3284–3289. doi: 10.1073/pnas.0406130102. [DOI] [PMC free article] [PubMed] [Google Scholar]
- 51.Myers JK, Oas TG. Preorganized secondary structure as an important determinant of fast protein folding. Nat Struct Biol. 2001;8:552–558. doi: 10.1038/88626. [DOI] [PubMed] [Google Scholar]
- 52.Ferguson N, Shape TD, Schartau PJ, Sato S, Allen MD, Johnson CM, Rutherford TJ, Fersht AR. Ultra-fast barrier-limited folding in the peripheral subunit-binding domain family. J Mol Biol. 2005;353:427–446. doi: 10.1016/j.jmb.2005.08.031. [DOI] [PubMed] [Google Scholar]
- 53.Chowdhury S, Lei HX, Duan Y. Denatured-state ensemble and the early -stage folding of the G29A mutant of the B-domain of protein A. J Phys Chem B. 2005;109:9073–9081. doi: 10.1021/jp0449814. [DOI] [PubMed] [Google Scholar]
- 54.Cho JH, Raleigh DP. Denatured state effects and the origin of nonclassical phi values in protein folding. J Am Chem Soc. 2006;128:16492–16493. doi: 10.1021/ja0669878. [DOI] [PubMed] [Google Scholar]
- 55.Bi Y, Tang Y, Raleigh DP, Cho J. Efficient high level expression of peptides and proteins as fusion proteins with the N-terminal domain of L9: application to the villin headpiece helical subdomain. Protein Expression Purif. 2006;47:234–240. doi: 10.1016/j.pep.2005.10.023. [DOI] [PubMed] [Google Scholar]
- 56.Farrow NA, Muhandiram R, Singer AU, Pascal SM, Kay CM, Gish G, Shoelson SE, Pawson T, Forman-Kay JD, Kay LE. Backbone dynamics of a free and a phosphopeptide-complexed Src homology 2 domain studied by 15N NMR relaxation. Biochemistry. 1994;33:5984–6003. doi: 10.1021/bi00185a040. [DOI] [PubMed] [Google Scholar]
- 57.Delaglio F, Grzesiek S, Vuister GW, Zhu G, Pfeifer J, Bax A. NMRPipe-a multi-dimensional spectral processing system based on Unix Pipes. J Biomol NMR. 1995;6:277–293. doi: 10.1007/BF00197809. [DOI] [PubMed] [Google Scholar]
- 58.Johnson BA. Using NMRView to visualize and analyze NMR spectra of macromolecules. Methods Mol Biol. 2004;278:313–352. doi: 10.1385/1-59259-809-9:313. [DOI] [PubMed] [Google Scholar]
- 59.Xu XP, Case DA. Automated prediction of 15N, 13Cα, 13Cβ and 13C' chemical shifts in proteins using a density functional database. J Biomol NMR. 2001;21:321–333. doi: 10.1023/a:1013324104681. [DOI] [PubMed] [Google Scholar]
- 60.Xu XP, Case DA. Probing multiple effects on 15N, 13Cα, 13Cβ and 13C' chemical shifts in peptides using density functional theory. Biopolymers. 2002;65:408–423. doi: 10.1002/bip.10276. [DOI] [PubMed] [Google Scholar]
- 61.Neal S, Nip AM, Zhang H, Wishart DS. Rapid and accurate calculation of protein 1H, 13C, and 15N chemical shifts. J Biomol NMR. 2003;26:215–240. doi: 10.1023/a:1023812930288. [DOI] [PubMed] [Google Scholar]