Crystals of palindromic SBE DNA-bound Smad1 MH1 domain diffracting to 2.7 Å resolution have been obtained.
Keywords: Smad1 MH1 domain, Smad-binding element
Abstract
The bone morphogenetic protein (BMP) signalling pathway regulates diverse processes such as cell differentiation, anterior/posterior axis specification, cell growth and the formation of extra-embryonic tissues. The transcription factor Smad1 relays the BMP signal from the cytoplasm to the nucleus, where it binds short DNA-sequence motifs and regulates gene expression. However, how Smad1 selectively targets particular genomic regions is poorly understood. In order to understand the physical basis of the specific interaction of Smad1 with DNA and to contrast it with the highly homologous but functionally distinct Smad3 protein, the DNA-binding Mad-homology 1 (MH1) domain of Smad1 was cocrystallized with a 17-mer palindromic Smad-binding element (SBE). The extensive optimizations of the length, binding-site spacing and terminal sequences of the DNA element in combination with the other crystallization parameters necessary for obtaining diffraction-quality crystals are described here. A 2.7 Å resolution native data set was collected at the National Synchrotron Radiation Research Centre, Taiwan, from crystals grown in a solution containing 0.2 M ammonium tartrate dibasic, 20% PEG 3350, 3% 2-propanol and 10% glycerol. The data set was indexed and merged in space group P222, with unit-cell parameters a = 73.94, b = 77.49, c = 83.78 Å, α = β = γ = 90°. The solvent content in the unit cell is consistent with the presence of two Smad1 MH1 molecules bound to the duplex DNA in the asymmetric unit.
1. Introduction
The transforming growth factor β (TGF-β) superfamily of cytokines regulates cell migration, proliferation, differentiation and apoptosis of different cell types in multicellular organisms. TGF-β superfamily members such as TGF-β, BMP, activin and nodal bind to distinct sets of type I and type II receptors on the cell surface, leading to stimulation of the serine/threonine kinase activity of the type I receptors (Massagué, 1998 ▶). The activated receptor phosphorylates Smad (homologue of mothers against decapentaplegic and Sma proteins) proteins, leading to the formation of homotrimers (Wu et al., 2001 ▶) as well as heterotrimers consisting of two regulatory R-Smads (such as Smad1, Smad2, Smad3, Smad5 or Smad8) and one generic Co-Smad termed Smad4 (Chacko et al., 2004 ▶).
Smad proteins consist of two globular domains, MH1 and MH2, connected by a variable-length linker region. The N-terminal MH1 domain confers the DNA-binding activity, while the C-terminal MH2 domain mediates Smad multimerization and facilitates transactivation (Fortuno et al., 2001 ▶; Inman, 2005 ▶).
The crystal structure of the Smad3 MH1 domain bound to palindromic SBE revealed that the MH1 domain binds the major groove of the DNA through a short β-hairpin and that the amino acids involved in specific DNA recognition are highly conserved within the Smad family (Shi et al., 1998 ▶; Makkar et al., 2009 ▶). Nevertheless, biochemical assays suggest that Smad3 and Smad4 bind to a short GTCT element called the Smad-binding element (SBE; Zawel et al., 1998 ▶), while BMP-responsive Smads (such as Smad1) preferably bind to a distinct GC-rich element (Karaulanov et al., 2004 ▶). Hence, the available Smad3 structure and amino-acid comparisons do not explain how BMP and TGF-β Smads target different genomic regions and elicit antagonistic biological responses (Yamamoto et al., 2009 ▶).
In order to understand the selective DNA-binding mechanism underlying the distinct functions of BMP Smads compared with TGF-β Smads, we have crystallized and are attempting to solve the structure of the Smad1 MH1 domain in complex with the palindromic SBE DNA element.
2. Experimental procedures
2.1. Cloning techniques
The MH1 domain spanning amino acids 1–143 of the full-length mouse Smad1 protein was PCR-amplified from the Smad1 cDNA (IMAGE:6811514) using the primers 5′-GGGGACAAGTTTGTACAAAAAAGCAGGCTTCGAAAACCTGTATTTTCAGGGCATGAATGTGACCAGCTTGTTTTC-3′ and 5′-GGGGACCACTTTGTACAAGAAAGCTGGGTTTAGTGCCTCGGAACCAGCAC-3′ containing attB sites and a tobacco etch virus (TEV) protease-cleavage site preceding the coding sequence. The PCR product was cloned into the entry vector pDONR221 using Gateway BP technology (Invitrogen). The resulting entry vector pENTR-Smad1-MH1 was verified by sequencing and the insert was transferred into the destination vector pETG60A (De Marco et al., 2004 ▶) encoding a NusAHis6-fusion tag using Gateway LR cloning technology (Invitrogen).
2.2. Protein production and purification
The pETG60A-Smad1-MH1 expression plasmid was transformed into Escherichia coli BL21 (DE3) cells (Invitrogen) and the transformed cells were grown at 310 K in Luria–Bertani broth containing 100 µg ml−1 ampicillin until an OD600 of 0.6 was reached. The culture was induced with 0.2 mM IPTG and then grown continuously at 298 K for 5 h. The cells were then pelleted by centrifugation and stored at 193 K.
The cells were thawed, resuspended in buffer A (50 mM Tris–HCl pH 8.0, 300 mM NaCl) and sonicated on ice for 15 min. The soluble fraction was separated from the cell debris by centrifugation and further clarified by filtration using a 0.22 µm filter. The fusion protein was isolated from the crude protein mixture by immobilized metal-affinity chromatography using 5 ml His-Trap columns (GE Healthcare) equilibrated with buffer A. The His-Trap-bound fusion protein was eluted with buffer B (50 mM Tris–HCl pH 8.0, 300 mM NaCl, 300 mM imidazole) and immediately desalted into buffer C (10 mM Tris–HCl pH 8.0, 100 mM NaCl) to reduce the salt concentration and remove imidazole using a prepacked HiPrep 26/10 desalting column. The NusAHis6-fusion tag was removed from the Smad1 MH1 protein by TEV digestion, which was performed using a 1:50(w:w) protease:substrate protein ratio. The cleaved Smad1 MH1 protein was further purified by ion-exchange chromatography using a 6 ml Resource S column (GE Healthcare) pre-equilibrated with buffer D (10 mM Tris–HCl pH 8.0, 100 mM NaCl, 2 mM TCEP) and eluted by gradually increasing the NaCl concentration to 1 M. TCEP was included in the buffer to prevent the formation of disulfide bonds between the six cysteines present in the Smad1 MH1 protein. Finally, the Smad1 MH1 protein was subjected to size-exclusion chromatography using a Superdex-75 16/60 column (GE Healthcare) pre-equilibrated in buffer D. All column-chromatography steps were carried out using the ÄKTAxpress (GE Healthcare) system. The fractions containing Smad1 MH1 were pooled and concentrated to 16 mg ml−1 using a membrane-based concentrator with a molecular-weight cutoff of 5000 Da (Sartorius). The protein was flash-frozen using liquid nitrogen and stored at 193 K.
2.3. Crystallization of Smad1 MH1 with DNA
Polyacrylamide gel electrophoresis (PAGE)-purified deprotected single-stranded DNA oligomers were purchased at a 1 mM concentration (Proligo, Sigma–Aldrich). Equimolar amounts of complementary DNA were mixed and heated to 358 K, slowly cooled at a rate of 0.5 K min−1 to 298 K in a thermocycler and stored at 243 K. Smad1 MH1 was mixed with the annealed DNA in a molar ratio of 2:1.2 and incubated for 4 h on ice. The Smad1 MH1–DNA complex was concentrated to 17 mg ml−1 as estimated using the Bradford reagent (Bio-Rad). Crystallization trials were set up using the sitting-drop vapour-diffusion technique. Crystallization conditions were screened in a 96-well format using a liquid-dispensing robot (Innovadyne) and crystallization screens purchased from Hampton Research and Qiagen by combining 200 nl protein with 200 nl reservoir solution and equilibrating over 50 µl reservoir solution.
2.4. X-ray data collection and processing
Initial X-ray diffraction tests were performed using a PLATINUM 135 CCD detector with focused Cu Kα X-rays from an X8 PROTEUM rotating-anode generator (Bruker AXS) controlled using the PROTEUM2 software (Sheldrick, 2008 ▶). A 2.7 Å resolution native data set was collected on the BL13B1 beamline at the National Synchrotron Radiation Research Centre (NSRRC, Taiwan) equipped with an ADSC Quantum-315 CCD area detector at 105 K and λ = 1.00 Å. A total of 341 images were collected with an oscillation angle of 0.5°. The data set was integrated, merged and scaled using the HKL-2000 software (Otwinowski & Minor, 1997 ▶).
2.5. Electrophoretic mobility shift assay
100 nM Smad1 MH1 protein was incubated with 1 nM Cy5-labelled DNA for 1 h at 277 K in EMSA buffer (20 mM Tris–HCl pH 8.0, 0.1 mg ml−1 bovine serum albumin, 50 µM ZnCl2, 100 mM KCl, 10% glycerol, 0.1% NP-40 and 2 mM β-mercaptoethanol). The bound protein–DNA complex was further incubated with 2 µM unlabelled competitor DNA elements in a 10 µl reaction volume for 1 h. The final reaction mixture was loaded onto a 10% native polyacrylamide gel using 1×TG (25 mM Tris pH 8.3, 192 mM glycine) as the electrophoresis buffer. The gel was run at 200 V for 20 min at 277 K and subsequently imaged using a Typhoon phosphor-imaging scanner.
3. Results and discussion
3.1. Protein preparation and assembly of the protein–DNA complex
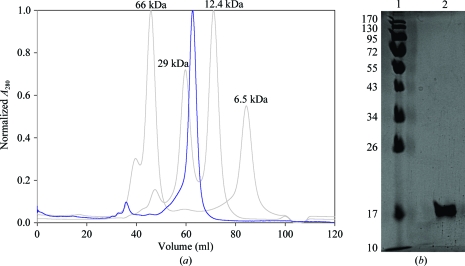
The expression of Smad1 MH1 protein was optimal when induced at 298 K with 0.2 mM IPTG compared with protein expression at 290 and 303 K. The Smad1 MH1 protein could be expressed in a soluble form in E. coli, with typical yields of ∼1.5 mg pure protein per litre of bacterial expression culture. The purified protein eluted as a single symmetric peak from the Superdex-75 gel-filtration column consistent with the molecular weight of the Smad1 MH1 monomer (16.482 kDa; Fig. 1 ▶ a). SDS–PAGE indicated >95% purity after the final purification step (Fig. 1 ▶ b).
Figure 1.
Elution profile of Smad1 MH1 (blue) run on a Superdex 75 gel-filtration column calibrated with molecular-weight standards (grey) and purified protein run on an SDS–PAGE gel. (a) Smad1 MH1 elutes as a single symmetric peak consistent with a molecular weight of ∼16 kDa. (b) 12% SDS–PAGE analysis showing molecular-weight markers (lane 1; kDa) and a pure Smad1 MH1 protein band (lane 2).
The 4 bp Smad-binding element (SBE) GTCT was used in the form of a palindrome to prepare the protein–DNA complex. Since two monomers of the Smad1 MH1 domain bind the palindromic SBE DNA element, a 2:1.2 molar ratio of protein to DNA was mixed and incubated on ice for 4 h before crystallization setup. An excess of DNA was added to the protein–DNA complex owing to the incomplete annealing of the DNA duplex.
3.2. Crystallization
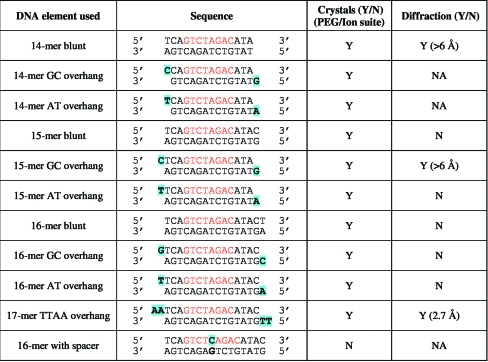
Screening for crystallization conditions was carried out in 96-well Innovadyne sitting-drop plates using the PEG/Ion suite (Hampton Research) and the PEG I and PEG II suites (Qiagen). Initial crystal hits were obtained using a complex of a 15-mer blunt-ended SBE DNA element with Smad1 MH1 at 291 K. The presence of protein and DNA in the crystal was confirmed by analyzing dissolved crystals using SDS–PAGE and 1% agarose gel electrophoresis as explained in Ng et al. (2008 ▶) (data not shown). All initial crystal optimizations were carried out in a 96-well format and liquids were dispensed using the Innovadyne robot. However, no diffracting crystals were obtained using the blunt-ended 15-mer SBE DNA complexed with Smad1 MH1. Addition of divalent ions (MgCl2 and ZnCl2) to the protein–DNA complex prior to crystallization setup did not improve the quality of the crystals formed. Hence, we extensively tested the effects of DNA overhangs, DNA length and binding sequence on the crystallization results and diffraction power of the crystals (summarized in Fig. 2 ▶).
Figure 2.
Summary of DNA elements used.
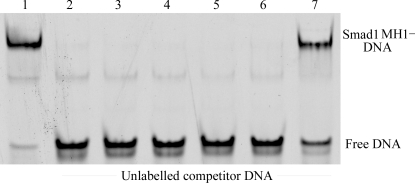
The sizes of the DNA elements were altered, ranging from 14 to 17 bp. Complementary overhangs (A–T and G–C) were added to the 5′ end of the complementary strands, which may assist in the stacking of DNA in the crystal lattice and lead to diffraction-quality crystals. The binding of the Smad1 MH1 domain to the altered DNA elements was confirmed using a competition-based electrophoretic mobility shift assay (EMSA; Fig. 3 ▶). The PEG/Ion suite (Hampton Research) was used as the primary screen to test for improved crystallization when different DNA elements were used. The Smad1 MH1 complexes with 14-mer, 15-mer and 16-mer DNA with G–C overhangs produced flat plate-like crystals, whereas SBEs with blunt ends or A–T overhangs formed rod-like crystals. Interestingly, when a single base-pair spacer was inserted into the blunt-ended 15-mer SBE DNA between the two GTCT elements (16-mer with spacer sequence given in Fig. 2 ▶), no crystal formation was observed. The crystals of Smad1 MH1–17-mer SBE with TT–AA overhang (SEB17-TTAA) showed initial weak diffraction to 10–17 Å resolution. We therefore selected this DNA element for further optimizations using additive screening (Hampton Research).
Figure 3.
100 nM Smad1 MH1 domain was bound to 1 nM 5′-Cy5-labelled 15-mer SBE DNA (lane 1). The bound protein–DNA complex was incubated with 2 µM unlabelled competitor DNA: 14-mer blunt SBE, 15-mer blunt SBE (positive control for complete competition), 16-mer blunt SBE, 17-mer TTAA overhang SBE and 16-mer SBE with spacer (lanes 2–6). An oligonucleotide with the mutated SBE sequence TCATCTGATTTATACT was used as a negative control (lane 7).
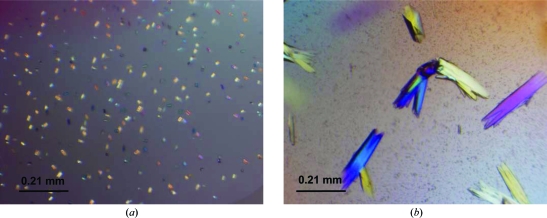
Smad1 MH1–SBE17-TTAA crystals grown in the presence of 0.2 M ammonium tartrate dibasic, 20% PEG 3350 supplemented with 3% 2-propanol diffracted to 6 Å resolution at room temperature. Temperature optimization was carried out by growing crystals at 277, 288, 291 and 298 K. We observed the growth of microcrystals at 277 K (Fig. 4 ▶ a), poorly diffracting crystals at 288 K and better diffracting crystals (∼6 Å) at 291 and 298 K. The crystals were grown at 291 K in further optimizations, as these crystals had sharper edges and grew slightly larger than their counterparts grown at 298 K (Fig. 4 ▶ b).
Figure 4.
Smad1 MH1–SBE17-TTAA overhang crystals. (a) Microcrystals grown at 277 K. (b) Rod-like crystals grown at 291 K that diffracted to 2.7 Å resolution.
Systematic testing of crystals for X-ray diffraction at room temperature and at nitrogen-stream cryogenic temperature showed that cryofreezing greatly reduced the diffraction power of the crystals. Soaking the crystals in 10–20% glycerol as a cryoprotectant did not prevent the reduction of the diffraction limits upon freezing. Surprisingly, crystals grown in the presence of 10% glycerol in the mother liquor showed improved diffraction under the cryostream to ∼3 Å using in-house X-ray diffraction facilities. Diffraction-quality crystals were obtained in the presence of 0.2 M ammonium tartrate dibasic, 20% PEG 3350, 3% 2-propanol as an additive and 10% glycerol as a cryoprotectant. Consequently, crystals were grown in bulk, harvested within 2 d, flash-frozen and stored in liquid nitrogen for data collection using synchrotron radiation.
3.3. Data collection
A 2.7 Å native data set was collected at the National Synchrotron Research Centre (NSRRC, Taiwan) and integrated, merged and scaled using the HKL-2000 software (Otwinowski & Minor, 1997 ▶). Data processing revealed that the crystal belonged to the orthorhombic system, space group P222, with unit-cell parameters a = 73.94, b = 77.49, c = 83.78 Å. The data-set statistics are given in Table 1 ▶. The value of the Matthews coefficient (Matthews, 1968 ▶) was 2.82 Å3 Da−1, suggesting a solvent content of 59.93% assuming that two Smad1 MH1 molecules are bound to the palindromic DNA. A model derived from the Smad3 MH1 structure (PDB code 1ozj) will be used for molecular-replacement trials (Chai et al., 2003 ▶). The collection of SAD data following heavy-atom and bromine soaking of the crystals will also be attempted.
Table 1. Data-collection statistics.
Values in parentheses are for the highest resolution shell.
| Space group | P222 |
| Unit-cell parameters (Å, °) | a = 73.94, b = 77.49, c = 83.78, α = β = γ = 90 |
| Resolution (Å) | 30–2.7 (2.8–2.7) |
| No. of observed reflections | 52899 |
| No. of unique reflections | 13667 |
| Mosaicity | 0.51 |
| Rmerge† (%) | 5.8 (57) |
| Mean I/σ(I) | 22.5 (2.6) |
| Completeness (%) | 99.2 (100) |
| Multiplicity | 3.9 (3.9) |
R
merge = 
 , where Ii(hkl) and 〈I(hkl)〉 are the intensity of measurement i and the mean intensity for the reflection with indices hkl, respectively.
Acknowledgments
This work was supported by the Agency for Science, Technology and Research (A*STAR) in Singapore. We are grateful to Dr Robert Robinson (IMCB, Singapore) for helping us with diffraction data collection. We thank Dr Kini R. Manjunatha, Dr Rory Johnson and Kamesh Narasimhan for inspiring comments on the manuscript. We also thank the National Synchrotron Radiation Research Center (NSRRC, Taiwan) for access to the synchrotron-radiation beamline 13B1 and for providing assistance in data collection. The Synchrotron Radiation Protein Crystallography Facility is supported by the National Research Program for Genomic Medicine.
References
- Chacko, B., Qin, B., Tiwari, A., Shi, G., Lam, S., Hayward, L., De Caestecker, M. & Lin, K. (2004). Mol. Cell, 15, 813–823. [DOI] [PubMed]
- Chai, J., Wu, J., Yan, N., Massagué, J., Pavletich, N. & Shi, Y. (2003). J. Biol. Chem.278, 20327–20331. [DOI] [PubMed]
- De Marco, V., Stier, G., Blandin, S. & de Marco, A. (2004). Biochem. Biophys. Res. Commun.322, 766–771. [DOI] [PubMed]
- Fortuno, E. S. III, LeSueur, J. A. & Graff, J. M. (2001). Dev. Biol.230, 110–124. [DOI] [PubMed]
- Inman, G. (2005). Biochem. J.386, e1–e3. [DOI] [PMC free article] [PubMed]
- Karaulanov, E., Knöchel, W. & Niehrs, C. (2004). EMBO J.23, 844–856. [DOI] [PMC free article] [PubMed]
- Makkar, P., Metpally, R., Sangadala, S. & Reddy, B. (2009). J. Mol. Graph. Model.27, 803–812. [DOI] [PubMed]
- Massagué, J. (1998). Annu. Rev. Biochem.67, 753–791. [DOI] [PubMed]
- Matthews, B. (1968). J. Mol. Biol.33, 491–497. [DOI] [PubMed]
- Ng, C. K. L., Palasingam, P., Venkatachalam, R., Baburajendran, N., Cheng, J., Jauch, R. & Kolatkar, P. R. (2008). Acta Cryst. F64, 1184–1187. [DOI] [PMC free article] [PubMed]
- Otwinowski, Z. & Minor, W. (1997). Methods Enzymol.276, 307–326. [DOI] [PubMed]
- Sheldrick, G. M. (2008). Acta Cryst. A64, 112–122. [DOI] [PubMed]
- Shi, Y., Wang, Y., Jayaraman, L., Yang, H., Massagué, J. & Pavletich, N. (1998). Cell, 94, 585–594. [DOI] [PubMed]
- Wu, J., Hu, M., Chai, J., Seoane, J., Huse, M., Li, C., Rigotti, D., Kyin, S., Muir, T., Fairman, R., Massagué, J. & Shi, Y. (2001). Mol. Cell, 8, 1277–1289. [DOI] [PubMed]
- Yamamoto, M., Beppu, H., Takaoka, K., Meno, C., Li, E., Miyazono, K. & Hamada, H. (2009). J. Cell Biol.184, 323–334. [DOI] [PMC free article] [PubMed]
- Zawel, L., Dai, J., Buckhaults, P., Zhou, S., Kinzler, K., Vogelstein, B. & Kern, S. (1998). Mol. Cell, 1, 611–617. [DOI] [PubMed]


