The expression, purification, crystallization and preliminary diffraction analysis of an archaeal-type phosphoenolpyruvate carboxylase are described. Complete highly redundant X-ray data have been measured from a crystal diffracting to 3.13 Å resolution.
Keywords: phosphoenolpyruvate carboxylase, Clostridium perfringens
Abstract
An archaeal-type phosphoenolpyruvate carboxylase (PepcA) from Clostridium perfringens has been expressed in Escherichia coli in a soluble form with an amino-terminal His tag. The recombinant protein is enzymatically active and two crystal forms have been obtained. Complete diffraction data extending to 3.13 Å resolution have been measured from a crystal soaked in KAu(CN)2, using radiation at a wavelength just above the Au L III edge. The asymmetric unit contains two tetramers of PepcA.
1. Introduction
Phosphoenolpyruvate carboxylase (Pepc) catalyzes the formation of oxaloacetate (OAA) from phosphoenolpyruvate (PEP) and bicarbonate. The enzyme from C4 plants has been intensively studied as it plays a vital role in CO2 fixation (Izui et al., 2004 ▶; Chollet et al., 1996 ▶). The C4 compounds produced after carboxylation of PEP are transported into chloroplasts, where subsequent decarboxylation supplies ribulose 1,5-bisphosphate carboxylase/oxygenase (RuBisCO) with a high local concentration of CO2 (Raines, 2006 ▶). C4 plants are thus able to suppress oxygenation, a competing reaction catalyzed by RuBisCO that lowers the efficiency of CO2 fixation (Raines, 2006 ▶). C3 plants lack a mechanism to concentrate CO2 and fix CO2 with only ∼50% efficiency (Häusler et al., 2002 ▶). Attempts to express C4-type Pepc in C3 plants have not improved the efficiency of carbon fixation (Häusler et al., 2002 ▶). The high K m of the introduced C4-type Pepc for PEP and its sensitivity to inhibition by malate are thought to be responsible (Fukayama et al., 2003 ▶; Endo et al., 2008 ▶). The activity of Pepc in plants is modulated by both positive and negative allosteric regulation via binding of small-molecule effectors and by phosphorylation (Izui et al., 2004 ▶). The Escherichia coli enzyme has also been studied in detail (Izui et al., 2004 ▶). The bacterial enzyme is highly homologous to the plant enzyme (Izui et al., 2004 ▶) and subject to allosteric regulation, although not via phosphorylation (Izui et al., 2004 ▶). The archaeal-type Pepc (PepcA), in contrast, shows a simpler pattern of regulation (Patel et al., 2004 ▶; Ettema et al., 2004 ▶; Sako et al., 1996 ▶, 1997 ▶). No inhibitors or activators are known for PepcA from Methanothermus sociabilis or Methanothermobacter thermautotrophicus (Matsumura et al., 2006 ▶). PepcA is therefore an interesting candidate for expression in C3 plants with the goal of improving the efficiency of carbon fixation.
PepcA and Pepc share only 12–16% sequence identity and the only X-ray structures available are those of Pepc from E. coli and maize (Kai et al., 1999 ▶; Matsumura et al., 2002 ▶). The enzymes from E. coli and maize are homotetramers of 4 × 883 and 4 × 970 residues, respectively. In solution, both dimers and tetramers of E. coli Pepc are present, with a shift towards the tetrameric form in the presence of the allosteric inhibitor aspartate (Coomes et al., 1985 ▶). The PepcAs from Methanothermus sociabilis, Sulfolobus acidocaldarius and Methanothermobacter thermautotrophicus have all been reported to be tetramers in solution based on gel filtration (Sako et al., 1996 ▶, 1997 ▶; Patel et al., 2004 ▶). Attempts have been made to model the structure of PepcA based on the known X-ray structures of E. coli and maize Pepcs (Matsumura et al., 2006 ▶). The PepcA structure has also been targeted by structural genomics consortia, given the difficulty of modeling the fold. The PepcA-sequence family includes many representatives from the archaea and three bacterial homologs that are found in Clostridium perfringens, Oenococcus oeni and Leuconostoc mesenteroides (Patel et al., 2004 ▶). The sequence most closely related to that of PepcA from C. perfringens is from an archaeal methanogen, Methanopyrus kandleri; the sequences are 537 and 532 residues in length, respectively, and share 35% sequence identity. Production of the archaeal enzymes in E. coli has been difficult (Ettema et al., 2004 ▶; Kraszewski & Mukhopadhyay, 2005 ▶). The 537-residue PepcA homolog from the bacterium C. perfringens expressed well in E. coli when fused to an N-terminal His10 tag. Crystals of the recombinant tagged protein diffracted to ∼3 Å resolution and complete X-ray data have been collected.
2. Materials and methods
2.1. Cloning and protein expression
The ORF CPE1094 was PCR-amplified from C. perfringens strain 13 chromosomal DNA using the oligonucleotides CpePpc/1F, 5′-GAAAAGGGGGACTTCATATGAAGATACCTTGTTCCATGATGAC-3′ and CpePpc/2R, 5′-CAAGGATCCTTTAGCCTATACTTCCTCTTACTTTACCCATTC-3′. The amplified DNA was digested with NdeI and BamHI and cloned into similarly digested pET19b (Novagen, San Diego, California, USA). In the resulting construct, the full-length PepcA protein is preceded by the affinity tag MGHHHHHHHHHHSSGHIDDDDKH. The PepcA expression plasmid, designated pJLK15-19b, was introduced into E. coli strain BL21 (DE3) (pRIL). Cultures were grown at 310 K in LB medium containing ampicillin (100 µg ml−1) and chloramphenicol (25 µg ml−1) to an optical density of 0.5 before adding IPTG (1 mM) to induce expression of PepcA. Cells were harvested 4 h post-induction by centrifugation for 10 min at 9600g and the cell pellets were stored at 253 K.
2.2. Protein purification
5 g of cell pellet was thawed on ice with 10 ml 100 mM potassium phosphate buffer pH 7.0. Cells were broken by passage through a French pressure cell. 0.02 g DNase was added and the mixture was incubated on ice for 20 min. The extract was centrifuged at 18 000g for 1 h at 277 K. All further purification steps were carried out at 293 K. The soluble portion of the extract was brought to final concentrations of 50 mM potassium phosphate pH 7.0, 300 mM NaCl and 10 mM imidazole (equilibration buffer). The extract was filtered through a 0.2 µm filter and loaded onto a 10 ml Superflow Ni2+–NTA column (Qiagen Inc., Valencia, California, USA) at a flow rate of 1 ml min−1. The column was washed with four column volumes of equilibration buffer and then with two volumes of a solution containing 50 mM potassium phosphate buffer pH 7, 10 mM imidazole, 400 mM NaCl. Washing was continued with equilibration buffer until the absorption at 280 nm was stable. PepcA was eluted using an imidazole gradient over six column volumes (50–600 mM imidazole in equilibration buffer). Column fractions were analyzed using SDS–PAGE. The 400–500 mM imidazole fractions contained homogenous PepcA. The buffer was exchanged via ultrafiltration to 50 mM sodium phosphate pH 7, 150 mM NaCl (SEC buffer) and the protein was concentrated to a volume of 2 ml. The Ni2+–NTA pool was loaded onto a HiPrep 16/60 Sephacryl S-300 HR column pre-equilibrated with SEC buffer. PepcA was eluted using the same buffer. The protein was concentrated to 5 mg ml−1 (determined using the Bradford Coomassie-binding assay; Bio-Rad, Hercules, California, USA) and the buffer was changed to 20 mM HEPES pH 7 via ultrafiltration prior to crystallization.
The enzyme activity was assayed as described previously (Patel et al., 2004 ▶) but with a modified assay mixture containing 50 mM HEPES pH 7.2, 0.2 mM NADH, 30 mM KHCO3, 1.5 mM Na PEP, 2 mM MgCl2 and 1 U ml−1 thermophilic malate dehydrogenase from Thermus flavus (Sigma, St Louis, Missouri, USA).
2.3. Crystallization and data collection
Crystals were grown via hanging-drop vapor diffusion at 295 K in drops formed from 2 µl protein solution plus 2 µl reservoir solution. Hexagonal rods appeared within 1–3 d using 0.2–0.3 M magnesium formate, 0.1 M bis-Tris pH 5.5 or 0.1 M Tris pH 8.5 as precipitant. These crystals diffracted to only 8 Å after cryoprotection with either 20% PEG 200 or ethylene glycol. Blocks appeared after 6 d using 1.25–1.5 M sodium malonate pH 7 as precipitant. These crystals could be cryoprotected with 1.5 M sodium malonate pH 7 and diffracted to 3 Å resolution. A native data set was collected at 100 K from a crystal of approximate dimensions 0.15 × 0.2 × 0.4 mm using a Rayonix MX-325 detector on SSRL BL9-2. Data collection was based on a strategy suggested by Web-Ice (González et al., 2008 ▶). 450 images were collected with a Δϕ of 0.4° to give a total of 180° of data. The a* axis was closest to the rotation axis. Data integration and scaling were performed with MOSFLM (Leslie, 1992 ▶) and SCALA (Evans, 1997 ▶). A derivative was prepared by soaking a crystal in 1.5 M sodium malonate pH 7, 2 mM KAu(CN)2 for 16 h. A SAD data set was collected at 100 K from a soaked crystal of approximate dimensions 0.1 × 0.1 × 0.2 mm using a Rayonix MX-325 detector on SSRL BL11-1. 480 images were collected with a Δϕ of 0.75° to give a total of 360° of data. The c* axis was closest to the rotation axis, minimizing the problem of overlapped reflections. Data integration and scaling were performed with HKL-2000 (Otwinowski & Minor, 1997 ▶), keeping I + and I − separate during scaling and calculation of R merge. For both data sets, the total X-ray dose was estimated before choosing the exposure time per image to avoid radiation damage to the crystals. The dose estimated by RADDOSE (Paithankar et al., 2009 ▶) was 2.4 MGy for the native data set and 2.5 MGy for the KAu(CN)2-derivative data set.
3. Results
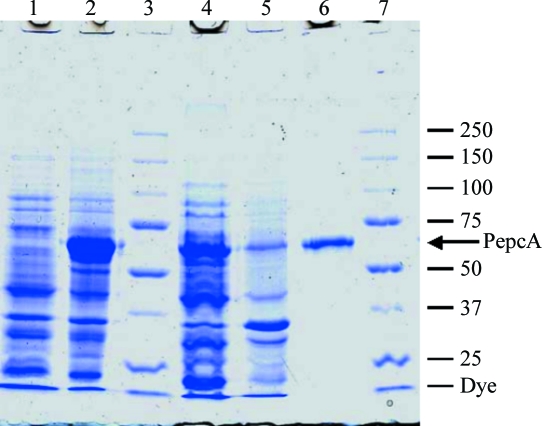
PepcA from C. perfringens with an N-terminal His10 tag yielded soluble catalytically active protein. After Ni2+-affinity-based chromatography, the PepcA preparation was homogeneous as judged by denaturing SDS–PAGE (Fig. 1 ▶). The enzyme was further purified via gel filtration to remove aggregates. The apparent molecular weight of the enzyme based on the gel-filtration elution volume was 130 kDa, consistent with a dimer of 62.3 kDa subunits. The yield was 1.5 mg pure PepcA per gram of cell paste. The specific activity of the purified enzyme was typically in the range 38–65 µmol min−1 mg−1.
Figure 1.
Purification of overexpressed PepcA. Lane 1, whole cell extract before induction of PepcA expression; lane 2, whole cell extract after IPTG induction; lane 3, molecular-weight markers; lane 4, soluble portion of the extract; lane 5, insoluble portion of the extract; lane 6, purified PepcA; lane 7, molecular-weight markers with mass indicated in kDa. The calculated molecular weight of His10-tagged PepcA is 62.3 kDa.
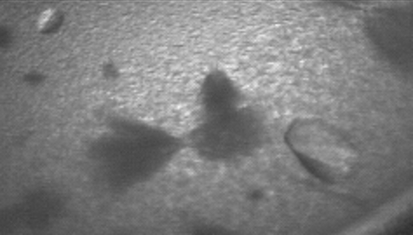
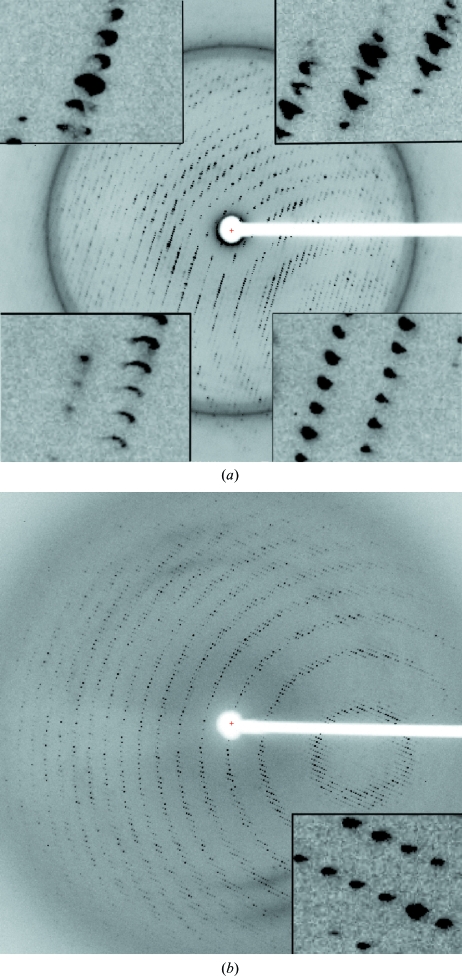
Crystals were obtained in the orthorhombic space group P212121 using sodium malonate as a precipitant (Fig. 2 ▶). The unit-cell parameters of a = 123.3, b = 164.1, c = 283.3 Å suggested eight copies of PepcA per asymmetric unit, with a solvent content of 57% and a Matthews coefficient of 2.9 Å3 Da−1. A slightly smaller unit cell was obtained for a crystal soaked in KAu(CN)2, with a = 121.4, b = 161.7, c = 280.1 Å. Data with a useful anomalous signal were collected from the Au-containing crystal at a wavelength just above the Au L III edge (Table 1 ▶). Two factors that contribute to the higher quality of the data from the Au-soaked crystal are the greater redundancy and the favorable orientation of the crystal (the longest axis was closest to the rotation axis). An additional feature unique to the native diffraction pattern was a variation in spot shape. In the native diffraction pattern the spot shape varied markedly across the face of the detector (Fig. 3 ▶ a), whereas in the diffraction pattern of the KAu(CN)2-soaked crystal the spot shape was uniform across the detector (Fig. 3 ▶ b). Molecular replacement with models including the conserved Pepc β-barrel was not successful. A SAD solution of the structure is under way. 16 gold sites were located with SHELXD and after density modification SHELXE reported a mean figure of merit of 0.459 (Sheldrick, 2008 ▶). The local symmetry of the gold sites indicates that the asymmetric unit contains two tetramers of PepcA and that the tetramers possess 222 point-group symmetry. The regulation of PepcA from C. perfringens has not been studied and it is not known what factors influence the quaternary structure of the enzyme. The precipitant, malonate, may have favored the crystallization of tetramers. Malonate is an inhibitor of E. coli Pepc and the quaternary structure of E. coli Pepc is known to be sensitive to inhibitor binding (Corwin & Fanning, 1968 ▶; Coomes et al., 1985 ▶). Whether or not the PepcA quaternary structure is also influenced by inhibitor binding is an open question.
Figure 2.
Crystals of PepcA grown in 1.5 M sodium malonate pH 7 together with ‘haystacks’ of needles and precipitate.
Table 1. Data-collection statistics.
Values in parentheses are for the highest resolution shell.
| Native | KAu(CN)2 | |
|---|---|---|
| Beamline | SSRL BL9-2 | SSRL BL11-1 |
| Wavelength (Å) | 0.97946 | 1.03948 |
| Space group | P212121 | P212121 |
| Unit-cell parameters (Å) | a = 123.3, b = 164.1, c = 283.3 | a = 121.4, b = 161.7, c = 280.1 |
| Monomers per ASU | 8 | 8 |
| Matthews coefficient (Å3 Da−1) | 2.9 | 2.9 |
| Resolution (Å) | 3.13 (3.21–3.13) | 3.13 (3.24–3.13) |
| Completeness (%) | 82.6 (73.0) | 100 (100) |
| Multiplicity | 5.6 (5.5) | 7.9 (7.8) |
| Unique reflections | 84213 | 97165 |
| I/σ(I) | 7.1 (2.8) | 23.4 (4.4) |
| Rmerge† | 0.165 (0.739) | 0.098 (0.526) |
| Wilson B value (Å2) | 72 | 70 |
R
merge = 
 , where 〈I(hkl)〉 is the mean intensity over all symmetry-related and equivalent reflections for reflection hkl and the Ii(hkl) are the observed intensities for reflection hkl.
Figure 3.
Diffraction patterns taken from PepcA crystals. (a) An 0.4° oscillation from the native data set, with insets in the image showing the variation of spot shape across the detector. The resolution at the detector edge was 3 Å. (b) An 0.75° oscillation from the KAu(CN)2-soaked crystal. The resolution at the detector edge was 3.13 Å.
Acknowledgments
C. perfringens strain 13 chromosomal DNA was a gift from Stephen Melville of the Department of Biological Sciences, Virginia Polytechnic Institute and State University. We thank Eric Johnson for help in protein purification. Portions of this research were carried out at the Stanford Synchrotron Radiation Lightsource, a national user facility operated by Stanford University on behalf of the US Department of Energy, Office of Basic Energy Sciences. The SSRL Structural Molecular Biology Program is supported by the Department of Energy, Office of Biological and Environmental Research and by the National Institutes of Health, National Center for Research Resources, Biomedical Technology Program and the National Institute of General Medical Sciences. The projects described were partially supported by Grant No. 5 P41 RR001209 from the National Center for Research Resources (NCRR), a component of the National Institutes of Health (NIH), and their contents are solely the responsibility of the authors and do not necessarily represent the official view of NCRR or NIH. LD received a graduate fellowship (2005) from the Virginia Tech Genetics, Bioinformatics and Computational Biology PhD program.
References
- Chollet, R., Vidal, J. & O’Leary, M. H. (1996). Annu. Rev. Plant Physiol. Plant Mol. Biol.47, 273–298. [DOI] [PubMed]
- Coomes, M. W., Mitchell, B. K., Beezley, A. & Smith, T. E. (1985). J. Bacteriol.164, 646–652. [DOI] [PMC free article] [PubMed]
- Corwin, L. M. & Fanning, G. R. (1968). J. Biol. Chem.243, 3517–3525. [PubMed]
- Endo, T., Mihara, Y., Furumoto, T., Matsumura, H., Kai, Y. & Izui, K. (2008). J. Exp. Bot.59, 1811–1818. [DOI] [PubMed]
- Ettema, T. J., Makarova, K. S., Jellema, G. L., Gierman, H. J., Koonin, E. V. Huynen, M. A., de Vos, W. M. & van der Oost, J. (2004). J. Bacteriol.186, 7754–7762. [DOI] [PMC free article] [PubMed]
- Evans, P. R. (1997). Jnt CCP4/ESF–EACBM Newsl. Protein Crystallogr.33, 22–24.
- Fukayama, H., Hatch, M. D., Tamai, T., Tsuchida, H., Sudoh, S., Furbank, R. T. & Miyao, M. (2003). Photosynth. Res.77, 227–239. [DOI] [PubMed]
- González, A., Moorhead, P., McPhillips, S. E., Song, J., Sharp, K., Taylor, J. R., Adams, P. D., Sauter, N. K. & Soltis, S. M. (2008). J. Appl. Cryst.41, 176–184.
- Häusler, R. E., Hirsch, H. J., Kreuzaler, F. & Peterhansel, C. (2002). J. Exp. Bot.53, 591–607. [DOI] [PubMed]
- Izui, K., Matsumara, H., Furumoto, T. & Kai, Y. (2004). Annu. Rev. Plant Physiol. Plant Mol. Biol.55, 69–84. [DOI] [PubMed]
- Kai, Y., Matsumara, H., Inoue, T., Terada, K., Yoshinaga, T., Kihara, A., Tsumura, K. & Izui, K. (1999). Proc. Natl Acad. Sci. USA, 96, 823–828. [DOI] [PMC free article] [PubMed]
- Kraszewski, J. L. & Mukhopadhyay, B. (2005). Unpublished work.
- Leslie, A. G. W. (1992). Jnt CCP4/ESF–EACBM Newsl. Protein Crystallogr.26
- Matsumura, H., Izui, K. & Mizuguchi, K. (2006). Protein Eng.19, 409–419. [DOI] [PubMed]
- Matsumura, H., Xie, Y., Shirakata, S., Inoue, T., Yoshinaga, T., Ueno, Y., Izui, K. & Kai, Y. (2002). Structure, 10, 1721–1730. [DOI] [PubMed]
- Otwinowski, Z. & Minor, W. (1997). Methods Enzymol. 276, 307–326. [DOI] [PubMed]
- Paithankar, K. S., Owen, R. L. & Garman, E. F. (2009). J. Synchrotron Rad.16, 152–162. [DOI] [PubMed]
- Patel, H. M., Kraszewski, J. L. & Mukhopadhyay, B. (2004). J. Bacteriol.186, 5129–5137. [DOI] [PMC free article] [PubMed]
- Raines, C. A. (2006). Plant Cell Environ.29, 331–339. [DOI] [PubMed]
- Sako, Y., Takai, K., Nishizaka, T. & Ishida, Y. (1997). FEMS Microbiol. Lett.153, 159–165.
- Sako, Y., Takai, K., Uchida, A. & Ishida, Y. (1996). FEBS Lett.392, 148–152. [DOI] [PubMed]
- Sheldrick, G. M. (2008). Acta Cryst. A64, 112–122. [DOI] [PubMed]


