

Abstract
Objective:
Independent studies have previously demonstrated that both the HIPK2 and BRAF genes are amplified and rearranged, respectively, in pilocytic astrocytomas (PAs). The purpose of this study was to further investigate the frequency of BRAF and HIPK2 alterations in PAs, the concordance of these events, and their relationship to clinical phenotype.
Methods:
We performed extensive characterization by array-based copy number assessment (aCGH), HIPK2 copy number analysis, and BRAF rearrangement and mutation analysis in a set of 79 PAs, including 9 tumors from patients with neurofibromatosis type 1 (NF1).
Results:
We identified 1 of 3 previously identified BRAF rearrangements in 42/70 sporadic PAs. An additional 2 tumors with no rearrangement also exhibited BRAF mutation, including a novel 3-base insertion. As predicted from the genomic organization at this locus, 22/36 tumors with BRAF rearrangement also exhibited corresponding HIPK2 amplification. However, 14/36 tumors with BRAF rearrangement had no detectable HIPK2 gene amplification and 6/20 tumors demonstrated HIPK2 amplification without apparent BRAF rearrangement or mutation. Only 12/70 PAs lacked detectable BRAF or HIPK2 alterations. Importantly, none of the 9 PA tumors from NF1 patients exhibited BRAF rearrangement or mutation.
Conclusions:
BRAF rearrangement represents the most common genetic alteration in sporadic, but not neurofibromatosis type 1-associated, pilocytic astrocytomas (PAs). These findings implicate BRAF in the pathogenesis of these common low-grade astrocytomas in children, and suggest that PAs arise either from NF1 inactivation or BRAF gain of function.
GLOSSARY
- aCGH
= array comparative genomic hybridization;
- GBM
= glioblastoma multiforme;
- NF1
= neurofibromatosis type 1;
- PA
= pilocytic astrocytoma.
Pilocytic astrocytomas (PAs) represent one of the most common brain tumors in the pediatric population.1 These glial neoplasms are classified by the World Health Organization as grade I astrocytomas, characterized by biphasic architecture, low proliferative indices, microglial infiltration, and overall indolent clinical behavior.2 Fifteen percent of PAs occur in the context of the inherited cancer syndrome, neurofibromatosis type 1 (NF1),3,4 and these NF1-associated gliomas exhibit biallelic inactivation of the NF1 gene.5,6 In contrast, sporadic pilocytic astrocytomas retain NF1 gene expression, suggesting that other genetic events must be responsible for the genesis of these common childhood brain tumors.6,7
Previous genetic studies of sporadic PAs have demonstrated gains involving chromosomes 7 and 88–10; however, the causative genes residing on these chromosomes that might be responsible for PA formation remain elusive. Recently, we and others have employed high-density gene expression and gene copy number-based microarray methods to identify potential genes in this region. Our initial analyses found that the homeobox-interacting protein kinase-2 (HIPK2) gene on chromosome 7q11 and matrilin-2 (MATN2)12 on chromosome 8p were increased in expression in sporadic PAs, and that the HIPK2 gene locus itself was frequently amplified in these tumors. While both of these genes represent compelling candidates for a “PA-initiating” genetic change, HIPK2 and MATN2 expression was increased in both sporadic and NF1-associated PA. This observation suggests that these genes might be involved in PA growth, but are unlikely to be responsible for sporadic PA tumorigenesis.
On chromosome 7q, near the HIPK2 locus, resides the BRAF gene, which has been linked to numerous other cancers.13–15 Recent studies by several groups have identified mutations and rearrangements of the BRAF gene in low-grade gliomas,16–18 prompting speculation that this gene might substitute for NF1 gene inactivation in the genesis of sporadic PA. In this report, we describe the spectrum of BRAF alterations in the largest series of PAs to date, and show that BRAF genetic changes are observed in nearly two-thirds of sporadic PAs, but are rarely seen in high-grade gliomas. Moreover, BRAF alterations were not seen in PAs from patients with NF1, supporting the contention that this specific genetic alteration may drive sporadic PA tumorigenesis.
METHODS
Specimen sources.
Frozen tissue and derived nucleic acid specimens for this study were collected and utilized under IRB approved protocols (HRPO 99-0573 and 04-0980). Extraction of RNA and DNA was carried out according to the vendor’s standard protocol using the RNeasy and DNeasy kits, respectively (Qiagen, Valencia, CA). RNA quality was assessed by Agilent Bioanalyzer, and quantification of both RNA and DNA was assessed with a Nanodrop ND-1000 spectrophotometer (NanoDrop Technologies, Wilmington DE).
Array CGH and analysis.
Affymetrix GeneChip Human Mapping 250K NSP and 250K STY arrays (Affymetrix, Santa Clara, CA) were processed by the Siteman Cancer Center Multiplexed Gene Analysis Facility, following the manufacturer’s standard protocol. Affymetrix GTYPE v4.1 software was used to generate Affymetrix CEL files and to call SNP genotypes using the BRLMM algorithm. Copy number analysis for Affymetrix GeneChip Human Mapping 250K NSP and 250K STY arrays was performed using dChip,19 Partek Genomic Suite (PGS v6.07), Affymetrix Genotyping Console 2.1 (GC), and CNAG (v3.0).20–22 SNPs were mapped to the NCBI genome build 36. Thirty-seven nonmalignant DNA samples from independent subjects were used as a “normal genome” reference set.
First, unpaired analysis was performed using dChip to calculate copy number at each SNP and to create segment data as previously described.11 A region was called “amplified” if copy number was ≥2.5 and “deleted” if copy number was ≤1.5. Second, unpaired analysis was performed using PGS, and copy number at each SNP was calculated. Copy number data at each SNP locus were converted to segment level data to detect regions of amplifications and deletions using the HMM algorithm (default parameters) implemented in PGS. A region was considered “amplified” if copy number was ≥2.5 and “deleted” if copy number was ≤1.5. Third, unpaired analysis was performed using GC, and copy number at each SNP marker was calculated. Copy number at each SNP locus was converted to segment level data to detect regions of amplifications and deletions using the Segment Reporting Tool (default parameters) implemented in GC. A region was called “amplified” if copy number was >2.0 and “deleted” if copy number was <2.0. Finally, unpaired analysis was performed using CNAG (default parameters). A region was called “amplified” if copy number was >2.0 and “deleted” if copy number was <2.0. CNAG reports the results at segment level for build 35; therefore, reported regions were converted to build 36 using the LiftOver tool.23
Amplified segments from chromosome 7 were selected for overlap analysis. The segment level data from dChip, PGS, GC, and CNAG were compared to identify overlapping and recurrent segments (i.e., present in more than 1 sample and predicted by 2 or more algorithms).
HIPK2 quantitative PCR.
Quantitative PCR (qPCR) analysis was employed to identify HIPK2 amplification as previously described.11 Primers and TaqMan probes for HIPK2 and the internal reference gene, DOCK10, were designed with Primer Express v1.5 (Applied Biosystems, Foster City, CA). Assays were performed on an ABI PRISM 7900HT system.
BRAF rearrangement assay.
Using previously reported protocols,18 BRAF rearrangement was assessed by RT-PCR. RNA was reverse-transcribed to cDNA using Oligo(dT)-primers and SuperScript reverse transcriptase II (Invitrogen, Carlsbad, CA) according to the manufacturer’s protocol. PCR was performed using conditions and primers previously described to identify 3 types of KIAA1549-BRAF fusion products (16_9, 16_11, and 15_9).
BRAF sequencing.
All sequencing was performed by the Laboratory for Clinical Genomics at the Washington University School of Medicine. Primers (table e-1 on the Neurology® Web site at www.neurology.org) were designed using the Primer Design Pipeline tool developed by the Siteman Cancer Center Bioinformatics Core. PCR and sequencing employed Amplitaq® Gold DNA Polymerase and ABI BigDye V3.1 (Applied Biosystems, Foster City, CA). For amplicon generation, cycling conditions were initial denaturation at 95°C for 10 m, 35 cycles of 95°C for 30 s, 60°C for 30 s, and 72°C for 90 s, a 7-minute extension step at 72°C, followed by a hold at 10°C until the final purification step. PCR products were then purified using ExoSAP-IT (USB, Cleveland, OH) for sequencing using Edge Biosystems Performa V3 96-Well Short Plates injected on a 3730xl DNA Analyzer using POP-7 polymer, and analyzed using 3730/3730xl DNA Analyzer Data Collection Software v3.0 (Applied Biosystems). The total volume injected was 15 μL of purified sequencing product. Mutation detection analysis was performed using Mutation Profiling Pipeline and its graphical user interface Mutation Viewer developed by the Siteman Cancer Center Bioinformatics Core.
Immunohistochemistry.
Immunohistochemistry was performed on 2 independent tissue microarrays containing sporadic and NF1-associated PAs using 2 different BRAF antibodies (ab33899 and ab59354; Abcam, Cambridge, MA) according to established protocols in our laboratory.24 Normal human brain was used as an internal positive control for immunostaining of BRAF+ neurons. Tumors with greater than 10% immunoreactive cells were scored as positive.
RESULTS AND DISCUSSION
Previously, we demonstrated that 40%-60% of PAs had amplification of the HIPK2 gene and that HIPK2 overexpression stimulated cell growth.11 While the extent of HIPK2 amplification in our PA tumors did not extend to the BRAF gene, others have demonstrated that the BRAF gene, in ∼2 MB proximity to the HIPK2 locus on chromosome 7q, is frequently rearranged and/or mutated in PA.16–18 In these reports, BRAF rearrangements were observed in 19/25 (76%), 29/44 (65%), and 31/53 (58%) of PAs. Consistent with a functional role for BRAF in PA growth, BRAF alteration was associated with increased MEK signaling, and either MEK pharmacologic inhibition or silencing of BRAF in PA tumor cells resulted in reduced cell growth in vitro.16,17
To characterize further the frequency of BRAF rearrangements in PA and to correlate this genetic change with the presence of HIPK2 amplification, we performed a simultaneous analysis of HIPK2 amplification and BRAF rearrangement in 79 PAs, including 9 cases from patients diagnosed with NF1. For comparison, we also examined 2 cases of grade II astrocytoma and 38 cases of glioblastoma multiforme (GBM). In a subset of these PAs, we were also able to examine genome copy number across the entire BRAF-HIPK2 locus, using array comparative genomic hybridization (aCGH) data. Table e-2 provides full details of the individual PA cases analyzed.
As shown in table 1, 42/70 (60%) of the sporadic PAs analyzed had 1 of the 3 previously described BRAF rearrangements. The overall frequency and relative ratios of each rearrangement type (70% of rearrangements involving exons 1-16 and 9-18) are comparable to those found by others.16–18 However, using 2 tissue microarrays (a total of 120 individual PA tumors), we did not detect increased BRAF protein expression in PA tumors using antibodies that recognize either the amino or carboxyl terminal domain of the protein (data not shown), suggesting these BRAF alterations most likely affect the function of the chimera, but do not increase protein levels.
Table 1BRAFrearrangement andHIPK2amplification status in 70 pilocytic astrocytoma cases
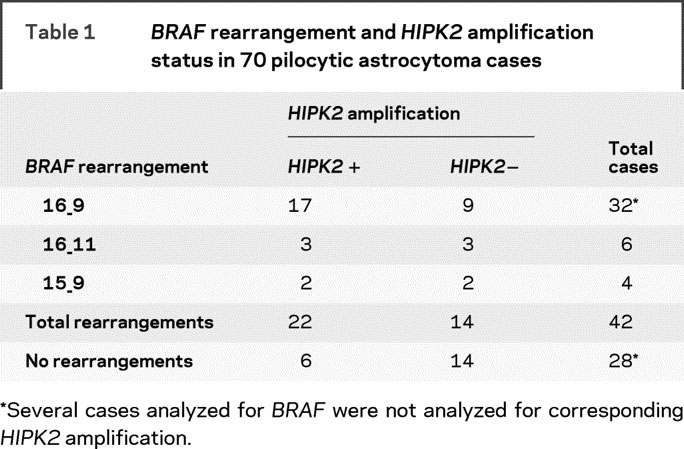
Rearrangement between BRAF and KIA1549 results in a tandem duplication of the intervening genomic segment, which includes HIPK2, a gene which we previously found to be amplified in 40%-60% of sporadic PAs.11 Not surprisingly, we found that 22/36 (61%) cases had concordant BRAF rearrangement and HIPK2 amplification. Of the remaining 14 tumors with BRAF rearrangement, no HIPK2 gene amplification was detected, possibly because of a lack of sensitivity for detecting subtle, quantitative copy number changes. More interestingly, we conversely identified 6/20 (30%) cases which clearly had HIPK2 gene amplification, but no corresponding BRAF rearrangement. This could be the result of novel BRAF rearrangements that amplify the internal HIPK2 locus, and are not detected by the 3 primer sets used in our and previously described assays. More provocatively, it could suggest independent contributions of the BRAF and HIPK2 genes to the PA phenotype.
To understand more fully the genomic landscape of PAs at this locus, we compared whole genome aCGH copy number assessment performed on 20 PAs with the presence or absence of both BRAF rearrangement and HIPK2 amplification, as assessed by quantitative PCR. As shown in figure 1, there is no clear relationship between the type of BRAF rearrangement and the extent of quantitative amplification in the region. Furthermore, we identified 2 tumors with neither BRAF rearrangement nor corresponding DNA amplification in this region of chromosome 7q. These data raise the possibility that further genomic heterogeneity exists at this locus, which may influence the molecular phenotype of these tumors.

Figure 1 Comparison of quantitative array comparative genomic hybridization (aCGH) analysis and HIPK2 amplification/BRAF rearrangement status in 20 sporadic pilocytic astrocytoma tumors
The area intervening between the reported BRAF and KIAA1549 rearranged loci is shown. Gray bars indicate regions of HIPK2 and BRAF genes. Vertical lines demonstrate the extent of amplification in each tumor sample as determined by aCGH. Above, the BRAF fusion type and HIPK2 amplification status is noted. *Samples with no detectable molecular alteration at either gene locus.
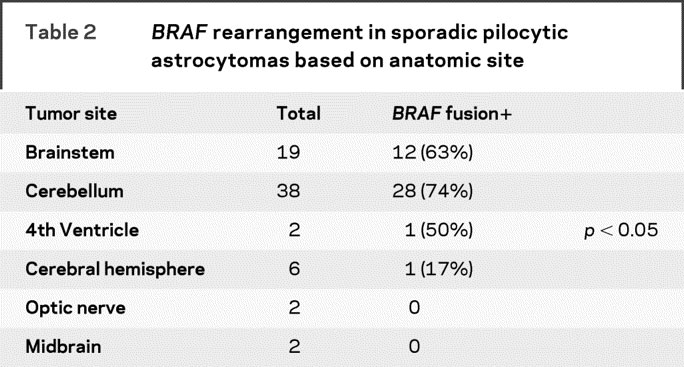
Although the majority of sporadic PAs arise in the posterior fossa (table 2), we found a significant difference in the frequency of BRAF rearrangements in tumors arising outside of this anatomic region. Almost 70% of tumors arising in the posterior fossa (cerebellum, brainstem, fourth ventricle) harbored a BRAF rearrangement, whereas only 1/11 (9%) PAs arising in the optic nerve or cerebral hemispheres exhibited BRAF alteration. To further support the hypothesis that BRAF rearrangement is specific to the PA phenotype, we also examined other, more aggressive glial tumors. We examined 2 cases of grade II astrocytomas and 38 cases of GBM. Neither of the grade II astrocytomas and only 1/38 GBMs exhibited BRAF rearrangement. Together, these data suggest that BRAF rearrangement represents a relatively specific PA molecular alteration and that other genomic changes may predominate in supratentorial PA.
Table 2BRAFrearrangement in sporadic pilocytic astrocytomas based on anatomic site
Although we identified frequent BRAF rearrangements in this study, 28 (40%) cases still had no detectable genomic alterations. Since the BRAF gene is frequently mutated in a number of tumor types, we performed comprehensive resequencing of the BRAF coding region in 27 PAs with no detectable rearrangements, as well as in 6 PAs with 1 of the 3 detected BRAF rearrangements. As shown in figure 2A, we obtained high-quality, double-stranded sequence for the majority of BRAF gene exons (with the notable exception of exon 1) in all 33 cases. None of the 6 cases with BRAF rearrangement demonstrated an additional mutation, while 2/27 PAs had a detectable mutation. One tumor demonstrated a previously documented V600E single nucleotide substitution, whereas a second tumor harbored a novel 3-nucleotide insertion (figure 2B), which inserts an additional in-frame threonine residue at position 599, and thereby also converts position 600 from a valine to a glutamine residue. The fact that this mutation occurs within the catalytic domain in close proximity to Valine-600, which is important for BRAF function, suggests that this mutation may lead to dysregulated BRAF activity as well. Future studies are planned to address this important question. Finally, despite this intensive characterization of the entire BRAF locus, 12 of 70 tumors in this cohort (17%) still lacked identifiable BRAF or HIPK2 molecular alterations, implicating other genes in the pathogenesis of sporadic PA.

Figure 2 Sequencing of BRAF in pilocytic astrocytomas (PA)
(A) Coverage plot showing extent of double stranded sequence coverage of BRAF exons in 33 PA samples. (B) Three-nucleotide insertion detected in BRAF at amino acid residue 599. Sequence traces from forward and reverse strand are shown, along with resulting sequence and predicted reading frame.
Although the majority of PAs arise sporadically, 15% of PAs arise in the context of the NF1-inherited tumor predisposition syndrome as a result of NF1 gene mutation. In contrast to sporadic PA, no BRAF rearrangements were identified in the 9 PAs from NF1 patients. This finding suggests that BRAF might be a unique driver in sporadic PA that stimulates glial progenitor cell growth through the RAS pathway, similar to RAS hyperactivation secondary to biallelic NF1 loss. This is consistent with previous studies from us and others identifying rare oncogenic KRAS mutations in sporadic PA.24,25 Future mechanistic studies will be required to determine whether BRAF activation in permissive glial progenitor types is sufficient for low-grade gliomagenesis.
AUTHOR CONTRIBUTIONS
Statistical analysis was conducted by Dr. Jinsheng Yu.
DISCLOSURE
Dr. Yu, H. Deshmukh, R.J. Gutmann, R.J. Emnett, and Dr. Rodriguez report no disclosures. Dr. Watson receives research support from the NIH [GM63340 (core director), CA114736 (co-PI), CA114722 (co-I)] and from the Susan G. Komen Foundation. Dr. Nagarajan serves on scientific advisory boards for Persistent Systems Ltd.; receives research support from the NIH [NCI P30 CA91842 (co-I), NCI, U54 CA119342 (co-I), NINDS 5 P30 NS057105-02 (co-I), NCRR 5 UL1 RR024992-02 (co-I), NCI, P01 CA101937 (co-I), NCI 26XS185 (Investigator), NCI 28SX195 (investigator), NCI caBIG (Investigator), NIDDK P30 DK079333 (co-I), NLM 5 K22 LM008290-03 (investigator), and NCI 28XS205 (Investigator)]; and from the Microsoft Research Foundation and the Susan G. Komen Foundation. Dr. Gutmann serves as a grant reviewer for the Goldhirsch Foundation; serves on the editorial boards of Cancer Research, Glia, Disease Models and Mechanisms, and Familial Cancer; may accrue revenue on US Patent 5,859,195 (issued: 1/12/99: NF1 Gene); and receives research support from the US Department of Defense (Army) [DAMD-17-04-0266 (PI), NF050176 (PI), DAMD-W81XWH061022 (PI)], the NIH NS058433-01, CA136573 (co-PI) and CA127008 (Co-PI)], the Children’s Tumor Foundation (PI), and the MALIA’s Cord Foundation (co-PI).
Supplementary Material
Address correspondence and reprint requests to Dr. David H. Gutmann, Department of Neurology, Washington University School of Medicine, Box 8111, 660 South Euclid Avenue, Saint Louis, MO 63110 gutmannd@neuro.wustl.edu
Editorial, page 1522
Supplemental data at www.neurology.org
e-Pub ahead of print on September 30, 2009, at www.neurology.org.
Supported by funding from the Brain Tumor Society to D.H.G. The Alvin J. Siteman Cancer Center at the Washington University School of Medicine and Barnes-Jewish Hospital in St. Louis, MO, provided the Tissue Procurement Core, Multiplexed Gene Analysis Core, and Bioinformatics Core, which provided support for the microarray and mutation profiling analyses. The Siteman Cancer Center is supported in part by an NCI Cancer Center Support Grant (P30 CA91842).
Disclosure: Author disclosures are provided at the end of the article.
Received March 31, 2009. Accepted in final form July 17, 2009.
REFERENCES
- 1.Central Brain Tumor Registry of the United States. Primary Brain Tumors in the United States Statistical Report 2007-2008. CBTRUS: Hinsdale, IL; 2008. [Google Scholar]
- 2.Louis DN, Ohgaki H, Wiestler OD, Cavenee WK. WHO Classification of Tumours of the Central Nervous System. IARC: Lyon; 2007. [DOI] [PMC free article] [PubMed] [Google Scholar]
- 3.Listernick R, Darling C, Greenwald M, Strauss L, Charrow J. Optic pathway tumors in children: the effect of neurofibromatosis type 1 on clinical manifestations and natural history. J Pediatr 1995;127:718–722. [DOI] [PubMed] [Google Scholar]
- 4.Listernick R, Louis DN, Packer RJ, Gutmann DH. Optic pathway gliomas in children with neurofibromatosis 1: consensus statement from the NF1 optic pathway: Glioma Task Force. Ann Neurol 1997;41:143–149. [DOI] [PubMed] [Google Scholar]
- 5.Gutmann DH, Donahoe J, Brown T, James CD, Perry A. Loss of neurofibromatosis 1 (NF1) gene expression in NF1-associated pilocytic astrocytomas. Neuropathol Appl Neurobiol 2000;26:361–367. [DOI] [PubMed] [Google Scholar]
- 6.Kluwe L, Hagel C, Tatagiba M, et al. Loss of NF1 alleles distinguish sporadic from NF1-associated pilocytic astrocytomas. J Neuropathol Exp Neurol 2001;60:917–920. [DOI] [PubMed] [Google Scholar]
- 7.Wimmer K, Eckart M, Meyer-Puttlitz B, Fonatsch C, Pietsch T. Mutational and expression analysis of the NF1 gene argues against a role as tumor suppressor in sporadic pilocytic astrocytomas. J Neuropathol Exp Neurol 2002;61:896–902. [DOI] [PubMed] [Google Scholar]
- 8.Sanoudou D, Tingby O, Ferguson-Smith MA, et al. Analysis of pilocytic astrocytoma by comparative genomic hybridization. Br J Cancer 2000;82:1218–1222. [DOI] [PMC free article] [PubMed] [Google Scholar]
- 9.White FV, Anthony DC, Yunis EJ, et al. Nonrandom chromosomal gains in pilocytic astrocytomas of childhood. Hum Pathol 1995;26:979–986. [DOI] [PubMed] [Google Scholar]
- 10.Zattara-Cannoni H, Gambarelli D, Lena G, et al. Are juvenile pilocytic astrocytomas benign tumors? A cytogenetic study in 24 cases. Cancer Genet Cytogenet 1998;104:157–160. [DOI] [PubMed] [Google Scholar]
- 11.Deshmukh H, Yeh TH, Yu J, et al. High-resolution, dual-platform aCGH analysis reveals frequent HIPK2 amplification and increased expression in pilocytic astrocytomas. Oncogene 2008;27:4745–4751. [DOI] [PubMed] [Google Scholar]
- 12.Sharma MK, Watson MA, Lyman M, et al. Matrilin-2 expression distinguishes clinically relevant subsets of pilocytic astrocytoma. Neurology 2006;66:127–130. [DOI] [PubMed] [Google Scholar]
- 13.Michaloglou C, Vredeveld LC, Mooi WJ, Peeper DS. BRAF (E600) in benign and malignant human tumours. Oncogene 2008;27:877–895. [DOI] [PubMed] [Google Scholar]
- 14.Lanzilotta SG, Grammatica L, Paradiso A, Simone G. BRAF in papillary thyroid carcinoma. Cell Oncol 2997;29:269–277. [DOI] [PMC free article] [PubMed]
- 15.Dhomen N, Marais R. New insight into BRAF mutations in cancer. Curr Opin Genet Dev 2007;17:31–39. [DOI] [PubMed] [Google Scholar]
- 16.Pfister S, Janzarik WG, Remke M, et al. BRAF gene duplication constitutes a mechanism of MAPK pathway activation in low-grade astrocytomas. J Clin Invest 2008;118:1739–1749. [DOI] [PMC free article] [PubMed] [Google Scholar]
- 17.Bar EE, Lin A, Tihan T, Burger PC, Eberhart CG. Frequent gains at chromosome 7q34 involving BRAF in pilocytic astrocytoma. J Neuropathol Exp Neurol 2008;67:878–887. [DOI] [PubMed] [Google Scholar]
- 18.Jones DT, Kocialkowski S, Liu L, et al. Tandem duplication producing a novel oncogenic BRAF fusion gene defines the majority of pilocytic astrocytomas. Cancer Res 2008;68:8673–8677. [DOI] [PMC free article] [PubMed] [Google Scholar]
- 19.Lin M, Wei LJ, Sellers WR, Lieberfarb M, Wong WH, Li C. dChipSNP: significance curve and clustering of SNP-array-based loss-of-heterozygosity data. Bioinformatics 2004;20:1233–1240. [DOI] [PubMed] [Google Scholar]
- 20.Partek Inc. Partek® Genomics Suite™. Partek Inc.; 2008. [Google Scholar]
- 21.Affymetrix R Genotyping Console TM Software. Available at: www.affymetrix.com/products_services/software/specific/genotyping_console_software.affx. Accessed March 12, 2009.
- 22.Nannya Y, Sanada M, Nakazaki K, et al. A robust algorithm for copy number detection using high-density oligonucleotide single nucleotide polymorphism genotyping arrays. Cancer Res 2005;65:6071–6079. [DOI] [PubMed] [Google Scholar]
- 23.Lift Genome Annotations. Available at: genome.ucsc.edu/cgi-bin/hgLiftOver. Accessed March 12, 2009.
- 24.Sharma MK, Zehnbauer BA, Watson MA, Gutmann DH. RAS pathway activation and an oncogenic RAS mutation in sporadic pilocytic astrocytoma. Neurology 2005;65:1335–1336. [DOI] [PubMed] [Google Scholar]
- 25.Janzarik WG, Kratz CP, Loges NT, et al. Further evidence for a somatic KRAS mutation in a pilocytic astrocytoma. Neuropediatrics 2997;38:61–63. [DOI] [PubMed]
Associated Data
This section collects any data citations, data availability statements, or supplementary materials included in this article.