

Abstract
A microfluidic device to quantify bacterial chemotaxis has been proposed, which generates a linear concentration gradient of chemoattractant in the main channel only by convective and molecular diffusion, and which enables the bacteria to enter the main channel in a single file by hydrodynamic focusing technique. The trajectory of each bacterium in response to the concentration gradient of chemoattractant is photographed by a CCD camera and its velocity is acquired by a simple PTV (Particle Tracking Velocimetry) algorithm. An advantage of this assay is to measure the velocity of a single bacterium and to quantify the degree of chemotaxis by analyzing the frequency of velocities concurrently. Thus, the parameter characterizing the motility of wild-type Escherichia coli strain RP437 in response to various concentration gradients of L-aspartate is obtained in such a manner that the degree of bacterial chemotaxis is quantified on the basis of a newly proposed Migration Index.
Keywords: Chemotaxis, Bacteria, Microchannel, Linear concentration gradient, Hydrodynamic focusing
Introduction
A motile Escherichia coli propels itself by rotating its flagella. To move forward, the flagella are rotated counterclockwise and the organism “swims.” But when the rotation of the flagella is abruptly changed to clockwise, it “tumbles” at its original position and seems incapable of going anywhere. Then the bacterium begins swimming again in some new random direction. Swimming is more frequent as the bacterium approaches favorable chemicals called chemoattractants. Tumbling, i.e., the change of direction, is more frequent as the bacterium moves away from the chemoattractant. Therefore, it is a complex combination of swimming and tumbling that keeps the bacterium in areas of higher food concentration. This phenomenon is called bacterial chemotaxis, whereby bacteria can detect chemotactic stimuli as membrane receptors at the cell surface bind stimulatory ligands (Berg 1975; Stock 1999). From the study of bacterial chemotaxis, we can understand the communication between cells (Park et al. 2003), and apply it to control the environmental pollution (Pandey and Jain 2002). A recent study reported enhancement of diffusion using motile bacteria and proposed bacterial pumps in microfluidic systems (Kim and Breuer 2004).
Two general categories can be conveniently made for the studies on bacterial chemotaxis: population and individual-cell studies. From the population point of view, a micro capillary assay was developed (Mesibov and Adler 1972). This simple approach is the most helpful for qualitative comparison of relative responses to different chemicals. The swarm plate is another commonly used approach (Adler 1966). In the mean time, a device named Stopped Flow Diffusion Chamber (SFDC) was proposed (Ford and Lauffenburger 1991; Ford et al. 1991). This SFDC can create and maintain well-defined gradients throughout the experiments. Recently, microfluidic devices have been developed to generate a stable concentration gradient (CG) of chemoattractants by diffusion between parallel streams within a microfluidic channel. Jeon et al. proposed a device consisting of a network of microfluidic channels that can generate spatially and temporally controlled gradients of chemotactic factors for studying neutrophil chemotaxis (Jeon et al. 2002). Mao et al. developed a microfluidic assay for bacterial chemotaxis, in which a gradient of chemoeffectors is established inside a microchannel via diffusion between parallel streams of liquid in laminar flow. Advantages of their microfluidic assay are that bacteria can be injected into the steepest gradient part of the microchannel, that a high signal-to-noise ratio can be achieved, that the devices can be used to determine the speed of cells by video recording, and that very low attractant concentration, e.g., 3.2 nM L-aspartate, can be generated (Mao et al. 2003). Another microfluidic device introduced by Diao et al. had a membrane-based three-channel configuration to generate the gradient, so that it was possible to generate a static linear chemical gradient in the center channel (Diao et al. 2006). On the other hand, the chemotactic response is also experimentally observed in terms of individual-cell behavior. From the study adopting an individual-cell assay, it was known that an E. coli running to attractant displays more swimming than tumbling (Macnab and Koshland 1972). Liu and Papadopoulos developed a method for measuring chemotaxis parameters at a single-cell level inside a micro capillary (Liu and Papadopoulos 1996).
The objective of the present study is to obtain the chemotaxis data through quantitative analysis based on the observation of each individual cell. In order to quantify the chemotaxis, E. coli cells are injected into the microchannel through a hydrodynamic focusing channel so that they are aligned in a single file. Inside the microchannel a linear CG of chemoattractant is established by diffusion between parallel streams of laminar flow (Curran and Davies 2005; Holden et al. 2003; Kamholz et al. 2001). E. coli cells start to race in the presence of linear CG of chemoattractant after the flow is stopped. Then, we track each cell by using PTV (Particle Tracking Velocimetry) algorithm and carry out quantitative and statistical analysis under various chemical conditions.
Materials and methods
Cultivation and preparation of bacteria
E. coli strain RP437-pET-eGFPmut2 cells (RP437), which are smooth-swimming mutants, are taken into consideration for the present study. The RP437 cells are transformed with a plasmid having enhanced green fluorescence protein (eGFP) for fluorescence measurement and imaging. They are cultured in a Luria-Bertani (LB, Becton Dickinson) medium. This LB medium consists of 1% Trypton, 0.5% Yeast extract and 1% NaCl prepared in deionized H2O and adjusted to pH 7.2. A motility buffer in the experiment consists of 10-mM KH2PO4, 67-mM NaCl and 0.1-mM EDTA. Ampicillin (50 µg/mL) is added to all media to maintain the GFP plasmid. Cells are grown in an LB broth in a test tube containing 4 mL of the medium with aeration at 30°C and 150 rpm until the mid-exponential phase of growth is reached (generally 6 h). L-aspartate is used as chemoattractant. The chemotaxis of E. coli RP437 in response to L-aspartate was confirmed by adopting Adler’s capillary assay (Mesibov and Adler 1972). In the test, more RP437 cells were accumulated near the end of the capillary which contained 10-mM L-aspartate than near the end of the capillary which contained only the buffer solution.
Design and fabrication of microfluidic device
Figure 1(a) shows a layout of the microfluidic device used in the present study. Main features of this device are that focusing channel and gradient channels are jointly connected to the main channel together and that the midway joint-flow channels are devised to expedite the generation of linear CG. More specifically, the flows issuing from the two inlets ③ and ④ for chemoattractants, are divided into four daughter flows and the middle two daughter flows meet at a midway joint-flow channel, which is to generate the linear gradient more rapidly. Then, the three flows become two joint flows and meet the focusing flow at the junction just prior to the main channel. Therefore, this device practically has four inlets: two inlets for buffer and attractant (③, ④), one for bacteria (①), and one for hydrodynamic focusing (②). This device has one outlet for drawing the flow downstream by using a suction pump. The main channel is 23 mm long with a height of 20 µm, the minimum width of 100 µm, and the maximum width of 450 µm.
Fig. 1.

A layout of microfluidic device for bacterial chemotaxis assay. (a) The main channel is 23-mm long, 450-µm wide and 20-µm high. The bacterial inlet is 100-µm wide and each buffer inlet is 100-µm wide. (b) A close-up view of the junction where a focusing channel, gradient channels and a main channel are joined together
This microfluidic channel was fabricated by using the usual soft lithographic techniques and replica molding. First, negative photoresist (SU-8) was patterned onto a silicon wafer, and a mold structure was formed. The silicon master was used to make molds of PDMS (Dow Corning Corp., SYLGARD 184 silicone elastomer). The PDMS replica was taken off from the master after it became hardened and was punched to make inlets and an outlet. Then, the PDMS replica was attached to a slide glass after plasma treatment for 45 s. In addition, a microfluidic device holder with a dimension of 105.5 × 78.25 × 20 mm was fabricated from Teflon for conveniently controlling the flow, which facilitates the functions of reservoir, seal, and junction between channels and tubes (Fig. 2).
Fig. 2.

A schematic of the experimental setup
Experimental setup
As schematically shown in Fig. 2, the experimental setup consists of a microfluidic channel, micro-metering valves (Upchurch Corp., P-445), a 3-way peek valve (Upchurch Corp., V-100 L), tubes, a peristaltic pump (INSTECH Corp., Model P720) and a micro syringe (SGE Corp., 100-µL syringe). First of all, we draw the flow by using a peristaltic pump and generate the CG. The buffer and chemoattractant are made to simultaneously enter the channel from the four reservoirs. Especially, the stream carrying E. coli cells from the inlet ① for bacteria is focused or narrowed by the buffer introduced from the inlet ② for focusing. After the streams of the buffer and chemoattractant through the channel become sufficiently stabilized, we turn off the peristaltic pump and switch the flow to a micro syringe using a 3-way peek valve. Thereafter, we stop the flow by delicately controlling the micro syringe until the streamwise velocities of E. coli cells become almost zero. Since the flow in the micro-channel is laminar, diffusion is the only mode affecting the CG of chemicals. As far as the standard diffusion theory is concerned, the diffusion is proportional to  , where t denotes the time. Therefore, when there is a flow in the micro channel, the CG at the end of the channel is different from that at the beginning, so that the bacteria in the flow are under spatially varying gradient condition. Nevertheless, we decided to stop the flow because it is reasonable to assume that the gradient at different times in a stopped flow is the same as the gradient at different locations in the presence of a flow. In addition, it is easier to visualize the motility of E. coli cells in a stopped flow.
Image acquisition
A PTV technique is adopted to track the loci of E. coli cells and measure their velocities. A mercury lamp combined with a blue filter cube is used as the light source. The white light which is emitted from the mercury lamp is filtered by passing only the blue light through a band-pass filter, which is reflected from a dichroic mirror mounted on the filter cube. Thus, we make the most of the fact that the E. coli cells which have eGFP genes emit the green light of 507-nm wavelength when they are exposed to the blue light of 488-nm wavelength.
The images obtained from tracking E. coli cells are stored in a PC as a sequence of 16-bit TIFF file format of size 688 × 416 pixels, which are acquired by using a Cooled-CCD camera (PCO Corp., SENSICAM) with a 10X objective lens (Olympus Corp., UPlanFl NA 0.3) and a microscope (Olympus Corp., IX50). After the flow is stopped, the images are acquired at a rate of 10 Hz with an exposure time of 50 ms. A mercury lamp and a blue filter are used for light source to generate a light of 488-nm wavelength. However, it is noted that the condition to obtain the images for observing the variation of intensity gradient of Rhodamine B is a little different from this set-up. That is, a mercury lamp and a green filter are used as the light source because Rhodamine B responses to a light of wavelength over 488 nm, while the images are obtained at a rate of 1 Hz with an exposure time of 30 ms.
Tracking the cells and analysis of the motility
The recorded image pairs explained in the previous section are analyzed with a PTV method in the MATLAB programming environment, which tracks individual particles in consecutive image frames and computes the resolved vector for each matched particle. Figure 3 shows two examples of the trajectories of the E. coli cells, i.e., one for the case when there exists a CG of chemoattractant, and the other for the case when there is no chemoattractant. Then, the probability densities of the velocities are analyzed statistically using SPSS statistical software, release 12.0.
Fig. 3.

The trajectories of RP437 cells (a) when it is moving in a CG of chemoattractant and (b) when there is no chemoattractant (a.u. = arbitrary unit)
The E. coli tracking procedure is as follows. First, the effective windows including active E. coli cells are cropped considering the whole sphere of activity to reduce errors and processing time. Second, to remove wall-attached cells, we take an average of all images and the parts which have the intensity over a pre-defined threshold are erased. Third, a global threshold algorithm is applied to find the cells in the effective windows using the grey-level intensity and pixel size information which are also defined previously. Finally, after finding all the cells, the Gaussian curve fit is applied to determine the location of cell centers in the sub-pixel range. For each image pair, the identified cells are matched using a simple particle tracking algorithm of smallest particle displacement.
Particle displacement vectors are determined from the displacements between the matched cell centers. Using the image resolution, and the applied inter-frame time, one velocity vector can be calculated from each displacement vector. Velocity vectors for each E. coli cell under a specific experimental condition are accumulated to a file using the CSV (comma-separated values) file extension, which can be used with SPSS software. The statistical analysis for velocity data, such as mean velocity, standard deviations, histogram, etc., is carried out by using this software. Statistical significances are calculated by One-way ANOVA with an error probability, p. Differences are considered at p < 0.001. In this study, only the velocities of the cells moving toward L-aspartate and away from L-aspartate, i.e., the velocities that are perpendicular to the longitudinal direction of the main channel are considered.
Results and discussion
Generation of linear concentration gradient
One of the great advantages of microfluidics is that the flow in a microchannel has a low Reynolds number so that the streamlines are formed parallel to each other and the fluid is mixed only through convective and molecular diffusion. This advantage is taken for the present microfluidic device to generate CG of the chemoattractant, i.e., L-aspartate. As a preliminary examination on the effectiveness of the present device, we generate a CG of Rhodamine B and visualize the variation of intensity downstream of the junction at which three inlet channels join together. Figure 4(a) shows the spatial intensity distribution of Rhodamine B downstream of the junction, and Fig. 4(b) shows the temporal variation of intensity gradient at 2 mm downstream from the junction. The diffusion coefficient of Rhodamine B is 3 × 10⁻⁶ cm2/s, which is close to that of L-aspartate, 9 × 10⁻⁶ cm2/s.
Fig. 4.

Demonstration of concentration gradient generated in the main channel by using Rhodamine B: (a) Spatial intensity distribution of Rhodamine B in the main channel downstream of the junction, where the scale bar indicates 100 µm, (b) Temporal variation of intensity distribution of Rhodamine B at 2-mm downstream from the junction after the flow is stopped using a 3-way peek valve and a 100-µL syringe
Because the flow should be stopped immediately before tracking the E. coli cells, we have to examine the change of the intensity gradient after stopping the flow. Before stopping the flow, the intensity gradient of Rhodamine B is generated in the main channel flow driven by a peristaltic pump with 0.5 mL/s, where the concentrations of Rhodamine B are 0 mM in the flow through the inlet ① (for bacteria), and 0.01 mM and 0.02 mM, respectively, in the flows through the inlets ③ and ④ (for chemoattractant). After the main channel flow becomes sufficiently steady, it is stopped by using a 3-way peek valve and a 100-µL syringe. In this case, the diffusion starts downstream of the junction where three flows join together. For 60 s, the highest intensity drops down to about 75% of the initial value, and the intensity gradient, which is defined as intensity difference between maximum and minimum values divided by the channel width, decreases from about 1.25 to 0.75, corresponding to the slopes of lines (A) and (C) in Fig. 4(b), respectively. The intensity gradient at 30 s after the stopping is about 1.00, corresponding to the slope of line (B) in Fig. 4(b). Therefore, we argue that the linear CG of L-aspartate does not change significantly for 30 s after the flow is stopped, so that we can measure the motility of E. coli cells at least during a part of this period.
Hydrodynamic focusing of bacterial flow
Another distinctive feature of the present microfluidic device is the alignment of the E. coli cells in a single row by using the hydrodynamic focusing technique (Fig. 5). We realize this by using the potential energy from different heights of the extra reservoirs and control this delicately by using micro-metering valves. Two 10-mL syringes are used for extra reservoirs, which are connected to the inlet ① for bacteria and inlet ② for focusing, respectively (Fig. 1), through micro-metering valves (Upchurch Corp., P-445). The width of the focused stream depends on the ratio α of the side pressure (Ps) to the inlet pressure (Pi): 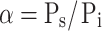 (Knight et al. 1998). We control α by adjusting the heights of the two extra reservoirs and micro-metering valves, one set of which is for Pi and the other is for Ps, so that we are able to reduce the width of the focused stream to 5 ~ 6 µm in the focusing channel of 100-µm width (Fig. 5(b)). Because the average size of the E. coli cells is about 2 µm × 0.8 µm, the cells can be introduced into the main channel in a single file. Consequently, the E. coli cells can be aligned in a single row when the flow is stopped before they start to race in the presence of a CG of L-aspartate. Therefore, we can assume that they start to move to the higher concentration region of L-aspartate under the same initial condition.
Fig. 5.

Demonstration of hydrodynamic focusing: (a) A schematic of hydrodynamic focusing, (b) Hydrodynamic focusing of the sample flow, revealing that the fluorescent E-coli cells are aligned in a single file, where the scale bar indicates 100 µm
Chemotactic trajectories and velocities
Tracking the loci of the E. coli cells is carried out under six conditions, which correspond to the cases of the maximum concentrations of 10−5 M, 10−4 M, 10−3 M, 10−2 M and 10−1 M, and the case of only the motility buffer, respectively. For each case, the motility buffer and the E. coli cells are injected through the inlet ② for focusing and the inlet ① for bacteria, respectively, while 50 % and 100 % concentrations of L-aspartate are injected through the inlets ③ and ④ for chemoattractant, respectively. Because the width of the main channel is 450 µm, the CG for each case is 2.2 × 10⁻⁵ M/mm, 2.2 × 10⁻⁴ M/mm, 2.2 × 10⁻³ M/mm, 2.2 × 10⁻² M/mm, 2.2 × 10⁻¹ M/mm and 0 M/mm.
There are 1–5 cells in each image frame, from which we choose more vigorous RP437 cells and measure their velocities at intervals of 0.1 s while each cell is swimming for 10 s until 30 s have passed after stopping the flow. Figure 6 shows the responses of the E. coli strain RP437 to various CG’s of L-aspartate, as the histograms of probability density or frequency of velocities. The abscissa represents the velocity from −40 µm/s to 40 µm/s, where the negative sign of the velocity means the migration to lower concentration, and the positive sign to higher concentration of L-aspartate. The ordinate represents the frequency of velocity. The numbers on the left upper corner of each chart denote mean velocity, standard deviation and the total number of data, respectively. Because the data for 10 s have been acquired, the number of velocity vectors for each cell is 99, so that the total number of RP437 cells for each set of experiments is the total number of data, N, divided by 99. From Fig. 6(a), RP437 cells are observed to move symmetrically across the channel when there is no chemoattractant. And from Fig. 6(b) ~ (f), we take notice of the tendency that RP437 cells move toward higher concentration region of L-aspartate, but this tendency is not necessarily strongest at the highest CG. Each histogram generally has three peaks at the velocities of about −12 µm/s, +12 µm/s and 0 µm/s. Two peaks at about −12 µm/s and +12 µm/s occur because the average of characteristic velocity of RP437 moving horizontally across the channel is about 12 µm/s. The other peak at 0 µm/s occurs because of tumbling which represents the change of direction at a certain position. Thus, the peak at 0 µm/s is larger than others when there is no chemoattractant (Fig. 6(a)). In the cases of CG = 2.2 × 10⁻⁴ M/mm (Fig. 6(c)) and 2.2 × 10⁻³ M/mm (Fig. 6(d)), the chemotactic behaviors are revealed more vigorously. The peaks at +12 µm/s are significantly higher than other cases. Under higher CG = 2.2 × 10⁻² M/mm (Fig. 6(e)) and 2.2 × 10⁻¹ M/mm (Fig. 6(f)), the peaks at 0 µm/s and −12 µm/s are about the same, which are not so small in comparison with the peak at +12 µm/s. This means that the frequency of velocities moving away from the L-aspartate in this concentration gradient has increased more than that in the lower CG’s, i.e., CG = 2.2 × 10⁻⁴ M/mm and 2.2 × 10⁻³ M/mm. These results agree with those of recent study (Diao et al. 2006).
Fig. 6.

Distribution of the velocities at intervals of 0.1 s for various CG’s of L-aspartate. The abscissa represents the velocity from −40 µm/s to 40 µm/s, where the negative sign means the migration to lower concentration, and the positive sign means the migration to higher concentration. The ordinate represents the probability density of velocity. (a) CG = 0 (no L-aspartate, i.e., only motility buffer), (b) CG = 2.2 × 10⁻⁵ M/mm, (c) CG = 2.2 × 10⁻⁴ M/mm, (d) CG = 2.2 × 10⁻³ M/mm, (e) CG = 2.2 × 10⁻² M/mm, and (f) CG = 2.2 × 10⁻¹ M/mm. The numbers on the left upper corner of each chart represent mean velocity, standard deviation and total number of data, respectively
Quantification of chemotaxis
To quantify the chemotactic behavior, we propose to define a new coefficient, Migration Index (MI), as follows:
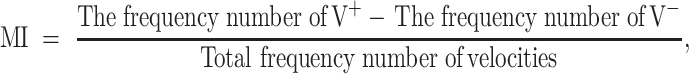 |
where V+ is the positive velocity at which the E. coli cells are moving toward higher concentration region of chemoattractant, and V− is the negative velocity at which the E. coli cells are moving away from the chemoattractant. Then, we note that −1 ≤ MI ≤ 1 and that larger magnitude of MI indicates more active behavior of the E. coli cells. Figure 7(a) depicts the variation of MI with respect to CG of L-aspartate. The positive values mean that the RP437 cells sense and migrate to the high concentration region of L-aspartate. Accordingly, when there is only motility buffer solution without L-aspartate, i.e., CG = 0, then MI ≈ 0. As the CG of L-aspartate becomes steeper, the MI first increases (0 < CG < 2.2 × 10⁻⁴ M/mm) and then decreases (CG > 2.2 × 10⁻⁴ M/mm). This is because the receptors on a cell’s membrane are saturated when the cell is in a highly concentrated solution containing chemoattractants (Diao et al. 2006).
Fig. 7.

(a) The Migration Index of RP437 in response to various CG’s of L-aspartate. (b) The mean velocity of RP437 in response to various CG’s of L-aspartate. A solid line (■) means the velocity moving towards chemoattractant, and a dashed line (●) means the velocity moving away from chemoattractant
The cells moving at the velocity greater than 10 µm/s are chosen because the RMS velocity is 10.1843 µm/s when the cells are in the medium of only motility buffer solution so that cells moving more actively than this are considered. As can be seen from Fig. 7(b), the positive velocities are always higher than the negative velocities except for the two extreme cases of CG = 0 M/mm and 2.2 × 10⁻¹ M/mm. That is, the chemotactic velocity of the cells moving toward higher concentration region of chemoattractant is greater than that toward lower concentration region. Further, even though the difference is not very distinctive, the velocities show the tendency to increase as the CG of L-aspartate becomes steeper for CG < 2.2 × 10⁻² M/mm. This result is a manifestation that a bacterium compares the concentrations of the chemoattractant at different times during its swimming. That is, it takes shorter time for a bacterium to find higher concentration of food, which moves faster in a highly concentrated solution. This is in agreement with earlier findings that a bacterium must be able to move faster to increase food supply before the gradient of food dissipates due to diffusion (Ford et al. 1991; Purcell 1977). An interesting result is that the CG of L-aspartate at which RP437 has the best motility is different from the concentration at which RP437 has the best chemotaxis. The highest velocity occurs at CG = 2.2 × 10⁻² M/mm. Table 1 summarizes all the quantitative data of RP437 in response to various CG’s of L-aspartate throughout this experiment.
Table 1.
Data of RP437 in response to various CG’s of L-aspartate (error probability, p < 0.001)
| Concentration gradient (×2.2 M/mm) | MI | Mean velocity (±STD) moving towards higher concentration of L-aspartate (µm/s) | Mean velocity (±STD) moving towards lower concentration of L-aspartate (µm/s) |
|---|---|---|---|
| No L-aspartate | −0.0292 | 14.65 ± 4.43 | −14.76 ± 4.28 |
| 10−5 | 0.4011 | 15.99 ± 4.54 | −14.38 ± 3.96 |
| 10−4 | 0.6055 | 15.44 ± 4.24 | −14.63 ± 3.79 |
| 10−3 | 0.5507 | 16.45 ± 4.71 | −14.72 ± 3.78 |
| 10−2 | 0.3561 | 18.15 ± 5.45 | −16.97 ± 5.00 |
| 10−1 | 0.2828 | 16.71 ± 4.69 | −16.40 ± 4.90 |
* STD = Standard Deviation
Conclusion
In the present study, we have proposed a microfluidic device to analyze the chemotaxis of bacteria quantitatively. E. coli cells are introduced into the presence of the CG of chemoattractant in a single file by utilizing the hydrodynamic focusing technique so that they start racing under the same concentration gradient condition. Linear CG’s of chemoattractant are generated in the channel by diffusion only because the flow in the microchannel is laminar. The velocity of E. coli cells can be obtained by using a simple PTV algorithm. The advantages of this assay are that it can measure the velocity of a single bacterium and quantify the chemotactic motility by analyzing the probability density or frequency of velocity at the same time.
More specifically, we have analyzed the data of chemotactic motility of wild-type E. coli strain RP437 in response to various CG’s of L-aspartate statistically and quantitatively. We obtained the probability distribution of the velocity, in which there are usually three peaks. From the histograms, we know that there is the characteristic mean velocity of RP437 cells and find an answer to a question: Under which condition are the cells swimming rather than tumbling. Further, the degree of chemotaxis was quantified by analyzing the frequency distribution of velocity on the basis of a newly proposed coefficient, Migration Index. We have found the CG of L-aspartate to be 2.2 × 10⁻⁴ M/mm, at which RP437 cells make the most vigorous response. However, the most effective CG of L-aspartate at which RP437 cells move most rapidly is found to be 2.2 × 10⁻² M/mm. Interestingly, these conditions are not coincident, which can be explained by the fact that the receptors on a cell’s membrane are saturated when cells are in a highly concentrated solution containing chemoattractant, so that the chemotaxis of RP437 decreases after the CG becomes steeper than 2.2 × 10⁻⁴ M/mm, while the chemotactic motility increases until the gradient becomes 2.2 × 10⁻² M/mm. Furthermore, as a result of obtaining the frequency distribution of velocity while RP437 cells are moving at the velocity greater than 10 µm/s, it is found that the velocity towards higher concentration region of chemoattractant is higher than the velocity towards lower concentration region when they are swimming by chemotaxis.
Acknowledgements
This work was supported by Interdisciplinary Research Grant of Basic Research Program and by Micro Thermal System Research Center, both under the auspices of Korea Science and Engineering Foundation.
Open Access
This article is distributed under the terms of the Creative Commons Attribution Noncommercial License which permits any noncommercial use, distribution, and reproduction in any medium, provided the original author(s) and source are credited.
References
- Adler J. Science. 1966;153(3737):708. doi: 10.1126/science.153.3737.708. [DOI] [PubMed] [Google Scholar]
- Berg HC. Annu. Rev. Biophys. Bioeng. 1975;4:119. doi: 10.1146/annurev.bb.04.060175.001003. [DOI] [PubMed] [Google Scholar]
- Curran K, Davies M. Microfluidics Nanofluidics. 2005;1(2):146. doi: 10.1007/s10404-004-0022-7. [DOI] [Google Scholar]
- Diao JP, Young L, Kim S, Fogarty EA, Heilman SM, Zhou P, Shuler ML, Wu M, DeLisa MP. Lab Chip. 2006;6(3):381. doi: 10.1039/b511958h. [DOI] [PubMed] [Google Scholar]
- Ford RM, Lauffenburger DA. Biotechnol. Bioeng. (1991);37(7):661. doi: 10.1002/bit.260370708. [DOI] [PubMed] [Google Scholar]
- Ford RM, Phillips BR, Quinn JA, Lauffenburger DA. Biotechnol. Bioeng. 1991;37(7):647. doi: 10.1002/bit.260370707. [DOI] [PubMed] [Google Scholar]
- Holden MA, Kumar S, Castellana ET, Beskok A, Cremer PS. Sens. Actuators B, Chem. 2003;92(1–2):199. doi: 10.1016/S0925-4005(03)00129-1. [DOI] [Google Scholar]
- Jeon NL, Baskaran H, Dertinger SKW, Whitesides GM, Van De Water L, Toner M. Nat. Biotechnol. 2002;20(8):826. doi: 10.1038/nbt712. [DOI] [PubMed] [Google Scholar]
- Kamholz AE, Schilling EA, Yager P. Biophys. J. 2001;80(4):1967. doi: 10.1016/S0006-3495(01)76166-8. [DOI] [PMC free article] [PubMed] [Google Scholar]
- Kim MJ, Breuer KS. Phys. Fluids. 2004;16(9):L78. doi: 10.1063/1.1787527. [DOI] [Google Scholar]
- Knight JB, Vishwanath A, Brody JP, Austin RH. Phys. Rev. Lett. 1998;80(17):3863. doi: 10.1103/PhysRevLett.80.3863. [DOI] [Google Scholar]
- Liu Z, Papadopoulos KD. Biotechnol. Bioeng. 1996;51(1):120. doi: 10.1002/(SICI)1097-0290(19960705)51:1<120::AID-BIT14>3.0.CO;2-U. [DOI] [PubMed] [Google Scholar]
- Macnab RM, Koshland DE., Jr Proc. Natl. Acad. Sci. U. S. A. 1972;69(9):2509. doi: 10.1073/pnas.69.9.2509. [DOI] [PMC free article] [PubMed] [Google Scholar]
- Mao H, Cremer PS, Manson MD. Proc. Natl. Acad. Sci. U. S. A. 2003;100(9):5449. doi: 10.1073/pnas.0931258100. [DOI] [PMC free article] [PubMed] [Google Scholar]
- Mesibov R, Adler J. J. Bacteriol. 1972;112(1):315. doi: 10.1128/jb.112.1.315-326.1972. [DOI] [PMC free article] [PubMed] [Google Scholar]
- Pandey G, Jain RK. Appl. Environ. Microbiol. 2002;68(12):5789. doi: 10.1128/AEM.68.12.5789-5795.2002. [DOI] [PMC free article] [PubMed] [Google Scholar]
- Park S, Wolanin PM, Yuzbashyan EA, Silberzan P, Stock JB, Austin RH. Science. 2003;301(5630):188. doi: 10.1126/science.1079805. [DOI] [PubMed] [Google Scholar]
- Purcell EM. Am. J. Phys. 1977;45(1):3. doi: 10.1119/1.10903. [DOI] [Google Scholar]
- Stock J. Trends Microbiol. 1999;7(1):1. doi: 10.1016/S0966-842X(98)01429-2. [DOI] [PubMed] [Google Scholar]