Abstract
A label-free quantification strategy including the development of in-house software (NakedQuant) to calculate the average TIC across all spectral counts in tandem affinity purification (TAP)-tagging liquid chromatography-mass spectrometry MS/MS (LC/MS/MS) experiments was applied to a large-scale study of protein complexes in the MAPK portion of the insulin signaling pathway from Drosophila cells. Dynamics were calculated under basal and stimulating conditions as fold changes. These experiments were performed in the context of a core service model with the user performing the TAP immunoprecipitation and the MS core performing the MS and informatics stops. The MS strategy showed excellent coverage of known components in addition to potentially novel interactions.
Keywords: LC/MS/MS, quantification, proteomics, signal transduction, average TIC, spectral counting, protein–protein interaction, networks
Large-scale proteomics experiments similar to those introduced by Gavin et al.1 are needed to interrogate protein–protein interactions in cellular signaling pathways to uncover new targets for disease and understand biological functions. Tandem affinity purification (TAP)-mass spectrometry (MS) experiments on fifteen bait proteins in the MAPK pathway in Drosophila S2R+ cells, with and without insulin and stimulation. Protein differences were quantified by calculating average total ion current (TIC) values from all identified peptide MS/MS spectra (spectral counts)/protein from data-dependent liquid chromatography (LC)/MS/MS runs.2
We developed a software suite called NakedQuant v1.0 that uses several features, including protein grouping across biological samples by BLAST, normalization of individual proteins, or entire biological samples, and fold-change calculations. From the output, protein–protein interaction networks were assembled based on the protein signal changes between the basal and stimulated conditions. The network revealed excellent coverage of known bait protein interactions and many novel interactionsin the MAPK signaling pathway. The TAP procedure helps to reduce nonspecific interactions. These data show that novel interactions in signaling pathways through protein–protein interaction studies from immunoprecipitations (IP) of intact protein complexes are effective using simple label-free MS approaches. The project also shows that large-scale experiments are possible within the “core” service model.
MATERIALS AND METHODS
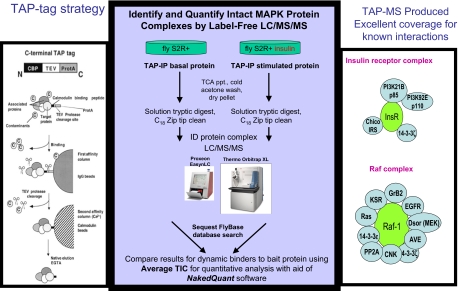
TAP Tag and MAPK Bait Protein Preparation (Figure 1)
FIGURE 1.
Identify and quantify intact MAPK protein complexes by label-free LC/MS/MS. CBP, Calmodulin-binding protein; TEV, Tobacco Etch virus; ProtA, protein A; InsR, insulin receptor; IRS, insulin receptor substrate; ppt, precipitate; ID, identification.
TAP tags were incorporated into 15 bait proteins of the MAPK branch of the insulin signaling pathway in S2R+ Drosophila cells. For each bait, cell pools were untreated or treated with insulin for 10 min. Cells were then lysed and immunoprecipitated using a IgG-Sepharose column and TEV protease elution, followed by a calmodulin-Sepharose (calcium) column and EGTA elution. Protein complex elutions were cleaned by TCA precipitation, reduced/alkylated with iodoacetamide, and digested with trypsin overnight. The digests were cleaned using C18 ZipTip, SpeedVac-concentrated, and injected into the LC-MS/MS system.
Data Acquisition/Validation (Figure 2)
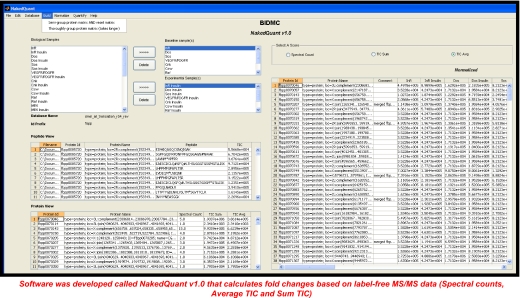
FIGURE 2.
NakedQuant v1.0 label-free quantitative software suite.
Data-dependent LC/MS/MS experiments were run using a Proxeon EasynLC at 300 nL/min coupled to a Thermo LTQ-Orbitrap XL for two replicates of each bait condition (basal and insulin-stimulated) for a total of 64 LC/MS/MS experiments including TAP tag controls over a 6-month period. The data were searched against the reversed Fly Base protein database as a result of its completeness using the Sequest algorithm within Proteomics Browser software. Protein sequence lists were validated by setting a 1.5% false discovery rate threshold for protein identifications based on the number of reversed database hits and requiring at least two unique peptides/protein.
Label-Free Quantification by Average TIC
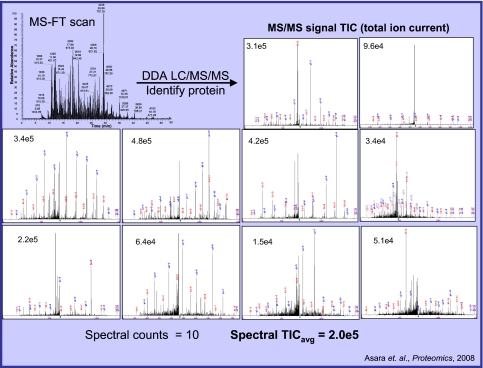
Validated protein reports were imported into in-house-developed software (NakedQuant v1.0). The software was developed for label-free MS/MS-based quantification. Proteins were grouped across 31 biological samples (15 bait proteins, basal and stimulated, and one TAP control) by BLAST (93% protein identity/78% peptide identity). A baseline of one spectral count and 3.50 × 10E5 TIC was set for proteins not detected in some biological conditions. Proteins were then normalized across the entire biological sample set by setting the total number of spectral counts and/or average TIC to equal values or based on single bait proteins between conditions (Figure 3). Average TIC was calculated using total ion current (TIC) values from all identified MS/MS spectra (spectral counts) per identified protein. Fold changes between the basal and stimulated states for each bait protein were then calculated and displayed in a matrix format. Quantitative interactions were displayed graphically using Cytoscape.
FIGURE 3.
Example of average TIC calculation for label-free quantification.2 FT, Fourier transform; DDA, data-dependent acquisition.
RESULTS
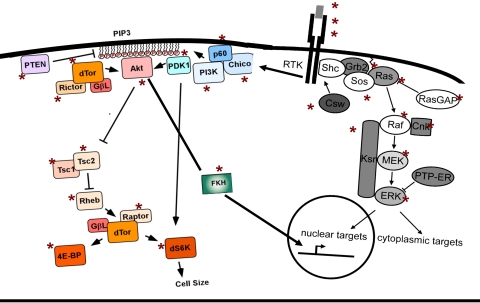
FIGURE 4.
The Drosophila insulin signaling pathway. PIP3, Phosphatidylinositol 3,4,5-triphosphate; PTEN, phosphatase and tensin homologue deleted on chromosome 10; dTor, target of rapamycin Drosophila; PDK1, phosphoinositide-dependent kinase-1; FKH, forkhead; RTK, receptor tyryosine kinase; PTP-ER, protein tyrosine phosphatase-ERK/enhancer.
FIGURE 5.
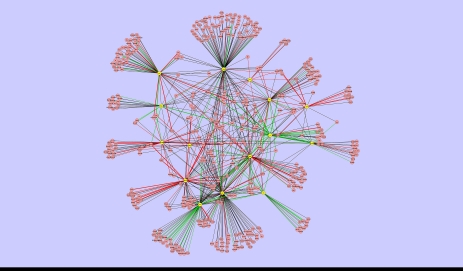
LC/MS/MS modeling of the Dynamic MAPK pathway protein–protein interaction network.
FIGURE 6.
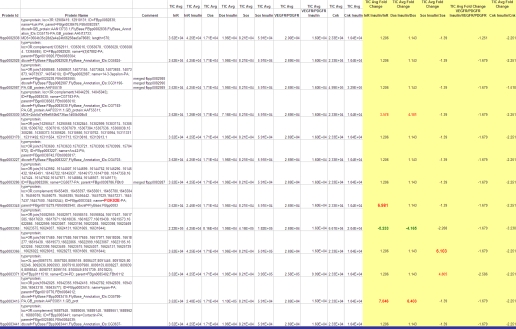
Example of grouped proteins TIC average fold-change output from NakedQuant v1.0.
FIGURE 7.
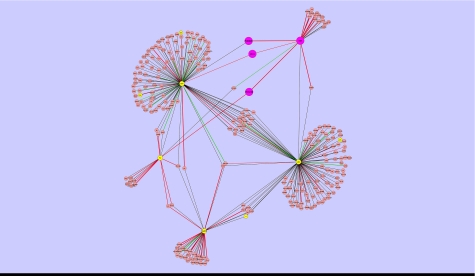
The Dynamic PI3K sub-network in MAPK pathway by LC/MS/MS.
FIGURE 8.
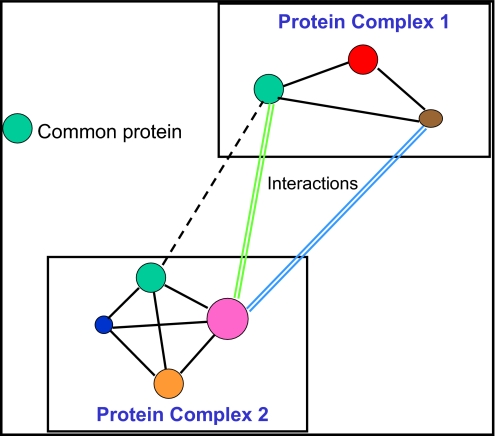
IP-MS-based approach for finding protein-protein interactions.
CONCLUSIONS
Protein–protein interactions (814) were identified from 15 bait TAP-MS experiments under basal and stimulated conditions, representing 526 proteins.
The canonical network and sub-networks were dynamically established with excellent coverage/bait protein in the MAPK insulin signaling pathway.
A dynamic network was established successfully using average TIC from data-dependent LC-MS/MS/MS experiments.
Software was developed to handle large-scale, label-free quantitative projects.
REFERENCES
- 1.Gavin AC, Bösche M, Krause R, et al. Functional organization of the yeast proteome by systematic analysis of protein complexes. Nature 2002; 10: 141– 147 [DOI] [PubMed] [Google Scholar]
- 2.Asara JM, Christofk HR, Freimark LM, Cantley LC. A label-free quantification method by MS/MS TIC compared to SILAC and spectral counting in a proteomics screen. Proteomics 2008; 8: 994– 999 [DOI] [PubMed] [Google Scholar]
- 3.Friedman A, Perrimon N. A functional RNAi screen for regulators of receptor tyrosine kinase and ERK signaling. Nature 2006; 444: 230– 234 [DOI] [PubMed] [Google Scholar]


