

Abstract
Loops connect regular secondary structures. In many instances, they are known to play important biological roles. Analysis and prediction of loop conformations depend directly on the definition of repetitive structures. Nonetheless, the secondary structure assignment methods (SSAMs) often lead to divergent assignments. In this study, we analyzed, both structure and sequence point of views, how the divergence between different SSAMs affect boundary definitions of loops connecting regular secondary structures. The analysis of SSAMs underlines that no clear consensus between the different SSAMs can be easily found. Because these latter greatly influence the loop boundary definitions, important variations are indeed observed, that is, capping positions are shifted between different SSAMs. On the other hand, our results show that the sequence information in these capping regions are more stable than expected, and, classical and equivalent sequence patterns were found for most of the SSAMs. This is, to our knowledge, the most exhaustive survey in this field as (i) various databank have been used leading to similar results without implication of protein redundancy and (ii) the first time various SSAMs have been used. This work hence gives new insights into the difficult question of assignment of repetitive structures and addresses the issue of loop boundaries definition. Although SSAMs give very different local structure assignments capping sequence patterns remain efficiently stable.
Keywords: protein structures, biochemistry, amino acids, secondary structures, propensities
Introduction
The knowledge of the three-dimensional (3D) structures of proteins contributes to understand their biological functions. Protein 3D structures are often described as a succession of repetitive secondary structures (mainly α-helices and β-sheets1,2). This mono-dimensional description helps to simplify coarsely this 3D information. It can also be used to describe more complex local 3D motifs, for example, the Greek key,3 or even complete 3D structures in 2D views, for example, HERA4 or TOPS.5
Numerous approaches exist to assign secondary structure and rely on various descriptors (see Table I).
Table I.
Secondary Structure Assignment Methods
| Methods | Year | Assignment Based On |
|---|---|---|
| Greer and Levitt | 1977 | Distance |
| DSSP | 1983 | H-bond |
| DEFINE | 1988 | Distance |
| PCURVE | 1989 | Axis |
| SSTRUC | 1989 | H-bond |
| CONCENSUS | 1993 | Mean (DSSP, DEFINE, and PCURVE) |
| STRIDE | 1995 | H-bond/dihedral |
| PROMOTIF | 1996 | H-bond/dihedral |
| PSEA | 1997 | Distance/angle |
| PROSS | 1999 | Dihedral |
| XTLSSTR | 1999 | Distance/angle |
| DSSPcont | 2002 | H-bond |
| SECSTR | 2002 | H-bond |
| VORO3D | 2004 | Voronoï tessalation |
| KAKSI | 2005 | Distance/dihedral |
| SEGNO | 2005 | angle/multiple |
| Beta-Spider | 2005 | β-sheet + DSSP for α-helix |
| PALSSE | 2005 | Cα (vector similarity) |
| Delaunay tessellation | 2005 | Delaunay tessalation |
| SKSP | 2007 | Mean (STRIDE, DSSP, SECSTR, KAKSI, P-SEA, and SEGNO) |
| PROSIGN | 2008 | Cα deviation values |
A first class of methods is based solely on H-bond patterns. In this category, DSSP6 remains the most popular secondary structure assignment methods (SSAMs). It identifies the secondary structures by particular hydrogen bond patterns detected from the protein geometry and an electrostatic model. DSSP is the basis of the assignment done by the Protein DataBank (PDB).7,8 A recent version of DSSP called DSSPcont was proposed by Rost.9 SECSTR is also an evolution of DSSP method dedicated to improved π-helices detection.10
A second class of SSAMs add dihedral angle properties to H-bond patterns. In this category, STRIDE, developed in 1995, is the second widely used SSAM.11 PROMOTIF derives also from the DSSP approach, namely the software SSTRUC,12 but focus on the characterization of γ- and β-turns, β-hairpins, and β-bulges.13
The third class of secondary structure assignment methods relies on distances between residues inside protein structures. Additionally, this criterion has also been extended by taking into account angles. The DEFINE method,14 like the Levitt's and Greer's method,15 uses only the Cα positions. It computes inter-Cα distance matrix and compares it with matrices produced by ideal repetitive secondary structures. KAKSI is a new assignment method of assignation using the inter-Cα distances and dihedral angles criteria.16 PSEA assigns the repetitive secondary structures from the sole Cα position using distance and angles criteria.17 XTLSSTR uses all the backbone atoms to compute two angles and three distances.18
Fourth, some SSAMs are defined solely on angles. PROSS is based only on the computation of φ and Ψ dihedral angles. The Ramachandran map is divided into mesh of 30 or 60° and the secondary structures are assigned in regards to their successions of encoded mesh.19 SEGNO uses also the φ and Ψ dihedral angles coupled with other angles to assign the secondary structures.20
Fifth, VoTap (Voronoï Tessellation Assignment Procedure) is a geometrical tool that associates with each amino acid a Voronoï polyhedron,21 the faces of which define contacts between residues.22 In the same way, Vaisman and coworkers have developed a simple five-element descriptor, derived from the Delaunay tessellation of a protein structure in a single point per residue representation, which can be assigned to each residue in the protein.23
A sixth category of SSAM relies on geometrical definitions and Cα coordinates. PCURVE is based on the helical parameters of each peptide unit, generates a global peptide axis and makes use of an extended least-squares minimization procedure to yield the optimal helical description.24 PALSSE delineates secondary structure elements from protein Cα coordinates, and specifically addresses the requirements of vector-based protein similarity searches25; this approach leads to surprising assignment where a residue can be associated to a α-helix and also to a β-strand. Very recently, PROSIGN proposed a different approach based solely on Cα coordinates.26 Hosseini and coworkers introduce four certain relations between Cα three-dimensional coordinates of consecutive residues, their method gives interesting information about helix geometry.
Finally, some SSAMs like Beta Spider could be considered more as hybrid or consensus methods. For instance, Beta Spider focuses only on β-sheet (the α-helix assignment is performed by DSSP) by considering all the stabilizing forces involved in the β-sheet phenomenon.27
As a consequence, these different assignment methods have generated specific weaknesses. For example, DSSP can generate very long helices that can be classified as linear, curved or kinked.28–30 This was one of the motivations of KAKSI methodology to define linear helices instead of long kinked helices.16 Moreover, the disagreement between the different SSAMs is not negligible, leading to only 80% of agreement between two distinct methods.16,31–33 Consensus methods have been proposed using (i) DEFINE, P-CURVE, and DSSP32 and (ii) more recently, P-SEA, KAKSI, SECSTR, and STRIDE,34 to diminish such features.
The coil state is in fact composed of really distinct local folds,35–38 such as turns.13,39–44 Several studies have attempted to analyze conformation of loops linking specific secondary structures forming distinct subsets.45–51 They are biologically essential regions,52 for example, loops of protein kinases.53,54 They are also used to analyze protein homology,55–60 for example, for structure-based phylogenetic study.61 Because of their flexible nature they raise crucial questions in protein docking approaches,62–64 to predict protein loop conformations,65–78 to enhance protein thermostability,79 to design proteins,80 or to obtain protein structures.81 According to the repetitive secondary structures of their extremities, connecting loops are of four distinct classes (α-α, α-β, β-α, and β-β).46,82–84 The research on loops has always been limited by the number of available loops in protein structures from the Protein DataBank (PDB,7,8), so most of the works focus on loops of less than nine residues.85,86
Analyses have shown that capping regions of repetitive structures have specific amino acid compositions. George Rose analysis of helix signals in proteins highlighted the hydrophobic capping,87 an hydrophobic interaction that straddles the helix terminus is always associated with hydrogen-bonded capping. From a global survey of protein structures, they identified seven distinct capping motifs, three at the helix N-terminus and four at the C-terminus.88 Recently, Kruus and coworkers have studied helix-cap sequence motifs. Their study is based on a very innovative approach. Indeed, they firstly assigned the helix of well-determined protein structures. Then, they searched for the sequence motifs corresponding at best to the capping regions. This search is based on Gibbs sampling method. They showed an important number of frameshifts of ±1 amino acid residue.89 To date, no similar properties have been reported directly on β-strands.
In this article, we focus on the analysis of loop boundaries, that is, capping regions of repetitive structures. We analyzed the disagreement between SSAMs for the definition of these capping regions and evaluated if the structural disagreement is associated with clear frameshift at the sequence level.
Results
Protein databanks
The constitution of the protein dataset is always crucial for protein structure analysis and prediction. In the case of loop predictions, another major problem is the right choice of the sequence similarity cut-off used to construct training datasets. Indeed, a 30% sequence identity nonredundant dataset corresponds to 10–20% sequence identity in coil regions. Thus, we have used different cut-off criteria ranging from 20 to 90% and constructed 10 different datasets (see Supporting Information 1) to sample different sequence identity rates and analyze the influence of sequence identity on capping regions. Crystallographic structures in these datasets were selected at two resolution levels: three datasets were filtered for high resolution quality (resolution better than 1.6 Å) and seven were filtered for good resolution quality (resolution better than 2.5 Å). The datasets have been extracted from PISCES database.90,91
Table II summarizes, for each of the 10 datasets in our study, the secondary structure assignment done by different secondary structure assignment methods (SSAMs). The classical differences observed between (SSAMs) are found again,33 that is, α-helices frequency ranges mainly between 28 and 34% and β-strand between 18 and 24%. Some SSAMs have particular behaviors like KAKSI16 that is associated to a high β-strand frequency (∼28%) or DEFINE14 with a low α-helix frequency (∼24%). Nonetheless, for each SSAM, both mean frequency of secondary structures and length of repetitive structures remain surprisingly highly comparable for all the datasets; neither number of residues, nor sequence identity rate, nor resolution quality had an effect on the secondary structure features. In the following, the presented results will concern DB0 except when noted.
Table II.
10 Protein Databanks
| DB0 |
DB1 |
DB2 |
DB3 |
DB4 |
|||||||
|---|---|---|---|---|---|---|---|---|---|---|---|
| freq | lg | freq | lg | freq | lg | freq | lg | freq | lg | ||
| DSSP | α | 33.17 | 10.66 | 34.51 | 11.21 | 34.46 | 11.14 | 34.07 | 11.09 | 33.70 | 11.02 |
| β | 21.52 | 5.30 | 21.60 | 5.44 | 21.64 | 5.42 | 21.85 | 5.41 | 21.86 | 5.39 | |
| coil | 45.3 | 43.88 | 43.91 | 44.08 | 44.44 | ||||||
| STRIDE | α | 30.78 | 11.12 | 34.15 | 11.76 | 34.07 | 11.69 | 33.74 | 11.63 | 33.47 | 11.56 |
| β | 19.7 | 5.34 | 20.89 | 5.47 | 21.10 | 5.45 | 21.38 | 5.44 | 21.39 | 5.42 | |
| coil | 49.51 | 44.96 | 44.83 | 44.88 | 45.14 | ||||||
| SECSTR | α | 31.38 | 10.93 | 32.72 | 11.56 | 32.62 | 11.48 | 32.25 | 11.43 | 31.88 | 11.36 |
| β | 20.32 | 4.98 | 20.22 | 5.11 | 20.29 | 5.10 | 20.48 | 5.09 | 20.57 | 5.07 | |
| coil | 48.3 | 47.06 | 47.10 | 47.27 | 48.75 | ||||||
| XTLSSTR | α | 32.13 | 10.64 | 32.83 | 11.18 | 32.62 | 11.10 | 32.23 | 11.04 | 31.87 | 10.98 |
| β | 19.57 | 4.91 | 19.05 | 5.02 | 19.14 | 5.01 | 19.34 | 5.00 | 19.38 | 4.99 | |
| coil | 48.3 | 48.12 | 48.24 | 48.44 | 48.75 | ||||||
| PSEA | α | 34.04 | 10.78 | 35.56 | 11.30 | 35.48 | 11.23 | 35.09 | 11.17 | 34.68 | 11.11 |
| β | 24.01 | 5.16 | 24.49 | 5.27 | 24.48 | 5.26 | 24.72 | 5.25 | 24.84 | 5.24 | |
| coil | 41.95 | 39.94 | 40.04 | 40.18 | 40.48 | ||||||
| DEFINE | α | 28.35 | 10.95 | 25.60 | 11.42 | 26.25 | 11.36 | 26.38 | 11.30 | 26.12 | 11.24 |
| β | 25.89 | 5.39 | 22.39 | 5.47 | 23.12 | 5.47 | 23.48 | 5.46 | 23.48 | 5.45 | |
| coil | 45.76 | 52.01 | 50.63 | 50.14 | 50.40 | ||||||
| KAKSI | α | 29.66 | 11.12 | 27.36 | 11.57 | 28.25 | 11.51 | 28.45 | 11.45 | 28.83 | 11.40 |
| β | 28.91 | 5.53 | 25.87 | 5.59 | 26.69 | 5.59 | 27.12 | 5.58 | 27.84 | 5.58 | |
| coil | 41.43 | 46.78 | 45.06 | 44.43 | 43.34 | ||||||
| SEGNO | α | 30.17 | 10.99 | 31.64 | 11.43 | 31.71 | 11.37 | 31.32 | 11.31 | 30.92 | 11.27 |
| β | 21.26 | 5.58 | 21.26 | 5.65 | 21.36 | 5.65 | 21.50 | 5.63 | 21.52 | 5.63 | |
| coil | 48.58 | 47.10 | 46.93 | 47.17 | 47.56 | ||||||
| PBs | α | 31.39 | 10.65 | 33.02 | 11.11 | 32.84 | 11.05 | 32.45 | 10.99 | 32.05 | 10.94 |
| β | 18.25 | 5.39 | 18.64 | 5.46 | 18.64 | 5.45 | 18.77 | 5.44 | 18.85 | 5.44 | |
| coil | 50.35 | 48.35 | 48.51 | 48.79 | 49.10 | ||||||
| Nb res | 162,830 | 565,364 | 712,075 | 870,094 | 1,132,639 | ||||||
| Nb chains | 887 | 2722 | 3325 | 3983 | 5081 | ||||||
| pc | 20 | 20 | 25 | 30 | 40 | ||||||
| res | 1.6 | 2.5 | 2.5 | 2.5 | 2.5 | ||||||
| R factor | 0.25 | 1.00 | 1.00 | 1.00 | 1.00 | ||||||
| DB5 |
DB6 |
DB7 |
DB8 |
DB9 |
|||||||
| freq | lg | freq | lg | freq | lg | freq | lg | freq | lg | ||
| DSSP | α | 32.18 | 10.69 | 33.60 | 11.10 | 33.37 | 10.99 | 33.17 | 10.98 | 31.56 | 10.70 |
| β | 21.77 | 5.31 | 22.03 | 5.45 | 21.76 | 5.37 | 21.90 | 5.37 | 22.18 | 5.31 | |
| coil | 46.05 | 44.37 | 44.87 | 44.93 | 46.25 | ||||||
| STRIDE | α | 29.96 | 11.15 | 33.60 | 11.66 | 33.25 | 11.54 | 33.09 | 11.53 | 29.60 | 11.18 |
| β | 19.88 | 5.34 | 21.57 | 5.47 | 21.37 | 5.40 | 21.53 | 5.40 | 20.34 | 5.34 | |
| coil | 50.16 | 44.83 | 45.38 | 45.38 | 50.06 | ||||||
| SECSTR | α | 30.41 | 10.96 | 31.90 | 11.46 | 31.58 | 11.34 | 31.40 | 11.34 | 29.83 | 10.98 |
| β | 20.73 | 4.99 | 20.67 | 5.13 | 20.53 | 5.06 | 20.67 | 5.06 | 21.15 | 4.99 | |
| coil | 48.86 | 47.43 | 47.89 | 47.93 | 49.02 | ||||||
| XTLSSTR | α | 31.13 | 10.65 | 31.95 | 11.08 | 31.63 | 10.96 | 31.45 | 10.96 | 30.61 | 10.68 |
| β | 19.83 | 4.92 | 19.48 | 5.04 | 19.32 | 4.97 | 19.44 | 4.97 | 20.21 | 4.93 | |
| coil | 49.05 | 48.57 | 49.05 | 49.10 | 49.18 | ||||||
| PSEA | α | 32.96 | 10.80 | 34.47 | 11.22 | 34.30 | 11.10 | 34.11 | 11.09 | 32.41 | 10.83 |
| β | 24.37 | 5.17 | 25.00 | 5.28 | 24.80 | 5.22 | 24.97 | 5.23 | 24.86 | 5.18 | |
| coil | 42.67 | 40.52 | 40.90 | 40.93 | 42.73 | ||||||
| DEFINE | α | 28.02 | 10.95 | 26.70 | 11.34 | 26.52 | 11.22 | 26.41 | 11.22 | 26.91 | 10.97 |
| β | 26.10 | 5.39 | 24.29 | 5.49 | 23.91 | 5.44 | 24.01 | 5.44 | 26.12 | 5.40 | |
| coil | 45.89 | 49.01 | 49.57 | 49.58 | 46.97 | ||||||
| KAKSI | α | 29.45 | 11.14 | 29.14 | 11.49 | 28.84 | 11.38 | 28.66 | 11.38 | 27.98 | 11.14 |
| β | 30.00 | 5.56 | 28.27 | 5.82 | 28.29 | 5.58 | 28.23 | 5.58 | 29.16 | 5.56 | |
| coil | 40.55 | 42.58 | 42.88 | 43.11 | 42.86 | ||||||
| SEGNO | α | 29.41 | 11.00 | 31.34 | 11.36 | 30.61 | 11.24 | 30.43 | 11.24 | 28.24 | 11.00 |
| β | 21.28 | 5.61 | 22.06 | 5.68 | 21.49 | 5.64 | 21.66 | 5.64 | 21.55 | 5.62 | |
| coil | 49.31 | 46.60 | 47.91 | 47.92 | 50.21 | ||||||
| pBs | α | 30.62 | 10.65 | 32.04 | 11.02 | 31.71 | 10.91 | 31.54 | 10.91 | 32.08 | 10.65 |
| β | 18.59 | 5.41 | 18.88 | 5.48 | 18.78 | 5.45 | 18.90 | 5.45 | 18.87 | 5.42 | |
| coil | 50.79 | 49.09 | 49.51 | 49.56 | 51.05 | ||||||
| Nb res | 276,586 | 415,360 | 1,513,629 | 1,572,412 | 312,219 | ||||||
| nb chains | 1425 | 5847 | 6823 | 7141 | 1630 | ||||||
| pc | 50 | 50 | 70 | 80 | 90 | ||||||
| res | 1.6 | 2.5 | 2.5 | 2.5 | 1.6 | ||||||
| R factor | 0.25 | 1.00 | 1.00 | 1.00 | 0.25 | ||||||
This table summarizes all the 10 protein databanks (noted from DB 0 to DB 9) used in this study. Each databank is analyzed using different SSAMs, are given the frequencies of secondary structure (freq) and average length of repetitive structures (lg), with the total number of amino acids (NB res), the number of protein chains (nb chains), the maximum percentage of sequence identity (pc), the resolution (res) and R factor.
Figure 1 shows an example of Hhai Methyltransferase92 assigned by different SSAMs, it highlights visually how the differences can be important (see also Supporting Information 2). In the same way, the computation of C3, that is, the agreement rates between SSAMs (see Methods section), gives also similar results to previous works16,33,93 (see Fig. 2). Briefly, SSAMs based on hydrogen bond assignments (DSSP, STRIDE, and SECSTR) produced nearly identical assignments, with C3 more than to 90%. Otherwise, a mean C3 of 80% was observed, with SEGNO displaying a closer C3 value to hydrogen bond assignments than the others. DEFINE remains very different from the other methods with C3 values close to 60%. Comparison of all theses SSAMs clearly highlights the intricacy of obtaining a simple consensus between all the methods.
Figure 1.
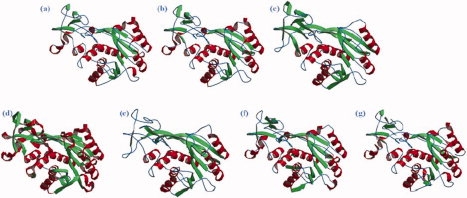
SSAMs of Hhai Methyltransferase. Example of secondary structure assignments for the Hhai Methyltransferase (PDB code :10MH92) with (a) DSSP, (b) STRIDE, (c) PSEA, (d) DEFINE, (e) PCURVE, (f) XTLSSTR, and (g) SECSTR. All the methods have been reduced to three states with the helical states in red ribbons, the extended state in green arrows, and the coil in blue line. [Color figure can be viewed in the online issue, which is available at www.interscience.wiley.com.]
Figure 2.
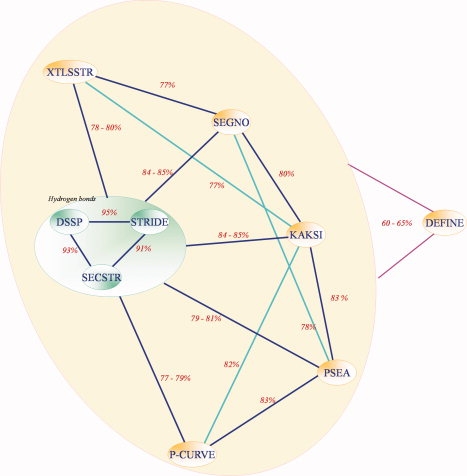
C3 values for different SSAMs (DB0 dataset). [Color figure can be viewed in the online issue, which is available at www.interscience.wiley.com.]
Analyses of the structural agreement between the capping regions of repetitive secondary structures
These results highlight the difficulties to define an appropriate length for α-helices, β-strands, and coils and locating their extremities.87,88,94-98 Inaccuracies in defining the repetitive structures have direct repercussions on the definition of loops. Thus, we have analyzed the positions of capping positions of repetitive structures as assigned by DSSP and systematically looked for their counterparts in assignments performed by another SSAM (only long repetitive structures of more than six residues have been used). Figure 3 shows some examples of this systematic comparison (see Supporting Information 3 for all the examples). Each figure compares a SSAM with DSSP. On the x-axis are given the positions of the N- and C-caps of α-helices (top) and β-strands (bottom) obtained by each method with respect to reference DSSP assignments (labeled “N-cap” or “C-cap” on this x-axis). On the y-axis are given the corresponding observed frequencies. For instance, C-cap position of α-helix assigned by DSSP corresponds to 43% of C1, 42% of Ccap and 4% of C1′ positions assigned by STRIDE (see Fig. 3, pattern 2). Five characteristic patterns could be identified:
pattern 1, the capping position of the SSAM is the same than DSSP (in red),
pattern 2, same capping position as DSSP and an adjacent positions are found,
pattern 3, No preferred capping positions could be identified, they are distributed over the whole window range,
pattern 4, it is another position that is considered preferably as the capping residue by the other SSAM,
pattern 5, due to the definition of repetitive structures, the capping position is not within the range −4 to +4 around the capping position of DSSP.
Figure 3.
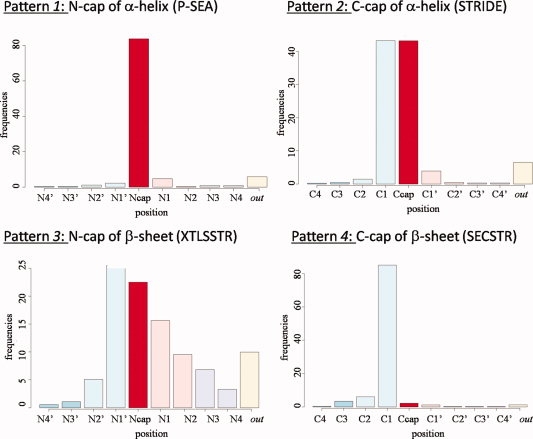
Examples of discrepancies between N or C cap positions assigned by DSSP with other SSAMs. Examples of the four kinds of differences are shown. (x-axis) the position of the capping region, (y-axis) frequencies of N or C cap central positions of SSAMs according to DSSP. Central positions are in red color. [Color figure can be viewed in the online issue, which is available at www.interscience.wiley.com.]
Using the above categorization scheme, we can conveniently classify assignment methods based on how their capping positions differ from DSSP (see Supporting Information 4). It can also be used to show how well the four different capping regions are resolved. Hence, α-helix N cap displays four patterns 1, whereas β-sheet N cap displays only two patterns 1, but also two patterns 3 and two patterns 5, that is, the capping regions of β-sheet are more variably described than those of α-helix for which the correspondence between SSAMs is quite easily found. For the C caps, it goes to a higher level of complexity. Thus, α-helix C cap has only one pattern 2, two patterns 3 and three patterns 4, while the β-sheet C cap is characterized by four patterns 4, that is, the correspondence between SSAMs are quite complex. Surprisingly, even the SSAM related to DSSP are not strictly equivalent to it, for example, β-sheet N cap of STRIDE and SECSTR are shifted by (−1) residue. These results highlight greatly the difficulties to assign the β-strand extremities, while α-helix is in comparison more “conserved.” Previous works done using other SSAMs as standard gave similar results.
Amino acid distributions in capping regions
Table III shows the over- and under-representation of amino acid of the different SSAMs in terms of Z-scores.99 Thus, at each position of each SSAM is given the important amino acids. KLd100 values were also computed to locate the most informative positions (see Supporting Information 5). For the following paragraphs, we use a notation (x/y)pz that corresponds to the amino acid (x) over- and (y) under-represented at the position z. N capping regions of α-helices (Table III) show a strong pattern (PSTND/IVLMAFYQERK)p1 (PE/GN)p2 (AQDE/IGN)p3 where p1 corresponds to position N1′ for DSSP, STRIDE, SECSTR, PSEA, and SEGNO and Ncap for XTLSSTR and KAKSI. This position p1 is associated to a high KLd value.
Table III.
Amino Acid Over- and Under-Representation at Capping Regions
| C cap betaa | C2 | C1 | Ccap | C1′ | C2′ | C3′ | |
|---|---|---|---|---|---|---|---|
| DSSP | (+) | G | M | PSTND | WPE | AQDE | QDE |
| STRIDE | (+) | PG | M | PGSTND | P | ADE | QDE |
| SECSTR | (+) | PG | MP | STND | PE | ADE | AQDE |
| XTLSSTR | (+) | G | P | STND | PSTND | APE | QDE |
| PSEA | (+) | G | MG | GSTND | PE | AQDE | AQDE |
| DEFINE | (+) | D | PSD | AE | E | AE | |
| KAKSI | (+) | P | G | P | PSTAND | APE | ADE |
| SEGNO | (+) | G | MP | GSTND | WPE | AQDE | AQDE |
| PBs | (+) | PSTND | PD | DE | QDE | ILAF | LAQERK |
| DSSP | (−) | IVLMAFYQERK | GN | IVLFG | PGN | ||
| STRIDE | (−) | IVLAFYWQERK | GN | IVLFG | PGN | ||
| SECSTER | (−) | IVLMAFYERK | GN | IVLFG | PGN | ||
| XTLSSTR | (−) | VAEK | IVLAF | VGTN | IPGN | ||
| PSEA | (−) | IVLAFQERK | GN | IVLG | PGN | ||
| DEFINE | (−) | IV | N | PG | |||
| KAKSI | (−) | IVLMAFK | GN | IVG | |||
| SEGNO | (−) | IVLMAFYQERK | GTN | IVLG | PGN | ||
| PBs | (−) | IVLAFQERK | IVL | IVLC | IP | PGTD | PGS |
| C cap alphaa | C2 | C1 | Ccap | C1′ | C2′ | C3′ | |
| DSSP | (+) | LAERK | LAERK | LAERK | GN | PG | PK |
| STRIDE | (+) | LAERK | AQERK | LAN | GN | P | PDK |
| SECSTR | (+) | LMA | AERK | LAQERK | LAGN | PGN | K |
| XTLSSTR | (+) | LAEK | AERK | LAE | GN | PK | K |
| PSEA | (+) | ILAERK | AQERK | LAHNRK | GN | PG | PD |
| DEFINE | (+) | G | P | P | V | ||
| KAKSI | (+) | LAQERK | LARK | GN | PG | PGD | P |
| SEGNO | (+) | ILA | LAERK | LAQERK | GHN | PHN | PGD |
| PBs | (+) | LA | LMAC | AQERK | QERK | LTN | PGN |
| DSSP | (−) | VPGT | PGSTD | IVPGD | IVWPTE | IVLMAFYE | V |
| STRIDE | (−) | PGTN | IVPGT | IVPGD | IVLAPTE | VL | |
| SECSTR | (−) | VPGT | PGST | VPGD | IVPTD | IVLMFYWTE | |
| XTLSSTR | (−) | PG | PG | VPG | IVPT | V | |
| PSEA | (−) | PGSTD | IVFPGT | IVPGD | IVLAF | A | |
| DEFINE | (−) | ||||||
| KAKSI | (−) | VPGT | VPGD | IVP | IVL | ||
| SEGNO | (−) | PGSTND | VPGTD | IVFPGD | IVPT | IVF | IVLFYT |
| PBs | (−) | PGST | VPGTD | VGT | IVG | IVG | IVLMAFYWTE |
| N cap betab | N3′ | N2′ | N1′ | Ncap | N1 | N2 | |
| DSSP | (+) | PGND | PGND | PGND | IVFYT | IVLFY | IVFY |
| STRIDE | (+) | PGSND | PGND | PGND | IVFYT | IVLFY | IVFY |
| SECSTR | (+) | PGN | PGND | PGND | IVFYWT | IVLY | IVLFY |
| XTLSSTR | (+) | PG | PGNK | PGN | G | IVFYT | IVLFY |
| PSEA | (+) | GNK | PN | GND | VG | IVYPT | IVFY |
| DEFINE | (+) | G | G | G | IVP | V | |
| KAKSI | (+) | PGNDK | PGND | GN | VPT | IVFY | IVLFY |
| SEGNO | (+) | GNK | PGN | GND | PG | IVFYT | IVLFYW |
| PBs | (+) | GN | GDK | VP | IVFYP | IVFY | IVFYPT |
| DSSP | (−) | IVLA | IVLMFWT | IVLAFE | APND | AQPGSNDEK | AQPGNDERK |
| STRIDE | (−) | IVLAF | IVLMFWT | IVLAE | APGND | APGSNDEK | QPGNDERK |
| SECSTR | (−) | LAF | VLMAFYW | IVLAFE | APNDE | AQPGSNDEK | AQPGNDEK |
| XTLLSTR | (−) | IL | ILAY | E | A | APGNDE | AQPGNDEK |
| PSEA | (−) | IVL | IVLAFYC | LPD | AGNDE | AQPGSNDEK | |
| DEFINE | (−) | A | |||||
| KAKSI | (−) | IVLY | IVLMAFYW | LAF | E | APGNDE | AQPGSNDEK |
| SEGNO | (−) | IVL | LYW | IVLAFYW | LND | APGNDE | AQPGSNDEK |
| PBs | (−) | ILMAYE | LAP | LD | AGSNDE | AGSNDEK | AQGDERK |
| C cap betab | C2 | C1 | Ccap | C1′ | C2′ | C3′ | |
| DSSP | (+) | IVLFYW | IVFYWC | IVFYD | GSND | PGSND | GSND |
| STRIDE | (+) | IVFYW | IVFYWC | IVYD | GND | PGSND | GSND |
| SECSTR | (+) | IVLFYW | IVFYWCT | IVFY | GND | PGSND | GSND |
| XTLLSTR | (+) | IVF | IVFYWT | IVFYTD | PGND | PGSD | PGSND |
| PSEA | (+) | IVLFY | IVFYCT | PSTD | PND | GSND | GSD |
| DEFINE | (+) | P | PSD | PD | GD | G | |
| KAKSI | (+) | IVLFY | IVFYW | ND | PGND | PGSND | GSND |
| SEGNO | (+) | IVLFYW | IVFYWC | IVCTD | PGND | GSND | GSND |
| PBs | (+) | IVF | IVFY | IVFY | PSTND | P | GSND |
| DSSP | (−) | AQPGSNDERK | APGSNDEK | AGE | IFQER | IVLMAFY | IVLAF |
| STRIDE | (−) | AQPGSNDERK | APGNDEK | AGE | VFYQER | IVLMAFY | IVLAF |
| SECSTR | (−) | AQPSNDERK | APGNDE | AQGEK | AFYQEK | IVLMAFY | IVLAF |
| XTLSSTR | (−) | APNDE | AQPGNDEK | APGE | IVAQR | IVLF | IVLMAF |
| PSEA | (−) | AQPGNDEK | AQGNDEK | LAERK | IVLAFY | IVLAF | IVLAF |
| DEFINE | (−) | I | L | IV | |||
| KAKSI | (−) | AQPGSNDEK | APGNDE | AEK | IVLF | IVLMAFY | IVLAF |
| SEGNO | (−) | AQPGSNDEK | APGSNDE | APGEK | IVLMAFYQR | IVLMFY | IVLAF |
| PBs | (−) | GNDERK | AGSNDE | AQGNDE | LAQERK | G | IVLMAFYP |
The over (+)(respectively under (−))− representation have been selected using a Z-score more than 4.4(respectively less than −4.4). The first part of the table presents the N and C capping regions of α-helix. Results have been obtained with DB0.
The over (+)(respectively under (−))− representation have been selected using a Z-score more than 4.4(respectively less than −4.4). The second part of the table presents the N and C capping regions of β-sheet. Results have been obtained with DB0.
At the opposite, KLd values of C capping regions of α-helices are weaker; multiple positions are in the same range of values. Repeated patterns (LAERK/IVPG) are found before p1, then (GN/IV)p1, (PG/-)p2, and (PK/-)p3 where p1 corresponds to position C1′ for DSSP, STRIDE, SECSTR, XTLSSTR, PSEA, and SEGNO and Ccap for DEFINE and KAKSI. It is noteworthy that the different positions, even if they are related, cannot be interchanged. The pattern of over-represented amino acids ([LAERK], [LAERK], [LAERK], [GN], [PG], [PK]) can correspond for instance, to the sequence (L A L N P K). The succession LAL of C2, C1, Ccap cannot be shifted as they are mainly under-represented at positions C1′, C2′, and C3′.
N capping regions of β-strand (Table III) are more informative than C capping regions, they are characterized by a strong succession of patterns (PGND/IVL), followed by a pattern (IVFYT/APND)p1 followed by compatible patterns (IVFY/AQPGNDERK); this latter corresponding to the β-strand; position p1 correspond to Ncap for DSSP, STRIDE, SECSTR, and KAKSI, and to N1 for PSEA, DEFINE, and SEGNO.
C capping regions of β-strand are less informative, but are also clearly cut into two successive patterns, the first is the one characteristic of β-strand (IVLFYN/AQPGNDERK) followed by (GND/IVLAF)p1. The final position of p1 is harder to define than previously, but correspond most of the time to C1′ that is also the less informative position in terms of KLd. Analysis of the position informativity with KLd values, emphases the results seen on Table III. Positions C2, C1, and C2′ have a strong amino acid distribution associated with high KLd values, whereas the boundary region, that is, Ccap and C1′, have fewer amino acids over and under-represented and low KLd values.
Finally, every amino acid distributions of DSSP capping regions with the other SSAMs have been compared (see Supporting Information 6). N capping α-helix regions of DSSP is strictly equivalent to SECSTR, STRIDE, PSEA, and SEGNO. A light difference at N2′ position (associated to a low informative position) is found between DSSP and DEFINE and a clear frameshift from Ncap of DSSP to N1 for XTLSSTR and KAKSI.
For the C capping regions of α-helix, the situation is more complex, the only strict equivalent amino acid matrices is find between DSSP and SECSTR. A limited divergence is found at position C1 for PSEA and at C2′ for XTLSSTR. Surprisingly, STRIDE has only three strict corresponding positions with DSSP, but it remains highly comparable as C2 and C1 positions have very close amino acid distributions as C2′ and C3′. Concerning KAKSI, we observe a shift of (+1) for the positions ranging from C2 to Ccap. For SEGNO, only the central positions are equivalent to DSSP. C2 and C1 positions of SEGNO correspond to C1 and Ccap positions of DSSP, but all these amino acid distributions are very close. Only position C3′ of SEGNO is particular due to an over representation of Glycine not found in any other SSAM and thus more related to C2′ position of DSSP than C3′ position.
Contrary to the α-helix, the β-strand capping regions show few strong amino acid distribution divergences as the α-helix. Thus, we find that SECSTR, STRIDE, and DEFINE are equivalent to DSSP N capping region of β-strand. For the others, only the clear cut between [N3′ − N1′] and [Ncap − N2] positions of DSSP are found. For instance, [N3′ − N1′] of XTLSSTR correspond to N2′ position of DSSP.
For the C capping regions of β-strand, SECSTR, STRIDE and KAKSI are equivalent to DSSP. For XTLSSTR and SEGNO, only their C1′ positions is not equivalent to C1′ of DSSP. PSEA adds to this, a shift of positions C1 and Ccap; it is mainly due to lower informativity at these positions.
Discussion
Analysis of different SSAMs based on diverse structural protein databanks gave results that are in line with previous studies including our own.16,32,33,34,101 Indeed, each SSAM—based on different criteria—gives a different assignment. Thus no simple consensus of secondary structure assignments could be done. Repetition of over- and under-represented amino acids are found as expected within the regular secondary structures, that is, positions Ncap, N1, N2 and positions C2, C1, Ccap.99 Analysis of position of N and C cap of DSSP in regards to capping positions given by other SSAMs lead to a similar view. Even the SSAM closely related to DSSP could have systematically a very different N or C cap position.
Amino acid distributions surprisingly do not reflect this fact: A structural frameshift does not imply a “sequence” frameshift. α-helix capping regions possess a true amino acid patterns (see Table III), the classical over- and under- representations of amino acids are found again. For the N cap α-helix, we observe a clear frameshift of (+1) for KAKSI & XTLSSTR assignment method and for the C cap α-helix, we observe a clear frameshift of (−1) for KAKSI. Thus, the sequence informativity characterizing “the” α-helix capping regions is found for all the SSAMs with some slight sliding. Only DEFINE assignment does not correspond. However, its KLd values are 20–50 times less informative than other SSAMs. For the β-strands capping regions as classically noted, a simple differentiation exists between the central regions mainly composed of aliphatic hydrophobic residues and “outside” regions with polar and “breakers.” This very simple rule is found for all the SSAMs.
The capping regions are the most important differences between SSAMs, but they do not create different amino acid patterns, only minor shift, for example, DSSP and KAKSI helices. These results are in agreement with the results of Kruus and coworkers89 that elegantly analyze the question of capping regions of α-helices. They have shown that strong patterns are found in these regions, but on the structure, even if does not correspond perfectly, they shift often in a very close vicinity. We observe the same kind of results, but in our case, the average created by the use of one occurrence matrix each time gives a global view of the amino acid patterns.
We have also analyzed the repetitive structures assigned by our structural alphabet,38 namely the Protein Blocks.93,99,101-112 Their results are a bit different from the SSAMs, for example, Ncap and Ccap have always lower KLd values than other positions. Contrary to the SSAMs, they approximate even the nonrepetitive states, that is, loops, so they can be used to predict them from the knowledge of sequence.
Secondary structure assignment is too often considered as a finished research field with only one golden standard DSSP. As noted by Arthur M. Lesk,113 “What is unfortunate is that people use these secondary structure assignments unquestioningly; perhaps the greatest damage the programs do is to create an impression (for which [authors of SSAMs] cannot be blamed) that there is A RIGHT ANSWER. Provided that the danger is recognized, such programs can be useful.” SSAMs lead to different assignments, and, to different analysis of protein structures.
Robson and Garnier have written: “In looking at a model of a protein, it is often easy to recognize helix and to a lesser extent sheet strands, but it is not easy to say whether the residues at the ends of these features be included in them or not.114” Indeed, the discrepancies are often found at the extremities of repetitive structures and loop boundaries are essential in loop conformation prediction.65 Nonetheless, we have shown here that systematically differences do not appear in terms of sequence. This result reinforce the results of Kruus and coworkers.89 This study is also related to the elegant research done by Zhang and coworkers.34 They have proposed to assess secondary structure assignment using recognized pairwise sequence-alignment benchmarks. They have so highlighted the interest of two assignment methods and also underline the repetitive structure extremities. Here, we went further and quantified the discrepancies in terms of amino acid propensities in a very systematic way using various SSAMs. We showed that, though SSAMs give different local structure assignments, capping sequence patterns remain in fact surprisingly stable. In someway, it emphasized the idea of Grishin with PALSSE, that focus on the sequence property as on the structure properties to assign the repetitive structure.25
Moreover, the definition of assignment of secondary structure has a direct impact on the quality of the prediction. Cuff and Barton have used three different SSAMs (DSSP, STRIDE, and DEFINE) and combined their assignments to improve secondary structure prediction rate (using assignment done by DSSP as reference).115 Recently, Zhang and coworkers showed that the consensus of STRIDE, KAKSI, SECSTR, and P-SEA improves assignments over the best single method in each benchmark by an additional 1%.116 Our analysis underlines that the amino acid contents of capping regions is encompassed by numerous various SSAMs. Thus, the amino acid contents of capping regions could help to define more precisely the assignments by helping to find a consensus between divergent assignment methods. Thus, this new consensus SSAM encompassing different SSAMs and amino acid behaviors would help the prediction.
In the same way, Dovidchenko and coworkers showed that loop boundary prediction methods relying on sequence specificities seem to be more efficient that methods based on physical properties of amino acids.117 Actually, the PSIPRED prediction method (based on assignment performed by DSSP) achieved 73% correct prediction rates from the single sequence that is between 7 and 9% better than physics based methods. Thus, protein sequence conservation is critical for predicting loop boundaries. Our contribution is substantial in the sense that equivalent sequence patterns were found for most of the SSAMs. Thus prediction from these patterns could provide a unified decision of loops boundaries. Furthermore, this pattern stability, despite of assignment shifts, enlightens an interesting property of protein sequences that allow some fuzziness at loop boundaries. This phenomenon might physically support the conformational adaptations of proteins for function or for stability in variable cell environments.
Methods
Data sets
The 10 sets of proteins are based on the PISCES database90,91 and represents between 162,830 and 1,572,412 residues. They are available at http://www.dsimb.inserm.fr/~debrevern/DOWN/DB/new. The sets are defined as containing no more than x% pairwise sequence identity with x ranging from 20 to 90%. The selected chains have X-ray crystallographic resolutions less than 1.6 Å with an R-factor less than 0.25 or less than 2.5 Å with an R-factor less than 1.0. Each chain was carefully examined with geometric criteria to avoid bias from zones with missing density. Table II presents all the details of these databanks.
Secondary structure assignments
They have been done with five distinct software: DSSP6 (CMBI version 2000), STRIDE,11, SECSTR10 (version 0.2.3-1), XTLSSTR,18, PSEA17 (version 2.0), DEFINE14 (version 2.0), KAKSI16 (version 1.0.1), and SEGNO20 (version 3.1). PBs93 have been assigned using in-house software (available at http://www.dsimb.inserm.fr/~debrevern/DOWN/LECT/), it follows similar rules to assignment done by PBE web server (http://bioinformatics.univ-reunion.fr/PBE/).118 DSSP, STRIDE, SECSTR, XTLSSTR, and SEGNO give more than three states, so we have reduced them: the α-helix contains α, 310 and π-helices, the β-strand contains only the β-sheet and the coil everything else (β-bridges, turns, bends, polyproline II and coil). Default parameters are used for each software. The first residue of a repetitive structures is noted Ncap and the following Nn (n = 1–3 in this study), while the previous residues are noted N′n (n = 1 is so the closest residue to Ncap position). In the same way, the last residue of repetitive structure is noted Ccap and the following C′n, while the previous residues are noted Cn. The Nn and Cn residues are so inside the repetitive structures, N′n and C′n residues belongs to coil regions.
Agreement rate
To compare two distinct secondary structure assignment methods, we used an agreement rate which is the proportion of residues associated with the same state (α-helix, β-strand, and coil). It is noted C3.33
To compare capping regions of repetitive secondary structures, we have taken as standard the capping regions of repetitive secondary structures defined by DSSP. Then, we simply search the positions corresponding to N and C cap defined by DSSP with other assignments. In the same way, we have compared the amino acid distribution of capping regions of repetitive secondary structures defined by DSSP with the amino acid distribution of capping regions of repetitive secondary structures defined by other SSAMs.
Z-score
The amino acid occurrences for each secondary structure have been normalized into a Z-score:
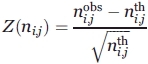 |
with ni,jobs the observed occurrence number of amino acid i in position j for a given secondary structure and ni,jth the expected number. The product of the occurrences in position j with the frequency of amino acid i in the entire databank equals ni,jth. Positive Z-scores (respectively negative) correspond to over-represented amino acids (respectively underrepresented); threshold values of 4.42 and 1.96 were chosen (probability less than 10−5 and 5 × 10⁻², respectively).
Asymmetric Kullback-Leibler measure
The Kullback-Leibler measure or relative entropy,100 denoted by KLd, evaluates the contrast between two amino acid distributions, that is, the amino acid distribution observed in a given position j and the reference amino acid distribution in the protein set (DB). The relative entropy KLd(j|Sx) in the site j for the secondary structure Sx is expressed as:
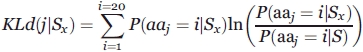 |
where P(aaj = i|Sx) is the probability of observing the amino acid i in position j (j = −w, …,0, …, +w) of the sequence window (15 residue long, w = 7) given a secondary structure Sx, and, P(aaj = i|DB) the probability of observing the same amino acid in the databank (named DB). Thus, it allows one to detect the “informative” positions in terms of amino acids for a given secondary structure.99
References
- 1.Pauling L, Corey RB. The pleated sheet, a new layer configuration of polypeptide chains. Proc Natl Acad Sci USA. 1951;37:251–256. doi: 10.1073/pnas.37.5.251. [DOI] [PMC free article] [PubMed] [Google Scholar]
- 2.Pauling L, Corey RB, Branson HR. The structure of proteins; two hydrogen-bonded helical configurations of the polypeptide chain. Proc Natl Acad Sci USA. 1951;37:205–211. doi: 10.1073/pnas.37.4.205. [DOI] [PMC free article] [PubMed] [Google Scholar]
- 3.Hutchinson EG, Thornton JM. The Greek key motif: extraction, classification and analysis. Protein Eng. 1993;6:233–245. doi: 10.1093/protein/6.3.233. [DOI] [PubMed] [Google Scholar]
- 4.Hutchinson EG, Thornton JM. HERA–a program to draw schematic diagrams of protein secondary structures. Proteins. 1990;8:203–212. doi: 10.1002/prot.340080303. [DOI] [PubMed] [Google Scholar]
- 5.Michalopoulos I, Torrance GM, Gilbert DR, Westhead DR. TOPS: an enhanced database of protein structural topology. Nucleic Acids Res. 2004;32:D251–D254. doi: 10.1093/nar/gkh060. [DOI] [PMC free article] [PubMed] [Google Scholar]
- 6.Kabsch W, Sander C. Dictionary of protein secondary structure: pattern recognition of hydrogen-bonded and geometrical features. Biopolymers. 1983;22:2577–2637. doi: 10.1002/bip.360221211. [DOI] [PubMed] [Google Scholar]
- 7.Bernstein FC, Koetzle TF, Williams GJ, Meyer EF, Jr, Brice MD, Rodgers JR, Kennard O, Shimanouchi T, Tasumi M. The protein data bank: a computer-based archival file for macromolecular structures. J Mol Biol. 1977;112:535–542. doi: 10.1016/s0022-2836(77)80200-3. [DOI] [PubMed] [Google Scholar]
- 8.Berman HM, Westbrook J, Feng Z, Gilliland G, Bhat TN, Weissig H, Shindyalov IN, Bourne PE. The protein data bank. Nucleic Acids Res. 2000;28:235–242. doi: 10.1093/nar/28.1.235. [DOI] [PMC free article] [PubMed] [Google Scholar]
- 9.Andersen CA, Palmer AG, Brunak S, Rost B. Continuum secondary structure captures protein flexibility. Structure (Camb) 2002;10:175–184. doi: 10.1016/s0969-2126(02)00700-1. [DOI] [PubMed] [Google Scholar]
- 10.Fodje MN, Al-Karadaghi S. Occurrence, conformational features and amino acid propensities for the pi-helix. Protein Eng. 2002;15:353–358. doi: 10.1093/protein/15.5.353. [DOI] [PubMed] [Google Scholar]
- 11.Frishman D, Argos P. Knowledge-based protein secondary structure assignment. Proteins. 1995;23:566–579. doi: 10.1002/prot.340230412. [DOI] [PubMed] [Google Scholar]
- 12.Smith D. Cambridge, UK: Department of Crystallography, Birkbeck College, University of London; 1989. SSTRUC: A program to calculate a secondary structural summary. [Google Scholar]
- 13.Hutchinson EG, Thornton JM. PROMOTIF–a program to identify and analyze structural motifs in proteins. Protein Sci. 1996;5:212–220. doi: 10.1002/pro.5560050204. [DOI] [PMC free article] [PubMed] [Google Scholar]
- 14.Richards FM, Kundrot CE. Identification of structural motifs from protein coordinate data: secondary structure and first-level supersecondary structure. Proteins. 1988;3:71–84. doi: 10.1002/prot.340030202. [DOI] [PubMed] [Google Scholar]
- 15.Levitt M, Greer J. Automatic identification of secondary structure in globular proteins. J Mol Biol. 1977;114:181–239. doi: 10.1016/0022-2836(77)90207-8. [DOI] [PubMed] [Google Scholar]
- 16.Martin J, Letellier G, Marin A, Taly JF, de Brevern AG, Gibrat JF. Protein secondary structure assignment revisited: a detailed analysis of different assignment methods. BMC Struct Biol. 2005;5:17. doi: 10.1186/1472-6807-5-17. [DOI] [PMC free article] [PubMed] [Google Scholar]
- 17.Labesse G, Colloc'h N, Pothier J, Mornon JP. P-SEA: a new efficient assignment of secondary structure from C alpha trace of proteins. Comput Appl Biosci. 1997;13:291–295. doi: 10.1093/bioinformatics/13.3.291. [DOI] [PubMed] [Google Scholar]
- 18.King SM, Johnson WC. Assigning secondary structure from protein coordinate data. Proteins. 1999;35:313–320. [PubMed] [Google Scholar]
- 19.Srinivasan R, Rose GD. A physical basis for protein secondary structure. Proc Natl Acad Sci USA. 1999;96:14258–14263. doi: 10.1073/pnas.96.25.14258. [DOI] [PMC free article] [PubMed] [Google Scholar]
- 20.Cubellis MV, Cailliez F, Lovell SC. Secondary structure assignment that accurately reflects physical and evolutionary characteristics. BMC Bioinformatics. 2005;6(Suppl 4):S8. doi: 10.1186/1471-2105-6-S4-S8. [DOI] [PMC free article] [PubMed] [Google Scholar]
- 21.Dupuis F, Sadoc JF, Jullien R, Angelov B, Mornon JP. Voro3D: 3D Voronoi tessellations applied to protein structures. Bioinformatics. 2005;21:1715–1716. doi: 10.1093/bioinformatics/bth365. [DOI] [PubMed] [Google Scholar]
- 22.Dupuis F, Sadoc JF, Mornon JP. Protein secondary structure assignment through Voronoi tessellation. Proteins. 2004;55:519–528. doi: 10.1002/prot.10566. [DOI] [PubMed] [Google Scholar]
- 23.Taylor T, Rivera M, Wilson G, Vaisman II. New method for protein secondary structure assignment based on a simple topological descriptor. Proteins. 2005;60:513–524. doi: 10.1002/prot.20471. [DOI] [PubMed] [Google Scholar]
- 24.Sklenar H, Etchebest C, Lavery R. Describing protein structure: a general algorithm yielding complete helicoidal parameters and a unique overall axis. Proteins. 1989;6:46–60. doi: 10.1002/prot.340060105. [DOI] [PubMed] [Google Scholar]
- 25.Majumdar I, Krishna SS, Grishin NV. PALSSE: A program to delineate linear secondary structural elements from protein structures. BMC Bioinformatics. 2005;6:202. doi: 10.1186/1471-2105-6-202. [DOI] [PMC free article] [PubMed] [Google Scholar]
- 26.Hosseini S, Sadeghi M, Pezeshk H, Eslahchi C, Habibi M. PROSIGN: a method for protein secondary structure assignment based on three-dimensional coordinates of consecutive C(alpha) atoms. Comput Biol Chem. 2005;32:406–411. doi: 10.1016/j.compbiolchem.2008.07.027. [DOI] [PubMed] [Google Scholar]
- 27.Parisien M, Major F. A new catalog of protein beta-sheets. Proteins. 2005;61:545–558. doi: 10.1002/prot.20677. [DOI] [PubMed] [Google Scholar]
- 28.Kumar S, Bansal M. Structural and sequence characteristics of long alpha helices in globular proteins. Biophys J. 1996;71:1574–1586. doi: 10.1016/S0006-3495(96)79360-8. [DOI] [PMC free article] [PubMed] [Google Scholar]
- 29.Kumar S, Bansal M. Geometrical and sequence characteristics of alpha-helices in globular proteins. Biophys J. 1998;75:1935–1944. doi: 10.1016/S0006-3495(98)77634-9. [DOI] [PMC free article] [PubMed] [Google Scholar]
- 30.Bansal M, Kumar S, Velavan R. HELANAL: a program to characterize helix geometry in proteins. J Biomol Struct Dyn. 2000;17:811–819. doi: 10.1080/07391102.2000.10506570. [DOI] [PubMed] [Google Scholar]
- 31.Woodcock S, Mornon JP, Henrissat B. Detection of secondary structure elements in proteins by hydrophobic cluster analysis. Protein Eng. 1992;5:629–635. doi: 10.1093/protein/5.7.629. [DOI] [PubMed] [Google Scholar]
- 32.Colloc'h N, Etchebest C, Thoreau E, Henrissat B, Mornon JP. Comparison of three algorithms for the assignment of secondary structure in proteins: the advantages of a consensus assignment. Protein Eng. 1993;6:377–382. doi: 10.1093/protein/6.4.377. [DOI] [PubMed] [Google Scholar]
- 33.Fourrier L, Benros C, de Brevern AG. Use of a structural alphabet for analysis of short loops connecting repetitive structures. BMC Bioinformatics. 2004;5:58. doi: 10.1186/1471-2105-5-58. [DOI] [PMC free article] [PubMed] [Google Scholar]
- 34.Zhang W, Dunker AK, Zhou Y. Assessing secondary structure assignment of protein structures by using pairwise sequence-alignment benchmarks. Proteins. 2007;71:61–67. doi: 10.1002/prot.21654. [DOI] [PubMed] [Google Scholar]
- 35.Richardson JS. The anatomy and taxonomy of protein structure. Adv Protein Chem. 1981;34:167–339. doi: 10.1016/s0065-3233(08)60520-3. [DOI] [PubMed] [Google Scholar]
- 36.Fitzkee NC, Fleming PJ, Gong H, Panasik N, Jr, Street TO, Rose GD. Are proteins made from a limited parts list? Trends Biochem Sci. 2005a;30:73–80. doi: 10.1016/j.tibs.2004.12.005. [DOI] [PubMed] [Google Scholar]
- 37.Fitzkee NC, Fleming PJ, Rose GD. The protein coil library: a structural database of nonhelix, nonstrand fragments derived from the PDB. Proteins. 2005b;58:852–854. doi: 10.1002/prot.20394. [DOI] [PubMed] [Google Scholar]
- 38.Offmann B, Tyagi M, deBrevern AG. Local Protein Structures. Curr Bioinformatics. 2007;3:165–202. [Google Scholar]
- 39.Rose GD, Seltzer JP. A new algorithm for finding the peptide chain turns in a globular protein. J Mol Biol. 1977;113:153–164. doi: 10.1016/0022-2836(77)90046-8. [DOI] [PubMed] [Google Scholar]
- 40.Rose GD, Gierasch LM, Smith JA. Turns in peptides and proteins. Adv Protein Chem. 1985;37:1–109. doi: 10.1016/s0065-3233(08)60063-7. [DOI] [PubMed] [Google Scholar]
- 41.Hutchinson EG, Thornton JM. A revised set of potentials for beta-turn formation in proteins. Protein Sci. 1994;3:2207–2216. doi: 10.1002/pro.5560031206. [DOI] [PMC free article] [PubMed] [Google Scholar]
- 42.Fuchs PF, Alix AJ. High accuracy prediction of beta-turns and their types using propensities and multiple alignments. Proteins. 2005;59:828–839. doi: 10.1002/prot.20461. [DOI] [PubMed] [Google Scholar]
- 43.Bornot A, deBrevern AG. Protein beta-turn assignments. Bioinformation. 2006;1:153–155. doi: 10.6026/97320630001153. [DOI] [PMC free article] [PubMed] [Google Scholar]
- 44.Street TO, Fitzkee NC, Perskie LL, Rose GD. Physical-chemical determinants of turn conformations in globular proteins. Protein Sci. 2007;16:1720–1727. doi: 10.1110/ps.072898507. [DOI] [PMC free article] [PubMed] [Google Scholar]
- 45.Edwards MS, Sternberg JE, Thornton JM. Structural and sequence patterns in the loops of beta alpha beta units. Protein Eng. 1987;1:173–181. doi: 10.1093/protein/1.3.173. [DOI] [PubMed] [Google Scholar]
- 46.Thornton JM, Sibanda BL, Edwards MS, Barlow DJ. Analysis, design and modification of loop regions in proteins. Bioessays. 1988;8:63–69. doi: 10.1002/bies.950080205. [DOI] [PubMed] [Google Scholar]
- 47.Ring CS, Kneller DG, Langridge R, Cohen FE. Taxonomy and conformational analysis of loops in proteins. J Mol Biol. 1992;224:685–699. doi: 10.1016/0022-2836(92)90553-v. [DOI] [PubMed] [Google Scholar]
- 48.Wintjens RT, Rooman MJ, Wodak SJ. Automatic classification and analysis of alpha alpha-turn motifs in proteins. J Mol Biol. 1996;255:235–253. doi: 10.1006/jmbi.1996.0020. [DOI] [PubMed] [Google Scholar]
- 49.Boutonnet NS, Kajava AV, Rooman MJ. Structural classification of alphabetabeta and betabetaalpha supersecondary structure units in proteins. Proteins. 1998;30:193–212. [PubMed] [Google Scholar]
- 50.Wintjens R, Wodak SJ, Rooman M. Typical interaction patterns in alphabeta and betaalpha turn motifs. Protein Eng. 1998;11:505–522. doi: 10.1093/protein/11.7.505. [DOI] [PubMed] [Google Scholar]
- 51.Efimov AV. Structural trees for proteins containing phi-motifs. Biochemistry (Mosc) 2008;273:23–28. doi: 10.1134/s0006297908010033. [DOI] [PubMed] [Google Scholar]
- 52.Espadaler J, Querol E, Aviles FX, Oliva B. Identification of function-associated loop motifs and application to protein function prediction. Bioinformatics. 2006;22:2237–2243. doi: 10.1093/bioinformatics/btl382. [DOI] [PubMed] [Google Scholar]
- 53.Rekha N, Srinivasan N. Structural basis of regulation and substrate specificity of protein kinase CK2 deduced from the modeling of protein-protein interactions. BMC Struct Biol. 2003;3:4. doi: 10.1186/1472-6807-3-4. [DOI] [PMC free article] [PubMed] [Google Scholar]
- 54.Fernandez-Fuentes N, Hermoso A, Espadaler J, Querol E, Aviles FX, Oliva B. Classification of common functional loops of kinase super-families. Proteins. 2004;56:539–555. doi: 10.1002/prot.20136. [DOI] [PubMed] [Google Scholar]
- 55.Srinivasan N, Bax B, Blundell TL, Parker PJ. Structural aspects of the functional modules in human protein kinase-C alpha deduced from comparative analyses. Proteins. 1996;26:217–235. doi: 10.1002/(SICI)1097-0134(199610)26:2<217::AID-PROT11>3.0.CO;2-S. [DOI] [PubMed] [Google Scholar]
- 56.Panchenko AR, Madej T. Analysis of protein homology by assessing the (dis)similarity in protein loop regions. Proteins. 2004;57:539–547. doi: 10.1002/prot.20237. [DOI] [PMC free article] [PubMed] [Google Scholar]
- 57.Panchenko AR, Madej T. Structural similarity of loops in protein families: toward the understanding of protein evolution. BMC Evol Biol. 2005;5:10. doi: 10.1186/1471-2148-5-10. [DOI] [PMC free article] [PubMed] [Google Scholar]
- 58.Panchenko AR, Wolf YI, Panchenko LA, Madej T. Evolutionary plasticity of protein families: coupling between sequence and structure variation. Proteins. 2005;61:535–544. doi: 10.1002/prot.20644. [DOI] [PMC free article] [PubMed] [Google Scholar]
- 59.Madej T, Panchenko AR, Chen J, Bryant SH. Protein homologous cores and loops: important clues to evolutionary relationships between structurally similar proteins. BMC Struct Biol. 2007;7:23. doi: 10.1186/1472-6807-7-23. [DOI] [PMC free article] [PubMed] [Google Scholar]
- 60.Wolf Y, Madej T, Babenko V, Shoemaker B, Panchenko AR. Long-term trends in evolution of indels in protein sequences. BMC Evol Biol. 2007;7:19. doi: 10.1186/1471-2148-7-19. [DOI] [PMC free article] [PubMed] [Google Scholar]
- 61.Jiang H, Blouin C. Insertions and the emergence of novel protein structure: a structure-based phylogenetic study of insertions. BMC Bioinformatics. 2007;8:444. doi: 10.1186/1471-2105-8-444. [DOI] [PMC free article] [PubMed] [Google Scholar]
- 62.Huang Z, Wong CF, Wheeler RA. Flexible protein-flexible ligand docking with disrupted velocity simulated annealing. Proteins. 2008;71:440–454. doi: 10.1002/prot.21781. [DOI] [PubMed] [Google Scholar]
- 63.Nabuurs SB, Wagener M, deVlieg J. A flexible approach to induced fit docking. J Med Chem. 2007;50:6507–6518. doi: 10.1021/jm070593p. [DOI] [PubMed] [Google Scholar]
- 64.Wong S, Jacobson MP. Conformational selection in silico: loop latching motions and ligand binding in enzymes. Proteins. 2008;71:153–164. doi: 10.1002/prot.21666. [DOI] [PubMed] [Google Scholar]
- 65.Lessel U, Schomburg D. Importance of anchor group positioning in protein loop prediction. Proteins. 1999;37:56–64. [PubMed] [Google Scholar]
- 66.Miyazaki S, Kuroda Y, Yokoyama S. Characterization and prediction of linker sequences of multi-domain proteins by a neural network. J Struct Funct Genomics. 2002;2:37–51. doi: 10.1023/a:1014418700858. [DOI] [PubMed] [Google Scholar]
- 67.Wohlfahrt G, Hangoc V, Schomburg D. Positioning of anchor groups in protein loop prediction: the importance of solvent accessibility and secondary structure elements. Proteins. 2002;47:370–378. doi: 10.1002/prot.10098. [DOI] [PubMed] [Google Scholar]
- 68.Rohl CA, Strauss CE, Chivian D, Baker D. Modeling structurally variable regions in homologous proteins with rosetta. Proteins. 2004;55:656–677. doi: 10.1002/prot.10629. [DOI] [PubMed] [Google Scholar]
- 69.Boomsma W, Hamelryck T. Full cyclic coordinate descent: solving the protein loop closure problem in Calpha space. BMC Bioinformatics. 2005;6:159. doi: 10.1186/1471-2105-6-159. [DOI] [PMC free article] [PubMed] [Google Scholar]
- 70.Monnigmann M, Floudas CA. Protein loop structure prediction with flexible stem geometries. Proteins. 2005;61:748–762. doi: 10.1002/prot.20669. [DOI] [PubMed] [Google Scholar]
- 71.Fernandez-Fuentes N, Fiser A. Saturating representation of loop conformational fragments in structure databanks. BMC Struct Biol. 2006;6:15. doi: 10.1186/1472-6807-6-15. [DOI] [PMC free article] [PubMed] [Google Scholar]
- 72.Fernandez-Fuentes N, Oliva B, Fiser A. A supersecondary structure library and search algorithm for modeling loops in protein structures. Nucleic Acids Res. 2006a;34:2085–2097. doi: 10.1093/nar/gkl156. [DOI] [PMC free article] [PubMed] [Google Scholar]
- 73.Fernandez-Fuentes N, Zhai J, Fiser A. ArchPRED: a template based loop structure prediction server. Nucleic Acids Res. 2006b;34:W173–W176. doi: 10.1093/nar/gkl113. [DOI] [PMC free article] [PubMed] [Google Scholar]
- 74.Zhu K, Pincus DL, Zhao S, Friesner RA. Long loop prediction using the protein local optimization program. Proteins. 2006;65:438–452. doi: 10.1002/prot.21040. [DOI] [PubMed] [Google Scholar]
- 75.Kanagasabai V, Arunachalam J, Prasad PA, Gautham N. Exploring the conformational space of protein loops using a mean field technique with MOLS sampling. Proteins. 2007;67:908–921. doi: 10.1002/prot.21333. [DOI] [PubMed] [Google Scholar]
- 76.Olson MA, Feig M, Brooks CL., III Prediction of protein loop conformations using multiscale modeling methods with physical energy scoring functions. J Comput Chem. 2008;29:820–831. doi: 10.1002/jcc.20827. [DOI] [PubMed] [Google Scholar]
- 77.Prasad PA, Kanagasabai V, Arunachalam J, Gautham N. Exploring conformational space using a mean field technique with MOLS sampling. J Biosci. 2007;32:909–920. doi: 10.1007/s12038-007-0091-3. [DOI] [PubMed] [Google Scholar]
- 78.Soto CS, Fasnacht M, Zhu J, Forrest L, Honig B. Loop modeling: sampling, filtering, and scoring. Proteins. 2008;70:834–843. doi: 10.1002/prot.21612. [DOI] [PMC free article] [PubMed] [Google Scholar]
- 79.Reetz MT, Carballeira JD, Vogel A. Iterative saturation mutagenesis on the basis of B factors as a strategy for increasing protein thermostability. Angew Chem Int Ed Engl. 2006;45:7745–7751. doi: 10.1002/anie.200602795. [DOI] [PubMed] [Google Scholar]
- 80.Hu X, Wang H, Ke H, Kuhlman B. High-resolution design of a protein loop. Proc Natl Acad Sci USA. 2007;104:17668–17673. doi: 10.1073/pnas.0707977104. [DOI] [PMC free article] [PubMed] [Google Scholar]
- 81.Rapp CS, Strauss T, Nederveen A, Fuentes G. Prediction of protein loop geometries in solution. Proteins. 2007;69:69–74. doi: 10.1002/prot.21503. [DOI] [PubMed] [Google Scholar]
- 82.Efimov AV. Structure of coiled beta-beta-hairpins and beta-beta-corners. FEBS Lett. 1991b;284:288–292. doi: 10.1016/0014-5793(91)80706-9. [DOI] [PubMed] [Google Scholar]
- 83.Efimov AV. Structure of alpha-alpha-hairpins with short connections. Protein Eng. 1991a;4:245–250. doi: 10.1093/protein/4.3.245. [DOI] [PubMed] [Google Scholar]
- 84.Rufino SD, Donate LE, Canard LH, Blundell TL. Predicting the conformational class of short and medium size loops connecting regular secondary structures: application to comparative modelling. J Mol Biol. 1997;267:352–367. doi: 10.1006/jmbi.1996.0851. [DOI] [PubMed] [Google Scholar]
- 85.Wojcik J, Mornon JP, Chomilier J. New efficient statistical sequence-dependent structure prediction of short to medium-sized protein loops based on an exhaustive loop classification. J Mol Biol. 1999;289:1469–1490. doi: 10.1006/jmbi.1999.2826. [DOI] [PubMed] [Google Scholar]
- 86.Michalsky E, Goede A, Preissner R. Loops In Proteins (LIP)–a comprehensive loop database for homology modelling. Protein Eng. 2003;16:979–985. doi: 10.1093/protein/gzg119. [DOI] [PubMed] [Google Scholar]
- 87.Presta LG, Rose GD. Helix signals in proteins. Science. 1988;240:1632–1641. doi: 10.1126/science.2837824. [DOI] [PubMed] [Google Scholar]
- 88.Aurora R, Rose GD. Helix capping. Protein Sci. 1998;7:21–38. doi: 10.1002/pro.5560070103. [DOI] [PMC free article] [PubMed] [Google Scholar]
- 89.Kruus E, Thumfort P, Tang C, Wingreen NS. Gibbs sampling and helix-cap motifs. Nucleic Acids Res. 2005;33:5343–5353. doi: 10.1093/nar/gki842. [DOI] [PMC free article] [PubMed] [Google Scholar]
- 90.Wang G, Dunbrack RL., Jr PISCES: a protein sequence culling server. Bioinformatics. 2003;19:1589–1591. doi: 10.1093/bioinformatics/btg224. [DOI] [PubMed] [Google Scholar]
- 91.Wang G, Dunbrack RL., Jr PISCES: recent improvements to a PDB sequence culling server. Nucleic Acids Res. 2005;33:W94–W98. doi: 10.1093/nar/gki402. [DOI] [PMC free article] [PubMed] [Google Scholar]
- 92.Sheikhnejad G, Brank A, Christman JK, Goddard A, Alvarez E, Ford H, Jr, Marquez VE, Marasco CJ, Sufrin JR, O'Gara M. Mechanism of inhibition of DNA (cytosine C5)-methyltransferases by oligodeoxyribonucleotides containing 5,6-dihydro-5-azacytosine. J Mol Biol. 1999;285:2021–2034. doi: 10.1006/jmbi.1998.2426. [DOI] [PubMed] [Google Scholar]
- 93.deBrevern AG. New assessment of a structural alphabet. In Silico Biol. 2005;5:283–289. [PMC free article] [PubMed] [Google Scholar]
- 94.Doig AJ, Baldwin RL. N- and C-capping preferences for all 20 amino acids in alpha-helical peptides. Protein Sci. 1995;4:1325–1336. doi: 10.1002/pro.5560040708. [DOI] [PMC free article] [PubMed] [Google Scholar]
- 95.Mandel-Gutfreund Y, Zaremba SM, Gregoret LM. Contributions of residue pairing to beta-sheet formation: conservation and covariation of amino acid residue pairs on antiparallel beta-strands. J Mol Biol. 2001;305:1145–1159. doi: 10.1006/jmbi.2000.4364. [DOI] [PubMed] [Google Scholar]
- 96.Mandel-Gutfreund Y, Gregoret LM. On the significance of alternating patterns of polar and non-polar residues in beta-strands. J Mol Biol. 2002;323:453–461. doi: 10.1016/s0022-2836(02)00973-7. [DOI] [PubMed] [Google Scholar]
- 97.Bang D, Gribenko AV, Tereshko V, Kossiakoff AA, Kent SB, Makhatadze GI. Dissecting the energetics of protein alpha-helix C-cap termination through chemical protein synthesis. Nat Chem Biol. 2006;2:139–143. doi: 10.1038/nchembio766. [DOI] [PubMed] [Google Scholar]
- 98.Rose GD. Lifting the lid on helix-capping. Nat Chem Biol. 2006;2:123–124. doi: 10.1038/nchembio0306-123. [DOI] [PubMed] [Google Scholar]
- 99.deBrevern AG, Etchebest C, Hazout S. Bayesian probabilistic approach for predicting backbone structures in terms of protein blocks. Proteins. 2000;41:271–287. doi: 10.1002/1097-0134(20001115)41:3<271::aid-prot10>3.0.co;2-z. [DOI] [PubMed] [Google Scholar]
- 100.Kullback S, Leibler RA. On information and sufficiency. Ann Math Stat. 1951;22:79–86. [Google Scholar]
- 101.deBrevern AG, Benros C, Hazout S. Structural alphabet: from a local point of view to a global description of protein 3d structures. In: Yan PV, editor. Bioinformatics: New Research. New York: Nova Publishers; 2005a. pp. 127–169. [Google Scholar]
- 102.deBrevern AG, Camproux AC, Hazout S, Etchebest C, Tuffery P. Protein structural alphabets: beyond the secondary structure description. In: Sangadai S, editor. Recent research developments in protein engineering. Trivandrum: Research Signpost; 2001. pp. 319–331. [Google Scholar]
- 103.deBrevern AG, Valadie H, Hazout S, Etchebest C. Extension of a local backbone description using a structural alphabet: a new approach to the sequence-structure relationship. Protein Sci. 2002;11:2871–2886. doi: 10.1110/ps.0220502. [DOI] [PMC free article] [PubMed] [Google Scholar]
- 104.deBrevern AG, Hazout S. 'Hybrid protein model' for optimally defining 3D protein structure fragments. Bioinformatics. 2003;19:345–353. doi: 10.1093/bioinformatics/btf859. [DOI] [PubMed] [Google Scholar]
- 105.deBrevern AG, Benros C, Gautier R, Valadie H, Hazout S, Etchebest C. Local backbone structure prediction of proteins. In Silico Biol. 2004;4:381–386. [PMC free article] [PubMed] [Google Scholar]
- 106.deBrevern AG, Wong H, Tournamille C, Colin Y, Le Van Kim C, Etchebest C. A structural model of a seven-transmembrane helix receptor: the Duffy antigen/receptor for chemokine (DARC) Biochim Biophys Acta. 2005b;1724:288–306. doi: 10.1016/j.bbagen.2005.05.016. [DOI] [PubMed] [Google Scholar]
- 107.Benros C, deBrevern AG, Etchebest C, Hazout S. Assessing a novel approach for predicting local 3D protein structures from sequence. Proteins. 2006;62:865–880. doi: 10.1002/prot.20815. [DOI] [PubMed] [Google Scholar]
- 108.deBrevern AG, Etchebest C, Benros C, Hazout S. “Pinning strategy”: a novel approach for predicting the backbone structure in terms of protein blocks from sequence. J Biosci. 2007;32:51–70. doi: 10.1007/s12038-007-0006-3. [DOI] [PubMed] [Google Scholar]
- 109.Etchebest C, Benros C, Bornot A, Camproux AC, deBrevern AG. A reduced amino acid alphabet for understanding and designing protein adaptation to mutation. Eur Biophys J. 2007;36:1059–1069. doi: 10.1007/s00249-007-0188-5. [DOI] [PubMed] [Google Scholar]
- 110.Benros C, deBrevern AG, Hazout S. Analyzing the sequence-structure relationship of a library of local structural prototypes. J Theor Biol. 2009;256:215–226. doi: 10.1016/j.jtbi.2008.08.032. [DOI] [PubMed] [Google Scholar]
- 111.Bornot A, Etchebest C, deBrevern AG. A new prediction strategy for long local protein structures using an original description. Proteins. 2009;76:570–587. doi: 10.1002/prot.22370. [DOI] [PMC free article] [PubMed] [Google Scholar]
- 112.Faure G, Bornot A, deBrevern AG. Analysis of protein contacts into protein units. Biochimie. 2009;91:876–887. doi: 10.1016/j.biochi.2009.04.008. [DOI] [PubMed] [Google Scholar]
- 113.Lesk AM. Introduction to Bioinformatics. Oxford: Oxford University Press; 2005. [Google Scholar]
- 114.Robson B, Garnier J. Introduction to proteins and protein engineering. Amsterdam: Elsevier Press; 1986. [Google Scholar]
- 115.Cuff JA, Barton GJ. Evaluation and improvement of multiple sequence methods for protein secondary structure prediction. Proteins. 1999;34:508–519. doi: 10.1002/(sici)1097-0134(19990301)34:4<508::aid-prot10>3.0.co;2-4. [DOI] [PubMed] [Google Scholar]
- 116.Zhang W, Dunker AK, Zhou Y. Assessing secondary structure assignment of protein structures by using pairwise sequence-alignment benchmarks. Proteins. 2008;71:61–67. doi: 10.1002/prot.21654. [DOI] [PubMed] [Google Scholar]
- 117.Dovidchenko NV, Bogatyreva NS, Galzitskaya OV. Prediction of loop regions in protein sequence. J Bioinform Comput Biol. 2008;6:1035–1047. doi: 10.1142/s0219720008003758. [DOI] [PubMed] [Google Scholar]
- 118.Tyagi M, Sharma P, Swamy CS, Cadet F, Srinivasan N, deBrevern AG, Offmann B. Protein Block Expert (PBE): a web-based protein structure analysis server using a structural alphabet. Nucleic Acids Res. 2006;34:W119–W123. doi: 10.1093/nar/gkl199. [DOI] [PMC free article] [PubMed] [Google Scholar]