


Abstract
In a wide range of genomes, it was observed that the usage of synonymous codons is biased toward specific codons and codon patterns. Factors that are implicated in the selection for codon usage include facilitation of fast and accurate translation. There are two types of translational errors: missense errors and processivity errors. There is considerable evidence in support of the hypothesis that codon usage is optimized to minimize missense errors. In contrast, little is known about the relationship between codon usage and frameshifting errors, an important form of processivity errors, which appear to occur at frequencies comparable to the frequencies of missense errors. Based on the recently proposed pause-and-slip model of frameshifting, we developed Frameshifting Robustness Score (FRS). We used this measure to test if the pattern of codon usage indicates optimization against frameshifting errors. We found that the FRS values of protein-coding sequences from four analyzed genomes (the bacteria Bacillus subtilis and Escherichia coli, and the yeasts Saccharomyces cerevisiae and Schizosaccharomyce pombe) were typically higher than expected by chance. Other properties of FRS patterns observed in B. subtilis, S. cerevisiae and S. pombe, such as the tendency of FRS to increase from the 5′- to 3′-end of protein-coding sequences, were also consistent with the hypothesis of optimization against frameshifting errors in translation. For E. coli, the results of different tests were less consistent, suggestive of a much weaker optimization, if any. Collectively, the results fit the concept of selection against mistranslation-induced protein misfolding being one of the factors shaping the evolution of both coding and non-coding sequences.
INTRODUCTION
It is well established that synonymous codons are used in protein-coding sequences with unequal frequencies, and in each of major model organisms, including Escherichia coli, Saccharomyces cerevisiae, Caenorhabditis elegans and Drosophila melanogaster, a subset of preferred codons was identified (1). Such codon usage bias is typically calculated using Codon Adaptation Index (CAI), which measures how frequently codons preferred by highly expressed genes are used in the given gene (2). Many factors have been reported to affect the codon usage bias, including G + C content (3), compositional strand bias (4), protein secondary structure (5), mRNA secondary structure (6), mRNA half-life (7) and transcription-induced asymmetries (8). However, two of the more important factors linked to the biased codon usage appear to be translational speed and accuracy.
There are several lines of evidence that link codon bias to translation speed. For example, it has been demonstrated that in bacterial genomes, codon bias affects translation elongation rate (9,10), i.e. gene sequences with a higher codon usage bias tend to be translated faster, probably due to the abundant supply of the cognate tRNAs for the frequent codons. These observations are consistent with the translational efficiency hypothesis.
Closely related to translational speed is translational accuracy. Factors that are responsible for slowing the translation process, such as insufficient amounts of cognate tRNAs, have been also linked to missense errors, where one amino acid substitutes for another (11). Indeed, it has been observed that codon usage bias is more pronounced in regions of greater amino-acid conservation (12–15). Again, the relationship between codon bias and minimization of the translation error rate is complex as demonstrated by the finding that, when factors like tRNA abundance, translation efficiency, anti-codon modification, etc., are disregarded and the fitness for translation accuracy is measured by summing over the probabilities of mutations of individual codons in mRNA weighed by the similarity between the original and the mutated amino acids, then, by this simple measure, the preferred codons have not been selected optimally (16). There is also increasing evidence that the prevention of mistranslation-induced misfolding is an important force shaping codon usage (17).
Unlike missense errors, processivity errors caused by premature termination or shifted reading frames in elongation (frameshifting) cannot be tolerated even in less conserved (and thus presumably functionally less important) regions. These errors are more devastating, leading to waste of energy to generate and then degrade non-functional peptide chains. Moreover, a substantial fraction of frameshifting errors would generate misfolded proteins that could exert toxic effects on the cell (17). The frequency of frameshifting errors was estimated to be ∼10−5 per codon (18), that is, similar to the frequency of missense errors, for which an upper bound estimate of 4 × 10⁻⁴ per codon has been reported (19).
Several studies have tried to link codon usage gradient to optimization against processivity errors. Recently, Eyre-Walker (20) argued that, if there is selection against processivity errors, codon bias would be expected to increase along the gene sequence from 5′ to 3′. Qin et al. (21) measured codon bias using effective number of codons, along the direction of translation in four prokaryotic and two eukaryotic genomes, and showed that codon bias indeed increases along the direction of translation in yeast and some prokaryotes. A similar trend was reported by Stoletzki and Eyre-Walker (13) in an analysis of codon bias in E. coli genes. However, the trend of increasing codon bias along the gene sequence was rather weak in each of these cases. For example, in the gene set selected in their study, the fraction of optimal codons only increased by 0.051 every 1000 bp (13). Stoletzki and Eyre-Walker attributed the gradient to the higher cost of a processivity error when it occurs towards the end of the translation process rather than at the beginning. A gradient of nucleotide and codon usage in E. coli genome was also observed by Hooper and Berg (22).
The second line of supporting evidence for the reduction of processivity errors via codon usage was also proposed by Stoletzki and Eyre-Walker (13) who observed higher codon bias in longer genes. They reasoned that this trend was unlikely to be an artifact of correlations with expression because gene length is negatively correlated with expression and concluded that the most natural explanation for the observed bias is selection against processivity errors. However, the exact relationship between codon usage bias and gene length has been controversial with some studies suggesting a negative correlation (12,23). Eyre-Walker (20) found that codon usage is positively correlated with gene length in E. coli. Moriyama and Powell (24) reported a positive correlation between codon usage bias and gene length in E. coli but negative correlations in S. cerevisiae and D. melanogaster genes. The finding for S. cerevisae has in turn been contradicted by Coghlan and Wolfe (25), who found a positive correlation between codon usage and gene length in this organism. These conflicting results serve as an illustration of how difficult it is to discover and confidently measure subtle dependencies between codon usage bias and other biological factors. Furthermore, although the increase of codon bias with the protein length might be suggestive of possible optimization against processivity errors, such increased codon bias, in and by itself, does not provide sufficient evidence for optimization against frameshifting error. For example, it has been observed that longer proteins are more highly conserved during evolution (26), leaving possibilities of alternative explanations.
In this work, we develop a more direct argument in support of the hypothesis that codon usage is optimized to prevent processivity errors, specifically, frameshifting errors. The mechanism of frameshifting errors is not completely understood but work on programmed frameshifting (27,28) suggests that programmed frameshifting and frameshifting errors might be mechanistically related (29), and several models have been proposed to explain these mechanisms (29–31). Although the models differ in details, they generally assume that the two essential elements for frameshifting are (i) translational pause and (ii) tRNA slippage. Hence we refer to this concept as the pause-and-slip model. More specifically, we based our approach on the model of Farabaugh and Bjork (29), which incorporates all essential elements of the pause-and-slip concept and remains relatively simple.
We used the pause-and-slip model to design the Frameshifting Robustness Score (FRS) that estimates how resistant a sequence is to frameshifting errors during translation. Given such direct measurement, we compared values of FRS for real sequences and a set of control sequences generated from real sequences by random permutations of synonymous codons. We studied general trends of FRS in genomes of model organisms and report evidence that codon usage is optimized to reduce frameshifting errors in B. subtilis, S. cerevisiae and S. pombe whereas the support for the hypothesis for E. coli was weak.
MATERIALS AND METHODS
Data
The gene-coding sequences of B. subtilis were obtained from the Pasteur Institute (http://genolist.pasteur.fr/SubtiList/). The gene-coding sequences of S. pombe were obtained from the Sanger Institute (http://www.sanger.ac.uk/Projects/S_pombe/). The gene-coding sequences of S. cerevisiae were obtained from Man and Pilpel’s compilation (32). The E. coli K12 genome sequence was downloaded from EcoGene (http://ecogene.org) and then the gene coding sequences were extracted based on the annotation available at EcoGene.
Codons at the start and at the end of E. coli gene sequences have been reported to be under different selection pressure as compared to other codons. We repeated all our computation on E. coli after first removing the first 50 codons and the last 20 codons of each gene sequence, following the practice of Stoletzki and Eyre-Walker (13). Unless otherwise stated, the conclusions were the same as those reached without removing codons.
Within the gene sequence set of each organism, we first identified two subsets of equal size with low and high CAI values. We also selected four groups of gene sequences based on length and CAI, covering four combinations: short sequences with low CAI, short sequences with high CAI, long sequences with low CAI and long sequences with high CAI. We sorted gene sequences of each organism by their CAI values computed using Sharp and Li’s method (2). The codon coefficients, required for computing CAI, of E. coli and S. cerevisiae were taken from the same reference (2). The codon coefficients of B. subtilis and S. pombe were taken from Sharp et al.’s work (33). Because of the precision used in the paper (33), some codon coefficients were 0.00, which would make the CAI of gene sequence containing the codons become 0. Hence, we set those codon coefficients to 0.001. Our test results obtained by setting those coefficients to 0.004 were similar and are not shown here. We then chose n sequences with the highest/lowest CAI values as the high/low CAI group gh/gl. We had to consider two factors before deciding on the group size n. One is that each group should contain enough gene sequences so that our computational results were statistically representative. The other factor is that the difference of CAI values in the groups should be large enough so that we could perform meaningful comparison. Based on the two factors, we took n to be 300.
In addition, we considered four gene length thresholds sl < su < ll < lu, where ll and lu are approximately twice of sl and su, respectively. Then we selected gene sequences with lengths between sl and su bp and gene sequences between ll and lu bp. We called them short and long sequences. Among the short sequences, we again took 300 sequences with the highest/lowest CAI values as the groups gsh and gsl. Similarly, among long sequences, we took 300 sequences with the highest/lowest CAI values as the groups glh and gll. The length thresholds were selected so that the difference between average CAI of groups gsl and gsh is about the same as the one between average CAI of groups gll and glh. For B. subtilis, we set sl = 600, su = 800, ll = 1200 and lu = 1800. For S. pombe, we set sl = 700, su = 1100, ll = 1300 and lu = 2100. For S. cerevisiae, we set sl = 600, su = 900, ll = 1200 and lu = 1700. And for E. coli, we set sl = 600, su = 900, ll = 1200 and lu = 1800.
The tRNA gene copy numbers in B. subtilis, S. pombe and E. coli were extracted from GtRNADB, a database containing tRNA genes predicted by tRNAscan-SE (34). The tRNA gene copy number in S. cerevisiae was extracted from Percudani et al.’s result (35), in which the yeast genome was scanned by Pol3scan (36).
Methods
Requirements for tRNA weak binding and slippage. We considered that there are two kinds of base pairs: standard pairs and wobble pairs at the third base. A cognate tRNA carries the standard Watson–Crick pairing or nearly standard wobble pairing matching anticodon for a given codon, while a near-cognate tRNA allows mildly and less favorable wobble pairing at the third base. For a near-cognate tRNA to slip and bind the codon at the shifted frame, we require that the anticodon form at least two base pairs with the codon. The rules of wobble pairing were adopted from several publications (37–39; see also Supplementary Tables). Furthermore, it is well known that some anticodons of tRNA undergo certain modifications in vivo. For example, base U in an anticodon can be modified to 5-methyl-2-thiouridine derivatives, 2′-O-methyluridine, 5-hydroxyuridine derivatives and other forms. The complementary base depends on the modification. For example, U with some modifications can pair with A and G whereas other modifications allow U to pair with U, A and G. Consequently, anticodon modifications have to be taken into account in the definition of sets  and
and  that are used to compute the FRS. We obtained anticodon modification data from the compilation of tRNA sequences and other references (40,41) (the full list is included in Supplementary Data). In S. pombe, when modification of an anticodon was unknown, we used the known modification of the same anticodon in S. cerevisiae.
Permutation test. Given a real gene sequence, 1000 sequences were generated by randomly permuting synonymous codons. More specifically, for each one of the 20 amino acids we record all positions of this particular amino acid in the sequence. Then we randomly permute the codons on these selected positions. This procedure is carried out separately for each amino acid. This way, both CAI and amino acid composition were preserved in the random sequences. Then, FRS of the real sequence was tested against the vector of FRS of random sequences by one sample t-test. In this way, when given a set of real gene sequences, we could check how many real gene sequences have FRS that is significantly lower or higher compared to the FRS of their random counterparts. After obtaining these two numbers, we applied a χ2-test to check the significance. The null hypothesis is that these two numbers should be equal.
Basic statistics of FRS. For sequences of similar length, we measured if FRS of sequences with high CAI was significantly higher than FRS of sequences with low CAI. Given two sequence groups, FRS of the sequence in each group was computed and put in a separate group. Then two groups of FRS would be compared using unpaired t-test.
Comparing FRS at the beginning and towards the end of a sequence and gradient computations. To measure if FRS of sequence segment at the end of a gene sequence was significantly higher than the one of sequence segment at the start of that sequence, for each sequence in a group, we computed FRS of the first 100 and the last 100 codons and put two scores in two groups separately. Then, we performed a paired t-test to compare two groups of FRS. To perform the gradient test, for each sequence in a given group, we computed the pair (FRSi, ni), i = 1, … , m, where FRSi is the FRS of the i-th k codons of the gene and ni = i*k. Then we pooled all the data together and fit a straight line with linear regression between FRSi and ni. The slope of the line was taken as the gradient of FRS along genes’ length in the group. We set m = 40 and k = 5. The first 50 codons were removed from E. coli gene sequences when we computed FRS gradient.
RESULTS
The pause-and-slip model
Our frameshifting model (Figure 1) is based on the pause-and-slip mechanism introduced by Farabaugh and Bjork (29). These authors proposed that translational frameshifting is a two-step process. First, there is a translational pause, caused by an empty ribosomal A-site resulting from insufficient amount of a cognate tRNA and the ensuing competition between the cognate tRNA with a near-cognate tRNA. Since near-cognate tRNA forms a suboptimal bond with the codon, it would fall off more easily than the cognate tRNA. As a result, the A-site might remain unoccupied for a longer time. We refer to this step as the ‘pause’ step. After the near-cognate tRNA successfully but weakly binds the codon at the A-site, it translocates to the P-site. In the second (slip) step, while at the P-site, the weakly bound near-cognate tRNA might slip to the left or right in case its anticodon is also capable of binding the codon in the shifted frame. Because here we focus on uncovering possible optimization against frameshifting errors rather than the impact of a missense error followed by a frameshifting error, we considered only those competing near-cognate tRNAs that are isoacceptors, i.e. carry the same amino-acid as the cognate tRNA.
Figure 1.

+1 frameshifting in the pause-and-slip model. (A) The competition between small number of cognate tRNA and relatively large number of near-cognate tRNA keeps A-site empty for a relatively long time. (B) A near-cognate tRNA enters the A-site, forming a weak bond with the codon at the A-site. (C) The near-cognate tRNA is translocated to P-site and the binding is not stable. (D) The near-cognate tRNA slips one nucleotide to the right, forming a bond with the codon at the +1 shifted frame.
If a tRNA slips to the left/right by one nucleotide, we refer to such an event as −1 or +1 frameshifting, respectively, where the sign indicates the frameshifting direction. Although, following Farabaugh and Bjork (29), we used the pause-and-slip scheme to model both −1 and +1 frameshifting errors, one has to keep in mind that these two events are not fully symmetric because the slip step in −1 frameshifting is likely to involve additional site-dependent factors not included in the model (42). Figure 1 illustrates +1 frameshifting under the pause-and-slip model.
Frameshifting robustness score
Based on the pause-and-slip model, we propose a new measure, the FRS, which estimates how resistant a given sequence is to frameshifting errors during translation. For the FRS calculation, we use tRNA gene copy number in the respective genome as a proxy for tRNA abundance. For E. coli, we repeated the computation using actual tRNA abundance data, with consistent results. The FRS for +1 frameshifting in a gene g is:
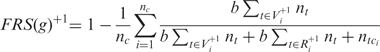 |
where nc is the number of codons in g used to compute the score; the set  contains near-cognate tRNAs that can slip to the right at the P-site after binding the i-th codon ci and the set
  contains near-cognate tRNAs that are assumed to be unable to slip at the P-site after binding codon ci (for details see ‘Materials and Methods’ section); nt is the gene copy number of the tRNA t; tci is the cognate tRNA of codon ci and b is a positive constant less than one, which we call weak binding coefficient. The multiplication by b reflects the fact that near-cognate tRNAs bind codons less stably (with a lower probability) than cognate tRNAs. Here, we report results for b = 0.01 but the results were robust for b values between 0.001 and 0.01 (data not shown). Thus the term,
  , measures the binding potential of tRNA t, which allows for +1 frameshifting after binding codon ci. The denominator,
 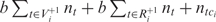 , reflects the binding potential of all tRNAs that compete for binding codon ci. If we let
then pi measures the probability of the occurrence of +1 frameshifting at the codon ci. So 1-pi measures the probability that frameshifting error does not occur at the codon. The +1 FRS of a sequence is the average of such probabilities over all codons in the sequence. A higher score indicates that the sequence is more resistant to +1 frameshifting errors. When computing the score, we did not consider stop codons, non-degenerate codons AUG and UGG, just as these codons are disregarded for computing the CAI. In addition, we disregarded those codons for which the corresponding codon in the +1 shifted frame is a stop codon. FRS for −1 frameshifting was defined in a similar way.
It would be natural to assume that the anticodon carried by a cognate tRNA is the exact Watson–Crick complement of the corresponding codon. However, this approach would not account for two important aspects of codon–anticodon interactions: anticodon modifications and wobble pairing. Anticodons often undergo certain modifications in vivo. With such modification, the base U, for instance, can pair with either with A and G or with U, A and G. Furthermore, bases in the third codon position can form a non-standard, the so called wobble pair, with the first position of the anticodon. Consequently, wobble pairing and anticodon modifications impact the FRS score. Not all wobble pairs are equally favorable. Some form nearly standard pairing; some are mildly favorable and others are less favorable (38,39). Let us refer to a codon followed by a nucleotide |NNN|N as a +1 frameshifting sensitive combination if a +1 frameshifting event can occur at the codon |NNN|. Applying Crick’s original pairing rules (43), which assumes only unmodified G, C, A, U and I in any anticodon, there are 14 +1 frameshifting sensitive combinations in S. cerevisiae. With anticodon modifications, this number increases to 27. We consider a tRNA to be cognate for a given codon if its anticodon forms standard Watson–Crick pairs with the corresponding codon’s first and the second bases and forms a standard or nearly standard wobble pair at the third base. For near-cognate tRNA, the anticodon is allowed to form mildly and less favorable wobble pairs with the third base of the codon. Finally, we assume that the anticodon of a near-cognate tRNA that binds in a shifted position after slippage should form at least two base pairs in the shifted frame, where only nearly standard and mildly favorable wobble pairs are allowed. On the basis of the above binding rules, the set  contains all near-cognate tRNAs that can bind |NNN| and NN|N, whereas
  contains all near-cognate tRNAs that are only capable of binding |NNN|. Full details for base pairing in original and shifted frames are given in the ‘Materials and Methods’ section.
Statistics of the FRS
First, we selected two prokaryotes E. coli and B. subtilis, and two eukaryotes S. cerevisiae and S. pombe, for which (relatively) complete information on anticodon modification is available. We computed +1/−1 FRS for all available gene sequences from these organisms. In the computation of the FRS, we set the weak binding coefficient b to 0.01. The mean, the standard deviation and the minimum of the corresponding +1/−1 FRS values are listed in Table 1 (the maximum +1/−1 FRS in all four organisms was 1). In these computations, we used tRNA gene copy number as a proxy for tRNA abundance. The actual tRNA abundance has been experimentally measured in E. coli (44), so we recomputed +1/−1 FRS of E. coli with the experimental tRNA abundance data. The results were very similar to those obtained with the tRNA gene copy number (Table 1).
Table 1.
The mean, SD and minimum of +1/−1 FRS in four analyzed genomes E. coli, B. subtilis, S. cerevisiae and S. pombe
| +1 FRS | +1 FRS | +1 FRS | +1 FRS | −1 FRS | −1 FRS | −1 FRS | −1 FRS | |
|---|---|---|---|---|---|---|---|---|
| Ec | Bs | Sc | Sp | Ec | Bs | Sc | Sp | |
| Mean | 0.9958 (0.9948) | 0.955 | 0.9936 | 0.99918 | 0.974 (0.974) | 0.958 | 0.9924 | 0.9964 |
| SD | 0.0052 (0.0052) | 0.018 | 0.0050 | 0.00031 | 0.015 (0.015) | 0.019 | 0.0058 | 0.0033 |
| Min | 0.940 (0.940) | 0.82 | 0.928 | 0.9960 | 0.84 (0.84) | 0.84 | 0.924 | 0.966 |
The scores obtained with experimental data on tRNA abundance in E. coli are shown in parentheses.
Ec, E. coli, Bs, B. subtilis, Sc, S. cerevisiae and Sp, S. pombe.
Notably, with the exception of B. subtilis, +1 FRS was significantly higher than −1 FRS in the other three organisms (P < 1e-10). The relatively lower −1 FRS might indicate a lower pressure for optimizing against −1 frameshifting
Because it has been proposed that frameshifting robustness should be higher for longer and more highly expressed genes, to capture such differences appropriately, the genes in each organism were classified into four subsets (see ‘Materials and Methods’ section for details of the definitions): gsh – short sequences with high CAI values; gsl – short sequences with low CAI values; glh – long sequences with high CAI values; and gll – long sequences with low CAI values. Within our length threshold, short proteins are typically single-domain whereas long proteins are typically multi-domain ones.
First, the FRS values of gene sequences in the gsl and gsh sets, and in the gll and glh sets were compared using an unpaired t-test. For B. subtilis, S. cerevisiae and S. pombe, the FRS values of sequences in gsh and glh were significantly higher than the FRS values of sequences in gsl and gll, respectively (Table 2). Thus, compared to the sequences with lower CAI of similar length, the sequences with higher CAI had higher FRS, consistent with the expectation that the latter, presumably highly expressed, genes should be more strongly optimized against frameshifting errors.
Table 2.
Comparison between FRS of sequences in gsh and gsl, and between FRS of sequences in glh and gll for E. coli, B. subtilis, S. cerevisiae and S. pombe
| +1 FRS | +1 FRS | +1 FRS | +1 FRS | −1 FRS | −1 FRS | −1 FRS | −1 FRS | |
|---|---|---|---|---|---|---|---|---|
| Ec | Bs | Sc | Sp | Ec | Bs | Sc | Sp | |
| gsh versus gsl | ? (0.3) | > (3e-13) | > (0) | > (0) | < (0.02) | > (2e-10) | > (5e-12) | > (3e-16) |
| glh versus gll | < (1e-4) | > (0) | > (2e-16) | > (6e-17) | ? (0.2) | > (3e-14) | > (2e-16) | > (2e-16) |
The symbols ‘>’/‘<’ indicate the mean FRS of sequences in gsh (glh) is higher/lower than the mean FRS of sequences in gsl (gll). ‘?’ is used for tests resulting in P > 0.1. The probability that the observation is by chance is shown in the parentheses.
Ec, E. coli, Bs, B. Subtilis, Sc, S. cerevisiae and Sp, S. pombe.
In contrast, in E. coli, the +1 FRS values of sequences in gll were significantly higher than the FRS values of sequences in glh (P < 1e-4), and the −1 FRS values of sequences in gsl were significantly higher than of the sequences in gsh (P < 0.02); other comparisons for E. coli had insignificant P-values (Table 2). It has been reported that in E. coli the codons at the beginning and at the end of a gene sequence are under different selection pressures (22,45), so we repeated the computations after removing 50 codons at the start and 20 codons at the end of genes. With this modification, +1 FRS of sequences in gll remained significantly higher than the ones of sequences in glh (P < 3e-3) whereas the other comparisons had insignificant P-values.
FRS is correlated with CAI and protein abundance
To further characterize the relation between FRS and CAI, we computed, for each organism, the partial correlation between FRS and CAI/length taking length/CAI as the control variable for all genes in 4 organisms (Table 3). The FRS shows significant positive correlation with CAI except for +1 FRS in E. coli. The FRS also shows positive correlation with gene length except for +1 FRS in B. subtilis although this correlation was significant only in E. coli.
Table 3.
Pearson partial correlation between FRS and CAI/length of all genes for E. coli, B. subtilis, S. cerevisiae and S. pombe with length/CAI as the control variable
| +1 FRS versus CAI | −1 FRS versus CAI | +1 FRS versus length | −1 FRS versus length | Number of tested genes | |
|---|---|---|---|---|---|
| Ec | −0.077 (7.77e-7) | 0.059 (1.57e-4) | 0.13 (2.56e-16) | 0.035 (0.024) | 4077 |
| Bs | 0.30 (1.51e-92) | 0.26 (4.35e-66) | −0.051 (0.0010) | 0.034 (0.029) | 4104 |
| Sc | 0.37 (6.90e-202) | 0.36 (4.82e-189) | 0.021 (?) | 0.099 (3.12e-14) | 5869 |
| Sp | 0.47 (0) | 0.24 (4.65e-67) | 0.014 (?) | 0.028 (0.045) | 5052 |
The probability for the correlation is shown in parentheses. ‘?’ is used for tests resulting in P > 0.05.
Ec, E. coli, Bs, B. subtilis, Sc, S. cerevisiae and Sp, S. pombe.
In addition, we reasoned that genes encoding proteins with higher abundance level should have higher FRS. We computed partial correlation between FRS and protein abundance/gene length taking gene length/protein abundance (46) (to the best of our knowledge, no large-scale protein abundance data set for B. subtilis is available) as the control variable (Table 4). The results are consistent with the results obtained for CAI. Again, we observed a significant positive correlation of FRS with protein abundance level in S. cerevisiae and S. pombe but not in E. coli.
Table 4.
Pearson partial correlation between FRS and protein abundance/gene length for E. coli, S. cerevisiae and S. pombe with length/protein abundance as the control variable
| +1 FRS versus protein abundance | −1 FRS versus protein abundance | +1 FRS versus length | −1 FRS versus length | Number of tested genes | |
|---|---|---|---|---|---|
| Ec | −0.091 (0.0038) | −0.045 (?) | 0.11 (3.69e-4) | −0.036 (?) | 1005 |
| Sc | 0.19 (1.63e-31) | 0.18 (6.64e-29) | −0.022 (?) | 0.051 (1.71e-3) | 3839 |
| Sp | 0.23 (5.15e-19) | 0.15 (1.14e-8) | −0.15 (2.46e-9) | −0.062 (0.017) | 1465 |
The probability for the correlation is shown in parentheses. ‘?’ is used for tests resulting in P > 0.05.
Ec, E. coli, Bs, B. subtilis, Sc, S. cerevisiae and Sp, S. pombe.
To further characterize the relation between FRS and CAI, we computed, for each organism, the Pearson correlation coefficients between FRS and CAI for all sequences, and for sequences in two sequence groups (gl and gh) of low and high CAI values, respectively. Additionally, we computed the same correlation in each group gsh, gsl, glh and gll, to control for the potential effect of gene length and CAI level. The results are shown in Table 5, Figure 2 and Supplementary Data. To ensure that the value of binding coefficient did not significantly affect the results, we repeated the computations for b = 0.001, with consistent results (data not shown).
Table 5.
Correlation between +1/−1 FRS and CAI in sequence groups of E. coli, B. subtilis, S. cerevisiae and S. pombe
| +1 FRS versus CAI | +1 FRS versus CAI | +1 FRS versus CAI | +1 FRS versus CAI | −1 FRS versus CAI | −1 FRS versus CAI | −1 FRS versus CAI | −1 FRS versus CAI | |
|---|---|---|---|---|---|---|---|---|
| Ec | Bs | Sc | Sp | Ec | Bs | Sc | Sp | |
| gall | −0.06 (1e-4) | 0.31 (1e-16) | 0.37 (3e-12) | 0.47 (1e-16) | 0.06 (4e-5) | 0.26 (1e-16) | 0.35 (3e-12) | 0.23 (1e-15) |
| gl | 0.05 (0.4) | 0.14 (0.02) | 0.23 (5e-5) | 0.23 (7e-5) | −0.03 (0.7) | −0.004 (0.9) | 0.04 (0.5) | 0.07 (0.2) |
| gh | −0.07 (0.2) | 0.32 (1e-8) | 0.31 (4e-8) | 0.14 (2e-2) | 0.24 (2e-5) | 0.30 (1e-7) | 0.27 (3e-6) | 0.16 (6e-3) |
| gsl | 0.15 (0.01) | 0.1 (0.09) | 0.21 (2e-4) | 0.22 (1e-4) | −0.23 (5e-5) | 0.04 (0.5) | 0.24 (3e-5) | 0.07 (0.2) |
| gsh | −0.16 (4e-3) | 0.31 (6e-8) | 0.41 (1e-13) | 0.47 (4e-16) | 0.21 (3e-4) | 0.34 (1e-9) | 0.42 (3e-14) | 0.30 (9e-8) |
| gll | 0.23 (6e-5) | 0.07 (0.2) | 0.17 (4e-3) | 0.24 (4e-5) | −0.20 (5e-4) | −0.08 (0.1) | 0.16 (4e-3) | 0.11 (0.05) |
| glh | −0.17 (3e-3) | 0.38 (1e-11) | 0.44 (1e-15) | 0.50 (1e-16) | 0.35 (4e-10) | 0.42 (5e-14) | 0.44 (1e-15) | 0.37 (3e-11) |
The probability for the correlation is shown in parentheses.
Ec, E. coli, Bs, B. subtilis, Sc, S. cerevisiae and Sp, S. pombe.
Figure 2.

The relation between +1 FRS and CAI of gene sequences in four groups of B. subtilis: (A) gsl, (B) gll, (C) gsh and (D) glh.
For B. subtilis, S. cerevisiae and S. pombe, +1 FRS showed significant correlation with CAI (except for B. subtilis in group gll). This result confirms that gene sequences with high CAI, on average, appear to be more resistant to +1 frameshifting errors than sequences with lower CAI. Furthermore, within the same length range (groups gsl and gsh, and groups gll and glh), sequences with higher CAI showed a stronger correlation between FRS and CAI. In addition, for all 3 organisms, long gene sequences with high CAI (glh) showed the strongest correlation between FRS and CAI. For these 3 organisms, the relation between −1 FRS and CAI was similar to the one observed for +1 frameshifting with the exception that for B. subtilis −1 FRS for sequences in gl and gll showed insignificant correlation with CAI. The correlation between FRS, especially −1 FRS, and CAI for sequences in groups gl and gh, was often less significant, suggesting that differences in gene length might obscure the relationship between the two factors.
In E. coli, there was no consistent pattern of correlation between FRS and CAI. Surprisingly, for genes with low CAI, the +1 FRS showed significant correlation with CAI values but for genes with high CAI, there was significant negative correlation with CAI. Furthermore, −1 FRS also showed either a negative or a positive correlation with CAI depending on the sequence group (Table 5).
Frameshifting robustness of gene sequences is higher than expected by chance
In our next test, we asked whether the FRS values of real protein-coding sequences differed from the values calculated for sequences in which synonymous codons were randomly permuted (see ‘Materials and Methods’ section). For each organism, gene sequences longer than 200 codons were selected, and for each such gene, 1000 random sequences were generated by permuting synonymous codons. Under this procedure of random sequence generation, the amino-acid sequence and the codon composition remain unchanged but the context that affects frameshifting robustness is randomized. We compared the value of FRS for the real and permuted sequences by testing how many real gene sequences had FRS significantly (P < 0.01) lower or higher compared to random sequences. The test results are not sensitive to P-value cut-off. We repeated the test for P-value cut-off set at 0.001, 0.0001 and 0.00001, with very similar results. The results indicate that, as one might expect, +1 FRS scores were, on average, higher than the corresponding values for randomized sequences in E. coli and B. subtilis; however, the two yeasts did not show this difference (Figure 3A). We repeated this analysis with the FRS computed only for the last 200 codons in each real and permuted sequence. In this comparison, significantly higher +1 FRS values were observed for all four organisms (Figure 3C). The p-value for E. coli, B. subtilis and S. cerevisiae in the last 200 codon comparison is <2.2e-16 and the P-value for S. pombe is <0.004. The comparison of −1 FRS revealed higher values in real sequences compared to randomized sequences for three organisms but E. coli was once again an outlier and showed the opposite trend (Figure 3D).
Figure 3.

The number of real gene sequences whose +1/−1 FRS is significantly higher (blue bar) or lower (red bar) than FRS of random sequences generated by permuting its synonymous codons in four organisms. (A) +1 FRS was computed using the whole real and random sequence. The P-value for E. coli and B. subtilis in the whole sequence comparison for +1 FRS score is 2.1e-9 and less than 2.2e-16, respectively. (B) −1 FRS was computed using the whole real and random sequence. (C) +1 FRS was computed using the last 200 codons of the real and random sequence. (D) −1 FRS was computed using the last 200 codons of the real and random sequence.
This observation suggested the possibility of a positive gradient of FRS along gene sequences.
The FRS increases along the gene-sequence length
The results of the above test indicated that FRS might not be distributed uniformly along the protein-coding sequence but instead might be higher in the 3′-terminal, distal part of the sequence, in accord with the selection for minimization of frameshifting error rate. To further assess this possibility, we computed the FRS of the first 100 and the last 100 codons in each of the analyzed sequences and compared the values using paired t-test (Table 6).
Table 6.
Comparison between FRS of the sequence segment at the start and FRS of the sequence segment at the end of gene sequences for E. coli, B. subtilis, S. cerevisiae and S. pombe
| +1 FRS start versus end | +1 FRS start versus end | +1 FRVS start versus end | +1 FRS start versus end | −1 FRS start versus end | −1 FRS start versus end | −1 FRS start versus end | −1 FRS start versus end | |
|---|---|---|---|---|---|---|---|---|
| Ec | Bs | Sc | Sp | Ec | Bs | Sc | Sp | |
| gsl | ? (0.3) | < (2e-3) | ? (0.5) | < (0.09) | > (0.06) | < (3e-12) | < (0.03) | < (0.07) |
| gsh | ? (0.7) | < (6e-5) | < (0.03) | < (0.05) | > (0.02) | < (2e-16) | ? (0.7) | ? (0.3) |
| gll | ? (1) | < (1e-7) | < (0.07) | ? (0.7) | > (3e-3) | < (3e-12) | ? (0.9) | ? (0.5) |
| glh | ? (0.9) | < (0.02) | < (3e-9) | < (4e-3) | > (4e-3) | < (3e-12) | < (0.02) | ? (0.2) |
The symbols ‘>’/‘< ’ indicate the mean FRS of sequence segment at the start of the sequences in the group is higher/lower than the mean FRS of sequence segment at the end of the sequences. ‘?’ is used for tests resulting in P > 0.1.
The probability for the correlation is shown in parentheses.
Ec, E. coli, Bs, B. subtilis, Sc, S. cerevisiae and Sp, S. pombe.
For B. subtilis, S. cerevisiae and S. pombe, whenever the comparison revealed a significant difference, the FRS of the 100-codon segment toward the end of a gene was higher than the FRS of the segment at the start of the gene. When sequences of similar lengths were compared, the difference of the +1 FRS values for proximal and distal sequences segments were more significant for sequences with high CAI than for sequences with low CAI, except for B. subtilis gene sequences in gll and glh. E. coli demonstrated a different behavior again. In the case of +1 FRS, the results were not significant, and in the case of −1 frameshifting, the −1 FRS values of N-terminus segments were even significantly higher than −1 FRS values of the C-terminal segments (Table 6). When the computation was repeated after removing 50 codons at the start and 20 codons at the end of the genes, this reversed trend was also observed for +1 FRS in the gsl and glh groups of E. coli genes.
Finally, we computed the gradient of FRS of gene sequences in four sequence groups for E. coli, B. subtilis, S. cerevisiae and S. pombe (see ‘Materials and Methods’ section). We observed that, except for B. subtilis sequences in glh, all significant +1 FRS gradients were positive, that is, the resistance to +1 frameshifting errors tends to increase along the length of genes. All −1 FRS gradients were non-significant (Table 7).
Table 7.
The gradient of +1/−1 FRS of the first 200 codons of gene sequence for E. coli, B. subtilis, S. cerevisiae and S. pombe
| +1 FRS gradient | +1FRS gradient | +1 FRS gradient | +1 FRS gradient | −1 FRS gradient | −1 FRS gradient | −1 FRS gradient | −1 FRS gradient | |
|---|---|---|---|---|---|---|---|---|
| Ec | Bs | Sc | Sp | Ec | Bs | Sc | Sp | |
| gsl | NS | NS | NS | NS | NS | NS | NS | NS |
| gsh | NS | NS | NS | 7.5e-7 (8.7e-4) | NS | NS | NS | NS |
| gll | NS | NS | 1.9e-5 (1.6e-3) | 5.2e-7 (0.024) | NS | NS | NS | NS |
| glh | 1.4e-5 (1.2e-3) | −3.0e-5 (0.043) | 2.2e-5 (1.9e-7) | 5.2e-7 (6.4e-6) | NS | NS | NS | NS |
‘NS’ indicates gradients that were not significant (P > 0.05).
The probability for the correlation is shown in parentheses.
Ec, E. coli, Bs, B. subtilis, Sc, S. cerevisiae and Sp, S. pombe.
DISCUSSION AND CONCLUSIONS
It has long been accepted that translation speed and accuracy are two major factors that shape an organism’s codon usage bias. The hypothesis that codon usage bias is optimized to minimize missense errors during translation is fairly well supported (12,13,47). However, processivity errors seem to occur with frequencies comparable to those of missense errors and are potentially more costly. A number of recent studies provided indirect arguments in support of the hypothesis that codon usage is also optimized towards reducing this type of errors (13,22). Indeed, codon usage is likely to be optimized for multiple factors, so it is difficult to untangle the contributions from individual causes. Based on the pause-and-slip molecular model of frameshifting, we developed the FRS to assess resistance of genes to frameshifting errors on the genome scale. Using FRS, we tested whether the codon patterns in 4 well-studied model organisms, E. coli, B. subtilis, S. cerevisiae and S. pombe, were compatible with the hypothesis that codon usage is optimized to avoid frameshifting errors.
The results indicate that the patterns of codon usage in the two yeasts, S. cerevisiae and S. pombe and in the bacterium B. subtilis are consistent with the hypothesis of optimization against frameshifting errors (under the pause-and-slip model). In these three organisms, we observed significant positive correlation between +1/−1 FRS and the codon usage bias measured by CAI and protein abundance. Furthermore, when length-matched sets of sequences were compared, the genes with high CAI have higher FRS than the genes with lower CAI. We also reasoned that, if there is optimization against frameshifting errors, one should expect that the sequences are more highly optimized against such errors towards the end of the sequence, and for sequences with similar CAI, longer sequences would be more strongly optimized. In agreement with these predictions, we observed that FRS of sequence segments toward the 3′-end of a gene was typically higher than the FRS of sequence segments at the start of the gene. In many cases, we even detected a positive gradient of FRS along the gene length. These effects were usually more pronounced in groups of genes with high CAI and/or in groups of longer genes than in groups of short genes with low CAI.
Optimization of codon usage for minimization of frameshifting errors fits the general paradigm of the mistranslation-induced misfolding hypothesis of evolution of protein-coding genes (17). This hypothesis holds that similar evolutionary forces, to a large extent, shape the evolution of both non-synonymous and synonymous positions under selection to minimize the extent and the deleterious effect of protein misfolding that depend both on intrinsic structural features of a protein and on translation error rate (48). Minimization of the accumulation of truncated and otherwise mistranslated proteins resulting from frameshifting errors can be naturally viewed as part of this major, general evolutionary trend.
The results for E. coli were notably less consistent than those for other three organisms but nevertheless seem to be compatible with some degree of codon usage optimization for reducing frameshifting error rate. Surprisingly, in E. coli, we observed correlation between +1 FRS and CAI only for groups of genes with low CAI. Nevertheless, we observed the expected +1 FRS gradient for long genes with high CAI values. At present, we do not have a definitive interpretation of the anomalous results obtained for E. coli genes. However, combined with the observations that (i) FRS of B. subtilis genes was, on average, much lower than the FRS of S. cerevisiae and S. pombe genes, (ii) +1 FRS of genes of B. subtilis showed weaker correlation with CAI compared to genes of S. cerevisiae and S. pombe and (iii) the only significant +1 FRS gradient in B. subtilis is negative, it is tempting to hypothesize that prokaryotic genes, in general, are subject to weaker selection for minimization of frameshifting errors than eukaryotic genes.
Similarly, as it was the case for codon bias, the relation of FRS with gene length (when corrected for the correlation with CAI and protein abundance) is not transparent. There is clear and consistent correlation for E. coli, whereas the remaining three organisms show no significant correlation or even an anti-correlation. Nevertheless, for these three organisms, the gene group consisting of long genes with high CAI showed the highest positive correlation between CAI and FRS.
Comparison of +1 and −1 FRS reveals substantial differences. Compared to +1 FRS, −1 FRS was usually smaller, showed lower correlation with CAI, smaller differences between FRS values at the beginning and at the end of a gene sequence, and no significant FRS gradient. One possible explanation is that +1 frameshifting errors are more likely than −1 frameshifting errors, so gene sequences are subject to greater pressure for optimization against +1 frameshifting errors. Indeed, examination of the data in the translational recoding event database RECODE (49) shows that most of programmed frameshifts in B. Subtilis, S. cerevisiae and S. pombe involve +1 frameshifting.
The approach employed here to estimate optimization of protein-coding sequences for minimization of frameshifting errors has several limitations. First, we applied the simplified pause-and-slip model that was developed for explaining programmed frameshifting. Although it is believed that programmed frameshifting and frameshifting errors share the same mechanism, other frameshifting models cannot be ruled out. For instance, an often considered model invokes out-of-frame binding (without slippage) to explain programmed frameshifting (50). Thus, more experimental studies are necessary to test the validity of the pause-and-slip model. The second limitation of the approach relates to the use of the tRNA gene copy number as an approximation for tRNA abundance. Although the strong positive correlation between these two quantities has been demonstrated in many independent studies for diverse organisms, using tRNA abundance data directly would be desirable. However, this information is unavailable for most organisms and cannot be expected to become available in the near future. In contrast, tRNA gene copy number is easy to obtain computationally for any sequenced genome. In the only model organism, E. coli, for which the actual tRNA abundance was measured, the FRS estimates using experimental data were very close to those obtained with the tRNA gene copy number. Finally, whenever available, we used information about anticodon modifications to properly model codon–anticodon binding. Such information is essential to determine frameshifting sensitive sites and to obtain realistic values of the FRS of gene sequences. However, the list of anticodon modifications for each organism is not necessarily complete, so this incompleteness could also affect the results. Notwithstanding these possible drawbacks, the trends uncovered in this study were highly consistent and thus unlikely to be coincidental.
Codon usage is affected by multiple factors, such as translation efficiency, translation errors, GC content, mRNA secondary structure, and mRNA half life, and thus can be expected to be (partially) optimized for multiple biological purposes. We show here that codon usage is, at least to a certain extent, optimized to reduce frameshifting errors, a finding that fits the general concept of mistranslation-induced protein misfolding being a major factor affecting gene evolution. It remains to be shown how various factors interact with each other during evolution to shape the landscape of codon usage bias.
SUPPLEMENTARY DATA
Supplementary Data are available at NAR Online.
FUNDING
Intramural Research Program of the National Institutes of Health, National Library of Medicine. Funding for open access charge: Intramural research program for the National Institutes of Health, National Library of Medicine.
Conflict of interest statement. None declared.
Supplementary Material
ACKNOWLEDGEMENTS
The authors thank Dr Philip J. Farabaugh (UMBC) for insightful discussion, Dr Alejandro Schaffer and Dr Jie Zhang (NCBI/NIH) for helpful comments on the article.
REFERENCES
- 1.Nakamura Y, Gojobori T, Ikemura T. Codon usage tabulated from international DNA sequence databases: status for the year 2000. Nucleic Acids Res. 2000;28:292. doi: 10.1093/nar/28.1.292. [DOI] [PMC free article] [PubMed] [Google Scholar]
- 2.Sharp PM, Li WH. The codon Adaptation Index–a measure of directional synonymous codon usage bias, and its potential applications. Nucleic Acids Res. 1987;15:1281–1295. doi: 10.1093/nar/15.3.1281. [DOI] [PMC free article] [PubMed] [Google Scholar]
- 3.Chen SL, Lee W, Hottes AK, Shapiro L, McAdams HH. Codon usage between genomes is constrained by genome-wide mutational processes. Proc. Natl Acad. Sci. USA. 2004;101:3480–3485. doi: 10.1073/pnas.0307827100. [DOI] [PMC free article] [PubMed] [Google Scholar]
- 4.Lobry JR. Asymmetric substitution patterns in the two DNA strands of bacteria. Mol. Biol. Evol. 1996;13:660–665. doi: 10.1093/oxfordjournals.molbev.a025626. [DOI] [PubMed] [Google Scholar]
- 5.Kahali B, Basak S, Ghosh TC. Reinvestigating the codon and amino acid usage of S. cerevisiae genome: a new insight from protein secondary structure analysis. Biochem. Biophys. Res. Commun. 2007;354:693–699. doi: 10.1016/j.bbrc.2007.01.038. [DOI] [PubMed] [Google Scholar]
- 6.Carlini DB, Chen Y, Stephan W. The relationship between third-codon position nucleotide content, codon bias, mRNA secondary structure and gene expression in the drosophilid alcohol dehydrogenase genes Adh and Adhr. Genetics. 2001;159:623–633. doi: 10.1093/genetics/159.2.623. [DOI] [PMC free article] [PubMed] [Google Scholar]
- 7.Carlini DB. Context-dependent codon bias and messenger RNA longevity in the yeast transcriptome. Mol. Biol. Evol. 2005;22:1403–1411. doi: 10.1093/molbev/msi135. [DOI] [PubMed] [Google Scholar]
- 8.Francino MP, Ochman H. Deamination as the basis of strand-asymmetric evolution in transcribed Escherichia coli sequences. Mol. Biol. Evol. 2001;18:1147–1150. doi: 10.1093/oxfordjournals.molbev.a003888. [DOI] [PubMed] [Google Scholar]
- 9.Sorensen MA, Kurland CG, Pedersen S. Codon usage determines translation rate in Escherichia coli. J. Mol. Biol. 1989;207:365–377. doi: 10.1016/0022-2836(89)90260-x. [DOI] [PubMed] [Google Scholar]
- 10.Rocha EP. Codon usage bias from tRNA's; point of view: redundancy, specialization, and efficient decoding for translation optimization. Genome Res. 2004;14:2279–2286. doi: 10.1101/gr.2896904. [DOI] [PMC free article] [PubMed] [Google Scholar]
- 11.Kramer EB, Farabaugh PJ. The frequency of translational misreading errors in E. coli is largely determined by tRNA competition. RNA. 2007;13:87–96. doi: 10.1261/rna.294907. [DOI] [PMC free article] [PubMed] [Google Scholar]
- 12.Akashi H. Synonymous codon usage in Drosophila melanogaster: natural selection and translational accuracy. Genetics. 1994;136:927–935. doi: 10.1093/genetics/136.3.927. [DOI] [PMC free article] [PubMed] [Google Scholar]
- 13.Stoletzki N, Eyre-Walker A. Synonymous codon usage in Escherichia coli: selection for translational accuracy. Mol. Biol. Evol. 2007;24:374–381. doi: 10.1093/molbev/msl166. [DOI] [PubMed] [Google Scholar]
- 14.Bulmer M. The selection-mutation-drift theory of synonymous codon usage. Genetics. 1991;129:897–907. doi: 10.1093/genetics/129.3.897. [DOI] [PMC free article] [PubMed] [Google Scholar]
- 15.Lipman DJ, Wilbur WJ. Interaction of silent and replacement changes in eukaryotic coding sequences. J. Mol. Evol. 1984;21:161–167. doi: 10.1007/BF02100090. [DOI] [PubMed] [Google Scholar]
- 16.Marquez R, Smit S, Knight R. Do universal codon-usage patterns minimize the effects of mutation and translation error? Genome Biol. 2005;6:R91. doi: 10.1186/gb-2005-6-11-r91. [DOI] [PMC free article] [PubMed] [Google Scholar]
- 17.Drummond DA, Wilke CO. Mistranslation-induced protein misfolding as a dominant constraint on coding-sequence evolution. Cell. 2008;134:341–352. doi: 10.1016/j.cell.2008.05.042. [DOI] [PMC free article] [PubMed] [Google Scholar]
- 18.Kurland CG. Translational accuracy and the fitness of bacteria. Ann. Rev. Genetics. 1992;26:29–50. doi: 10.1146/annurev.ge.26.120192.000333. [DOI] [PubMed] [Google Scholar]
- 19.Parker J. Errors and alternatives in reading the universal genetic code. Microbiol. Rev. 1989;53:273–298. doi: 10.1128/mr.53.3.273-298.1989. [DOI] [PMC free article] [PubMed] [Google Scholar]
- 20.Eyre-Walker A. Synonymous codon bias is related to gene length in Escherichia coli: selection for translational accuracy? Mol. Biol. Evol. 1996;13:864–872. doi: 10.1093/oxfordjournals.molbev.a025646. [DOI] [PubMed] [Google Scholar]
- 21.Qin H, Wu WB, Comeron JM, Kreitman M, Li WH. Intragenic spatial patterns of codon usage bias in prokaryotic and eukaryotic genomes. Genetics. 2004;168:2245–2260. doi: 10.1534/genetics.104.030866. [DOI] [PMC free article] [PubMed] [Google Scholar]
- 22.Hooper SD, Berg OG. Gradients in nucleotide and codon usage along Escherichia coli genes. Nucleic Acids Res. 2000;28:3517–3523. doi: 10.1093/nar/28.18.3517. [DOI] [PMC free article] [PubMed] [Google Scholar]
- 23.Duret L, Mouchiroud D. Expression pattern and, surprisingly, gene length shape codon usage in Caenorhabditis, Drosophila, and Arabidopsis. Proc. Natl Acad. Sci. USA. 1999;96:4482–4487. doi: 10.1073/pnas.96.8.4482. [DOI] [PMC free article] [PubMed] [Google Scholar]
- 24.Moriyama EN, Powell JR. Gene length and codon usage bias in Drosophila melanogaster, Saccharomyces cerevisiae and Escherichia coli. Nucleic Acids Res. 1998;26:3188–3193. doi: 10.1093/nar/26.13.3188. [DOI] [PMC free article] [PubMed] [Google Scholar]
- 25.Coghlan A, Wolfe KH. Relationship of codon bias to mRNA concentration and protein length in Saccharomyces cerevisiae. Yeast. 2000;16:1131–1145. doi: 10.1002/1097-0061(20000915)16:12<1131::AID-YEA609>3.0.CO;2-F. [DOI] [PubMed] [Google Scholar]
- 26.Lipman DJ, Souvorov A, Koonin EV, Panchenko AR, Tatusova TA. The relationship of protein conservation and sequence length. BMC Evol. Biol. 2002;2:20. doi: 10.1186/1471-2148-2-20. [DOI] [PMC free article] [PubMed] [Google Scholar]
- 27.Farabaugh PJ. Programmed translational frameshifting. Microbiol. Rev. 1996;60:103–134. doi: 10.1128/mr.60.1.103-134.1996. [DOI] [PMC free article] [PubMed] [Google Scholar]
- 28.Farabaugh PJ. Programmed translational frameshifting. Ann. Rev. Genetics. 1996;30:507–528. doi: 10.1146/annurev.genet.30.1.507. [DOI] [PubMed] [Google Scholar]
- 29.Farabaugh PJ, Bjork GR. How translational accuracy influences reading frame maintenance. EMBO J. 1999;18:1427–1434. doi: 10.1093/emboj/18.6.1427. [DOI] [PMC free article] [PubMed] [Google Scholar]
- 30.Hansen TM, Baranov PV, Ivanov IP, Gesteland RF, Atkins JF. Maintenance of the correct open reading frame by the ribosome. EMBO Reports. 2003;4:499–504. doi: 10.1038/sj.embor.embor825. [DOI] [PMC free article] [PubMed] [Google Scholar]
- 31.Urbonavicius J, Qian Q, Durand JM, Hagervall TG, Bjork GR. Improvement of reading frame maintenance is a common function for several tRNA modifications. EMBO J. 2001;20:4863–4873. doi: 10.1093/emboj/20.17.4863. [DOI] [PMC free article] [PubMed] [Google Scholar]
- 32.Man O, Pilpel Y. Differential translation efficiency of orthologous genes is involved in phenotypic divergence of yeast species. Nat. Genetics. 2007;39:415–421. doi: 10.1038/ng1967. [DOI] [PubMed] [Google Scholar]
- 33.Sharp PM, Cowe E, Higgins DG, Shields DC, Wolfe KH, Wright F. Codon usage patterns in Escherichia coli, Bacillus subtilis, Saccharomyces cerevisiae, Schizosaccharomyces pombe, Drosophila melanogaster and Homo sapiens; a review of the considerable within-species diversity. Nucleic Acids Res. 1988;16:8207–8211. doi: 10.1093/nar/16.17.8207. [DOI] [PMC free article] [PubMed] [Google Scholar]
- 34.Lowe TM, Eddy SR. tRNAscan-SE: a program for improved detection of transfer RNA genes in genomic sequence. Nucleic Acids Res. 1997;25:955–964. doi: 10.1093/nar/25.5.955. [DOI] [PMC free article] [PubMed] [Google Scholar]
- 35.Percudani R, Pavesi A, Ottonello S. Transfer RNA gene redundancy and translational selection in Saccharomyces cerevisiae. J. Mol. Biol. 1997;268:322–330. doi: 10.1006/jmbi.1997.0942. [DOI] [PubMed] [Google Scholar]
- 36.Pavesi A, Conterio F, Bolchi A, Dieci G, Ottonello S. Identification of new eukaryotic tRNA genes in genomic DNA databases by a multistep weight matrix analysis of transcriptional control regions. Nucleic Acids Res. 1994;22:1247–1256. doi: 10.1093/nar/22.7.1247. [DOI] [PMC free article] [PubMed] [Google Scholar]
- 37.Nasvall SJ, Chen P, Bjork GR. The wobble hypothesis revisited: uridine-5-oxyacetic acid is critical for reading of G-ending codons. RNA. 2007;13:2151–2164. doi: 10.1261/rna.731007. [DOI] [PMC free article] [PubMed] [Google Scholar]
- 38.Agris PF, Vendeix FA, Graham WD. tRNA's; wobble decoding of the genome: 40 years of modification. J. Mol. Biol. 2007;366:1–13. doi: 10.1016/j.jmb.2006.11.046. [DOI] [PubMed] [Google Scholar]
- 39.Cochella L, Green R. Wobble during decoding: more than third-position promiscuity. Nat. Struct. Mol. Biol. 2004;11:1160–1162. doi: 10.1038/nsmb1204-1160. [DOI] [PubMed] [Google Scholar]
- 40.Sprinzl M, Vassilenko KS. Compilation of tRNA sequences and sequences of tRNA genes. Nucleic Acids Res. 2005;33:D139–D140. doi: 10.1093/nar/gki012. [DOI] [PMC free article] [PubMed] [Google Scholar]
- 41.Kanaya S, Yamada Y, Kudo Y, Ikemura T. Studies of codon usage and tRNA genes of 18 unicellular organisms and quantification of Bacillus subtilis tRNAs: gene expression level and species-specific diversity of codon usage based on multivariate analysis. Gene. 1999;238:143–155. doi: 10.1016/s0378-1119(99)00225-5. [DOI] [PubMed] [Google Scholar]
- 42.Leger M, Dulude D, Steinberg SV, Brakier-Gingras L. The three transfer RNAs occupying the A, P and E sites on the ribosome are involved in viral programmed -1 ribosomal frameshift. Nucleic Acids Res. 2007;35:5581–5592. doi: 10.1093/nar/gkm578. [DOI] [PMC free article] [PubMed] [Google Scholar]
- 43.Crick FH. Codon–anticodon pairing: the wobble hypothesis. J. Mol. Biol. 1966;19:548–555. doi: 10.1016/s0022-2836(66)80022-0. [DOI] [PubMed] [Google Scholar]
- 44.Dong H, Nilsson L, Kurland CG. Co-variation of tRNA abundance and codon usage in Escherichia coli at different growth rates. J. Mol. Biol. 1996;260:649–663. doi: 10.1006/jmbi.1996.0428. [DOI] [PubMed] [Google Scholar]
- 45.Eyre-Walker A. The close proximity of Escherichia coli genes: consequences for stop codon and synonymous codon use. J. Mol. Evol. 1996;42:73–78. doi: 10.1007/BF02198830. [DOI] [PubMed] [Google Scholar]
- 46.Ishihama Y, Schmidt T, Rappsilber J, Mann M, Hartl FU, Kerner MJ, Frishman D. Protein abundance profiling of the Escherichia coli cytosol. BMC Genomics. 2008;9:102. doi: 10.1186/1471-2164-9-102. [DOI] [PMC free article] [PubMed] [Google Scholar]
- 47.Archetti M. Selection on codon usage for error minimization at the protein level. J. Mol. Evol. 2004;59:400–415. doi: 10.1007/s00239-004-2634-7. [DOI] [PubMed] [Google Scholar]
- 48.Wolf MY, Wolf YI, Koonin EV. Comparable contributions of structural-functional constraints and expression level to the rate of protein sequence evolution. Biol. Direct. 2008;3:40. doi: 10.1186/1745-6150-3-40. [DOI] [PMC free article] [PubMed] [Google Scholar]
- 49.Baranov PV, Gurvich OL, Hammer AW, Gesteland RF, Atkins JF. Recode 2003. Nucleic Acids Res. 2003;31:87–89. doi: 10.1093/nar/gkg024. [DOI] [PMC free article] [PubMed] [Google Scholar]
- 50.Stahl G, Ben Salem S, Li Z, McCarty G, Raman A, Shah M, Farabaugh PJ. Programmed +1 translational frameshifting in the yeast Saccharomyces cerevisiae results from disruption of translational error correction. Cold Spring Harb. Symp. Quant. Biol. 2001;66:249–258. doi: 10.1101/sqb.2001.66.249. [DOI] [PubMed] [Google Scholar]
Associated Data
This section collects any data citations, data availability statements, or supplementary materials included in this article.