Abstract
Background: Although the effects of acute dietary interventions on the human metabolome have been studied, the extent to which the metabolome can be normalized by extended dietary standardization has not yet been examined.
Objective: We examined the metabolic profiles of healthy human subjects after extended dietary standardization to see whether the inherent variation in the human metabolome could be decreased.
Design: A cohort of 10 healthy volunteers was admitted to a clinical research center for 2 wk of dietary standardization. Daily serum and urine samples and serum samples at a 2-wk follow-up visit were collected. The samples were analyzed by 1H nuclear magnetic resonance (NMR) spectroscopy and multivariate statistical analyses.
Results: NMR spectra were collected to globally profile the higher-concentration metabolites (>μmol/L concentrations). Metabolic changes were observed in some serum samples after day 1 or the 2-wk follow-up visit. For each subject, the samples from all other days had similar profiles. The urinary metabolome reflected no effects from dietary standardization. Pooled 24-h urine samples were studied, which indicated that any normalization that does occur would do so in <24 h.
Conclusions: For both the urinary and serum metabolome, a single day of dietary standardization appears to provide all of the normalization that is achievable within the strict controls implemented in a clinical research setting. After 24 h, the subjects remain in their metabolic space; the remaining intra- and intersubject variations appear to be influenced by variables such as genetics, age, and lifestyle.
INTRODUCTION
Many of the diseases of modern life are the result of subtle metabolic imbalances related to diet. The field of metabolomics affords a way of profiling the global metabolic state of an organism (1). Metabolomics utilizes analytic technologies such as nuclear magnetic resonance (NMR) spectroscopy or mass spectrometry to measure the multicomponent metabolic composition of biological fluids such as urine or serum (2, 3). Data from these studies are then analyzed by using multivariate statistics to identify the metabolic changes that result from a particular challenge to the organism. These methods have been successfully applied to elucidate the metabolic alterations that result from disease states or pharmaceutical interventions (4–6), but the applications to nutrition have only recently begun to emerge (7, 8).
One of the challenges of nutritional metabolomics in humans is in detecting the potentially subtle perturbations in the presence of the inherently high variability in the human metabolome. Several metabolomics studies have examined cohorts of healthy human subjects to assess the variability as influenced by factors such as age and sex (9, 10). In general, these studies found that intersubject variation was more significant than intrasubject variation, indicating that each person has a distinct metabolic phenotype (also known as their metabotype) (11). Other studies have looked at the effects of culturally driven dietary influences (12, 13) or specific dietary interventions to assess the extent to which diet modulates the metabolome (14–16). In one of the most extensive, longitudinal metabolomics studies in healthy humans, Assfalg et al (17) collected urine samples from 22 subjects over a 3-mo period. There were no dietary restrictions imposed on the subjects. Advanced statistical modeling was used to identify specific features of the NMR spectra that could be used to unequivocally identify each individual. The observation of these unique metabolic features supports the idea that each person possesses an individual metabotype, which is quite heavily masked by inherent variability.
To conduct the most-informative metabolomics analyses, it would be ideal to minimize the “noisy” features of the metabolome so that the subtle and specific perturbations that result from a nutritional intervention could be most easily observed. To address this need, we must examine the extent to which metabolic variation can be minimized by the controls available in human studies. In this study, we address the question of how much normalization of the human metabolome can be achieved with prolonged dietary standardization. A cohort of 10 subjects was admitted to a clinical research center for 2 wk and given a standardized whole-food diet. The protocol included daily, early morning, and fasted serum collections as well as 24-h pooled urine collections. The results of this study should aid in the design of future metabolomics studies to achieve the highest degree of metabolic normalization in a clinical setting.
SUBJECTS AND METHODS
Study design
This study was approved by the University of North Carolina Institutional Review Board. All participants provided with written consent forms. This study involved 65 subjects who were inpatients at the University of North Carolina General Clinical Research Center. Daily urine and serum samples were collected from 10 of these subjects for a 2-wk period, and a single serum sample was collected at a follow-up visit 2 wk after the end of the initial study. These subjects comprised the placebo group in a clinical study of acetaminophen toxicity. [Full details of this clinical study were reported by Harrill et al (18) and are presented under “Supplemental data” in the online issue.] The remaining 55 subjects began dosing on day 4 of the study, and the predose samples (days 1–3) were analyzed here.
The 2-wk cohort consisted of 7 male and 3 female subjects. Average subject age was 25.2 y (range: 18–42 y). Average body mass index (BMI; in kg/m2) was 25.8 (range: 19.9–32.4). The 3-d cohort consisted of 55 subjects (23 women and 32 men). Average subject age was 31 y (range: 18–58 y), and average BMI was 25.8 (range: 19.1–39.6). Subjects refrained from alcohol consumption, medications, vitamins, supplements, or herbs (with the exception of birth control pills or antidepressants) for ≥2 wk before admission. Further exclusion criteria included history of abnormal liver enzymes, chronic alcohol abuse, chronic liver disease, or history of acetaminophen use over the 3 mo before screening.
Standardized diet
Subjects received a constant macronutrient diet composed of common foods for breakfast, lunch, dinner, and a bedtime snack rotated on a 2-d cycle. Meals were provided at consistent times each day. Meals containing 35 calories/kg body weight were provided on the basis of a subject's actual body weight if his or her BMI was <30 or on the basis of adjusted body weight for obesity if a subject's BMI was >30. The macronutrient breakdown was 15% protein, 30% fat, and 55% carbohydrate. Diets were adjusted to maintain body weight by increasing energy intake by 300 calories/d if a subject's weight decreased by 1 kg, and energy intake was decreased by 200 calories/d if a subject's weight increased by 1 kg. No other foods were allowed; subjects could consume water, caffeine-free diet soda, and decaffeinated black coffee and tea ad libitum.
The foods and amounts provided of each food are listed in Supplemental Table 1 (see under “Supplemental data” in the online issue). Food substitutions were made if the subject could not tolerate a particular food.
Sample collection
Fasted blood samples were drawn at 0800 daily, and 24-h urine samples were collected and frozen at −80°C throughout the study. Subjects returned 2 wk after discharge for a follow-up visit and a fasting blood sample. (All samples from days 4 and 11 were collected separately for use in pharmacokinetic analyses and were not available for use with this study.)
Sample preparation
Frozen serum and urine samples were thawed overnight at 4°C. Aliquots of 540 μL serum were added to 5-mm NMR tubes containing 60 μL of a heavy water (D2O) solution that contained 26.5 mmol formate/L for a chemical-shift reference and 0.2% NaN3 to inhibit bacterial growth. Aliquots of 540 μL urine were added to 5-mm NMR tubes that contained 60 μL of 924-mmol phosphate-buffered D2O solution/L at a pH of 6.14. The D2O solution contained 4.6 mmol trimethylsilylpropionate (TSP) for a chemical-shift reference, 92 mmol imidazole for a pH reference, and 0.2% NaN3 to inhibit bacterial growth.
1H NMR spectroscopy
All NMR spectroscopic measurements were performed with the use of a Varian INOVA spectrometer (Varian Inc, Palo Alto, CA), which was operated at 399.80 MHz (1H frequency) and at 25°C. A Carr-Purcell-Meiboom-Gill (CPMG) pulse sequence was used to collect the spectra. Serum samples were collected with a preacquisition delay of 2.5 s followed by 2.0 s solvent presaturation, a 90° pulse, and a 100-ms CPMG delay time. Free induction decays were acquired over 2.56 s with a sweep width of 4389.8 Hz and 16,384 points. Urine samples were collected with a recycle delay of 4.1 s, which included 4.0 s H2O presaturation. A 20-ms CPMG delay time was used to narrow the residual water peak. A sweep width of 6388 Hz was digitized with 16,360 points, which led to an acquisition time of 2.56 s. A total of 256 scans (ie, repetitions of the pulse sequence) were collected for both serum and urine samples.
Spectral processing
All NMR spectra were processed with the use of ACD/1D NMR Manager 8.0 (Advanced Chemistry Development Inc, Toronto, Canada). Linear prediction of the first 2 points, 0.3 Hz exponential line broadening, and zero filling to 32,768 points were applied to each spectrum. After Fourier transformation, each spectrum was manually phased and baseline correction was applied. The chemical shifts of the serum spectra were referenced to the formate peak at 8.47 ppm, and the urine spectra were referenced to the TSP peak at 0.00 ppm. Regions of the spectra upfield of 0.00 ppm and downfield of 10.00 ppm were removed from the analysis because they contained only noise. The region around the residual water peak from 4.50 to 5.10 ppm was also excluded from the analysis. The urine and serum spectra were then processed as separate groups.
The spectra were integrated by using the Intelligent Bucketing method in the ACD software with bin sizes of 0.02–0.06 ppm. To reduce the negative effect of noise, the bins containing only noise were excluded. These bins were identified by considering the range of values for a given bin across all spectra. The bins were sorted by increasing bin range, and a threshold was determined such that bins with a range lower than the threshold were considered noise.
Multivariate statistical analysis
The NMR data were imported into SimcaP+ (version 11.5; Umetrics, Umeå, Sweden). The data were mean-centered and scaled to Pareto variance (1/√SD). Principal components analysis (PCA) was then performed on the resulting data. The resulting 2-dimensional scores plots show each of the samples on axes that correspond to the major sources of variance in the data. By using this method, similar samples cluster near one another, whereas disparate samples are farther apart.
RESULTS
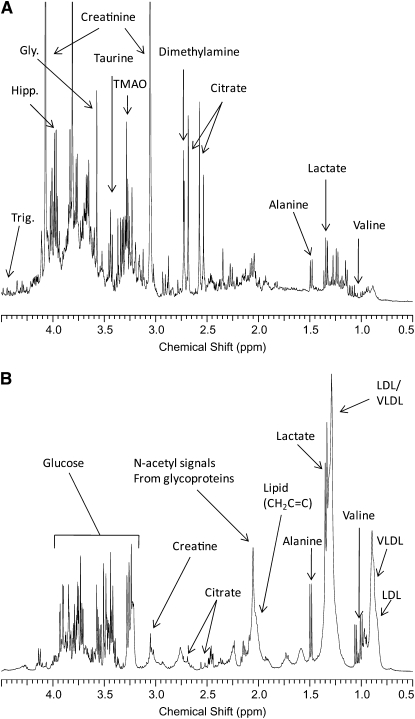
Typical urine and serum spectra as well as some metabolite assignments are shown in Figure 1.
FIGURE 1.
Examples of the 1H nuclear magnetic resonance spectra from urine (A) and serum (B) from the healthy volunteers used in this study. Significant metabolite assignments are shown. Spectra were acquired and processed as described in Subjects and Methods. VLDL, very-low-density-lipoprotein cholesterol; LDL, LDL cholesterol; Gly, glycine; Hipp, hippurate; Trig, trigonelline, TMAO, trimethylamine oxide.
Serum
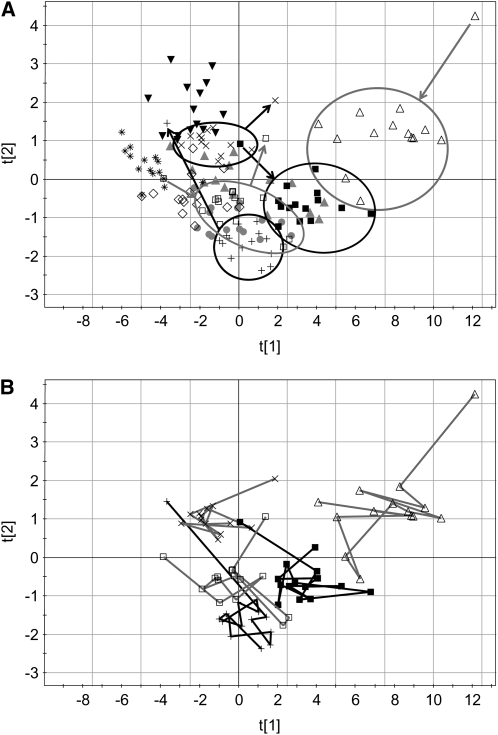
PCA scores plots for serum data are shown in Figure 2A. The first 2 principal components explain >80% of the variation in the data. In the scores plot, subjects with similar spectra and hence similar metabolomic profiles are located near one another. The spectra from each subject are generally located in the same region of the plot. The distribution of samples from each subject represents the intrasubject variation. The separation between the subject groups represents the intersubject variation. As shown in the figure, 5 of the subjects possess 1 or 2 points that are outliers from their main groups. Ellipses are drawn around the main groups, with an arrow pointing either toward or away from the outlier. In all cases, the outliers are from either the first day or the 2-wk follow-up visit. The samples from the first day were acquired after an overnight fast as were the samples at the follow-up visits. The fact that all the other samples are located in the same region suggests that a single day provides all of the normalization possible with dietary standardization. After the first day, the subjects remain in the same general region of the PCA plot, which is referred to as their metabolic space for the duration of the clinical study.
FIGURE 2.
Principal components scores plots of the data from serum 1H nuclear magnetic resonance spectra. Symbols denote individual subjects and include 12 time points each (days 1–13 plus the 2-wk follow-up with days 4 and 11 excluded). A: Points from 5 subjects are enclosed by an ellipse to show the groupings; outliers are denoted by arrows. Arrows pointing toward the ellipses correspond to day 1, and those pointing away from the ellipses correspond to the 2-wk follow-up. B: Metabolic trajectories of the same 5 subjects as in panel A are shown, and it is clear that, aside from the first day or the follow-up day, there is no consistent direction to the points over the course of the study. The first and second principal components are noted as t[1] and t[2], respectively.
Within each of the clusters, the trajectory of the days across the 2 wk was examined for any trends. In Figure 2B, the samples for the same 5 subjects highlighted in Figure 2A are connected across the time course. The samples for each of these subjects were examined to see whether a consistent metabolic trajectory could be seen over the 2-wk period. It was clear that, aside from the first and last points, no trend was observed. One might have expected that with extended dietary standardization, the metabolomes of each of the subjects would become more similar and thus trend toward a common location on the principal components plot, but this is not the case. The points for each subject remain in their metabolic space on the basis of his or her individual metabotype. This result shows that extended dietary standardization should not lead to a confounding source of variation in clinical studies as the metabolomes develop a new homeostasis.
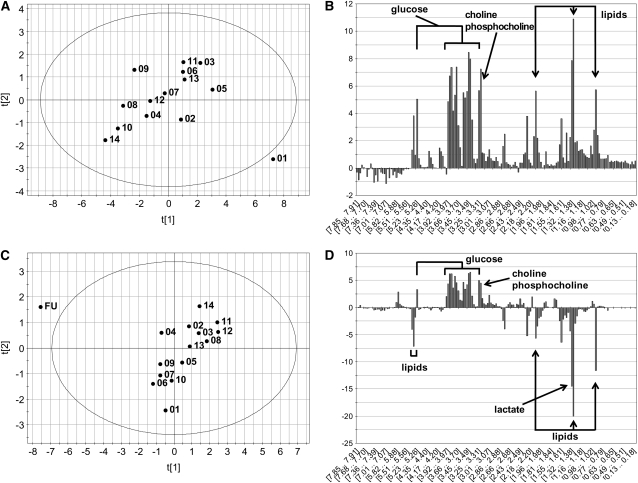
To examine the biochemical basis for the separation of the day 1 or follow-up samples, 2 of the 5 subjects with outliers were selected as examples and were modeled individually. The principal components scores and contribution plots of 2 subjects are shown in Figure 3. In each of the scores plots a single day is clearly an outlier from the main group. The contribution plot is similar to a loading plot but is used to reveal the variables in the model (the spectral bins), which are specifically responsible for the separation of the outlier from the main group. The magnitude of the bar along the vertical axis indicates the importance of the particular spectral bin in discerning the outlier from the rest of the group, and the sign indicates whether that bin is higher or lower in the outlier. The contribution plot in Figure 3B shows that that metabolic profile for day 1 of that subject was higher in lipids, lactate, and glucose compared with subsequent days. The contribution plot in Figure 3D shows higher glucose and lower lipid and lactate concentrations in the metabolomic profile for the follow-up day than for subsequent days.
FIGURE 3.
Principal components scores and contributions plots from 2 subjects that showed a single day that was clearly distinct from the others. A: The scores plot of this subject is annotated with the days of each sample, and it is clear that day 1 is an outlier from the group. B: The contributions plot shows that this is largely due to elevated glucose and lipids in the day 1 sample. C: The scores plot from this subject shows that the follow-up (FU) day was clearly different. D: The contributions plot shows that this difference shown in panel C is due to reductions in lipids and elevations in glucose. The abscissa on the contributions plot is composed of the spectral bins used in the principal components analysis model. The first and second principal components for each of the scores plots are noted as t[1] and t[2], respectively.
Urine
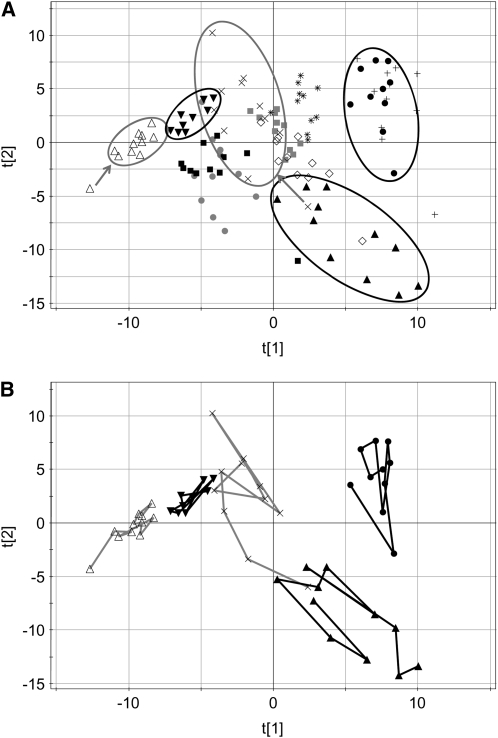
The PCA plot scores of the urine data are shown in Figure 4A. Because all urine samples were pooled 24-h collections and this type of collection was not possible for the 2-wk follow-up, urine samples from the 2-wk follow-up were not used. In general, the plot scores show a wider distribution of the samples, which indicates a higher degree of intersubject variation. The time points from 5 subjects are enclosed by ellipses in Figure 4A. The points from those same 5 subjects are connected in Figure 4B to show that there is no consistent trajectory over the course of the 2-wk period.
FIGURE 4.
Principal components scores plots of the data from the urine 1H nuclear magnetic resonance spectra. Symbols denote individual subjects and include 11 time points (days 1–13, excluding days 4 and 11; no 2-wk follow-up samples were collected). A: Points from 5 subjects are enclosed by an ellipse to show the groupings. B: Metabolic trajectories of the same 5 subjects are shown to clarify that no normalization occurs over the 2-wk time course. The first and second principal components are noted as t[1] and t[2], respectively.
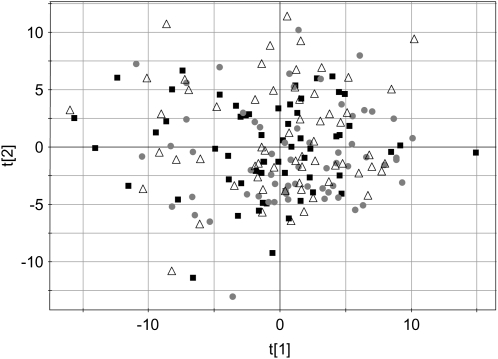
Because the previous data suggest that any metabolome standardization due to a controlled diet occurs within 1 d, urine samples from 55 subjects with only 3 d of dietary standardization were examined. Serum samples for all subjects were not available for this part of the study. It was thought that by increasing the number of samples, the more-subtle changes in the metabolome may be detectable, and thus some normalization effects of the 3 d of dietary standardization would be revealed. The PCA scores plots for these data are shown in Figure 5. It is clear that there is no significant separation of the samples from days 1, 2, or 3. A supervised partial least-squares model for these data was constructed (data not shown), and the results confirmed that there is no statistically valid separation of the days.
FIGURE 5.
Principal components scores plot of urine data for 55 subjects on days 1–3 of the study. In this plot, the days are represented by different symbols. The lack of segregation of samples from each of the 3 d indicates that no normalization could be detected with this larger cohort. The first and second principal components are noted as t[1] and t[2], respectively.
DISCUSSION
This study was designed to address the question of how much normalization can be achieved in the human metabolome by careful control of diet and environment. Other studies have looked at the effects of acute diet standardization in healthy human subjects. In 2006, Walsh et al (16) examined urine, plasma, and saliva from 30 healthy human subjects on 4 separate days over the course of 1 mo. They found that the serum and saliva metabolomes were not affected by the dietary controls, but a reduction in the intersubject variation was noted in the urine profiles after a standardized diet on the day before the last visit.
In another study by Lenz et al (14), 12 healthy male subjects were studied on 2 separate days, 14 d apart. This study found more diversity in the spectra of the first void urines compared with those of the 0–12- and 12–24-h samples. They concluded that the first void urines were the most variable and most likely influenced by the uncontrolled diet and activity of the subjects before the study.
For the serum metabolome, the studies mentioned above concluded that dietary standardization on the day before, or day of, sample collection resulted in no observable normalization. By extending the dietary intervention, our results show that for almost half of the subjects, the metabolic trajectory from day 1 indicates that some normalization of the metabolome is achieved with a single day of a standardized diet. Examination of the outliers showed that after an overnight fast, glucose and some lipid concentrations were different from those achieved after 24 h on the standardized diet. The calorie-controlled, standardized diet appears to have created a new homeostasis for lipids and glucose after 24 h in the 5 subjects who had outlier samples. There are 2 possible reasons why this effect was seen in our study and not the other 2 studies: 1) by extending the dietary standardization, we obtain a clearer picture of each person's metabolic space, and therefore the outlier days are more distinct; and 2) the more-stringent dietary and environmental controls afforded by an inpatient study may allow the observation of subtler effects.
In the work by Walsh et al (14) and Lenz et al (16), detectable normalization of the urinary metabolome was observed after an acute dietary standardization. No standardization was observed in our study, but this does not controvert the findings of Walsh et al and Lenz et al (14, 16). We collected pooled 24-h urine samples, whereas the Walsh and Lenz groups analyzed the much more variable samples from first-void morning and evening collections. It is reasonable that acute dietary effects are more distinct in these time-focused samplings. In essence, these effects are literally diluted out by our 24-h collections. The fact that the extended dietary standardization showed no additional normalizing effect on the urinary metabolome shows that, as with serum, the normalizing effect of the diet is complete after 24 h.
To our knowledge, this study provided the highest degree of dietary and environmental control in a human metabolomics trial to date. This study was carried out by using global NMR-based profiling, and therefore the inherent sensitivity limitations of NMR must be considered. Components of the metabolome that are below micromolar concentrations would not be detected by the analytic platform used in this study. It is possible that low-concentration components (eg, phytochemicals or vitamins) could be detected by using a more sensitive method such as targeted liquid chromatography–mass spectrometry. In future metabolomics studies, it appears that a standardized diet that lasts a single day may be sufficient to provide all of the normalization that can be achieved in the human metabolome.
Supplementary Material
Acknowledgments
The authors' responsibilities were as follows—JHW: conducted the metabolomics experiments and the multivariate statistical analyses; MGB: contributed to the design of the clinical study and assisted in the interpretation of the results; PBW: designed the clinical trial; and TMO: conceived and designed the metabolomics experiments, directed the interpretation of the data, and authored the manuscript. None of the authors had a conflict of interest.
REFERENCES
- 1.Fiehn O. Combining genomics, metabolome analysis, and biochemical modeling to understand metabolic networks. Comp Funct Genomics 2001;2:155–68 [DOI] [PMC free article] [PubMed] [Google Scholar]
- 2.Nicholson JK, Connelly J, Lindon JC, Holmes E. Metabonomics: a platform for studying drug toxicity and gene function. Nat Rev Drug Discov 2002;1:153–61 [DOI] [PubMed] [Google Scholar]
- 3.Nicholson JK, Wilson ID. Opinion: understanding ‘global’ systems biology: metabonomics and the continuum of metabolism. Nat Rev Drug Discov 2003;2:668–76 [DOI] [PubMed] [Google Scholar]
- 4.Griffin JL. Metabonomics: NMR spectroscopy and pattern recognition analysis of body fluids and tissues for characterization of xenobiotic toxicity and disease diagnosis. Curr Opin Chem Biol 2003;7:648–54 [DOI] [PubMed] [Google Scholar]
- 5.Nicholson JK, Lindon JC, Holmes E. ‘Metabonomics’: understanding the metabolic responses of living systems to pathophysiological stimuli via multivariate statistical analysis of biological NMR spectroscopic data. Xenobiotica 1999;29:1181–9 [DOI] [PubMed] [Google Scholar]
- 6.Robertson DG. Metabonomics in toxicology: a review. Toxicol Sci 2005;85:809–22 [DOI] [PubMed] [Google Scholar]
- 7.Gibney MJ, Walsh M, Brennan L, Roche HM, German B, van Ommen B. Metabolomics in human nutrition: opportunities and challenges. Am J Clin Nutr 2005;82:497–503 [DOI] [PubMed] [Google Scholar]
- 8.Rezzi S, Ramadan Z, Fay LB, Kochhar S. Nutritional metabonomics: applications and perspectives. J Proteome Res 2007;6:513–25 [DOI] [PubMed] [Google Scholar]
- 9.Kochhar S, Jacobs DM, Ramadan Z, Berruex F, Fuerholz A, Fay LB. Probing gender-specific metabolism differences in humans by nuclear magnetic resonance-based metabonomics. Anal Biochem 2006;352:274–81 [DOI] [PubMed] [Google Scholar]
- 10.Slupsky CM, Rankin KN, Wagner J, et al. Investigations of the effects of gender, diurnal variation, and age in human urinary metabolomic profiles. Anal Chem 2007;79:6995–7004 [DOI] [PubMed] [Google Scholar]
- 11.Gavaghan CL, Holmes E, Lenz E, Wilson ID, Nicholson JK. An NMR-based metabonomic approach to investigate the biochemical consequences of genetic strain differences: application to the C57BL10J and Alpk:ApfCD mouse. FEBS Lett 2000;484:169–74 [DOI] [PubMed] [Google Scholar]
- 12.Zuppi C, Messana I, Forni F, Ferrari F, Rossi C, Giardina B. Influence of feeding on metabolite excretion evidenced by urine 1H NMR spectral profiles: a comparison between subjects living in Rome and subjects living at arctic latitudes (Svaldbard). Clin Chim Acta 1998;278:75–9 [DOI] [PubMed] [Google Scholar]
- 13.Lenz EM, Bright J, Wilson ID, et al. Metabonomics, dietary influences and cultural differences: a 1H NMR-based study of urine samples obtained from healthy British and Swedish subjects. J Pharm Biomed Anal 2004;36:841–9 [DOI] [PubMed] [Google Scholar]
- 14.Lenz EM, Bright J, Wilson ID, Morgan SR, Nash AF. A 1H NMR-based metabonomic study of urine and plasma samples obtained from healthy human subjects. J Pharm Biomed Anal 2003;33:1103–15 [DOI] [PubMed] [Google Scholar]
- 15.Stella C, Beckwith-Hall B, Cloarec O, et al. Susceptibility of human metabolic phenotypes to dietary modulation. J Proteome Res 2006;5:2780–8 [DOI] [PubMed] [Google Scholar]
- 16.Walsh MC, Brennan L, Malthouse JP, Roche HM, Gibney MJ. Effect of acute dietary standardization on the urinary, plasma, and salivary metabolomic profiles of healthy humans. Am J Clin Nutr 2006;84:531–9 [DOI] [PubMed] [Google Scholar]
- 17.Assfalg M, Bertini I, Colangiuli D, et al. Evidence of different metabolic phenotypes in humans. Proc Natl Acad Sci USA 2008;105:1420–4 [DOI] [PMC free article] [PubMed] [Google Scholar]
- 18.Harrill AH, Watkins PB, Su S, et al. Mouse population-guided resequencing reveals that variants in CD44 contribute to acetaminophen-induced liver injury in humans. Genome Res 2009;9:1507–15 [DOI] [PMC free article] [PubMed] [Google Scholar]
Associated Data
This section collects any data citations, data availability statements, or supplementary materials included in this article.


