

Abstract
The non-nucleoside reverse transcriptase inhibitor (NNRTI) TMC278/rilpivirine is an anti-AIDS therapeutic agent with high oral bioavailability despite its high hydrophobicity. Previous studies established a correlation between ability of the drug molecule to form stable, homogeneous populations of spherical nanoparticles (~100–120 nm in diameter) at low pH in surfactant-independent fashion, and good oral bioavailability. Here, we hypothesize that the drug is able to assume surfactant-like properties under physiologically relevant conditions, thus facilitating formation of nanostructuresin the absence of other surfactants. The results of all-atom molecular dynamics simulations indeed show that protonated drug molecules behave as surfactants at the water/aggregate interface while neutral drug molecules assist aggregate packing via conformational variability. Our simulation results suggest that amphiphilic behavior at low pH and intrinsic flexibility influence drug aggregation and are believed to play critical roles in the favorable oral bioavailability of hydrophobic drugs.
Good oral bioavailability is increasingly considered to be a key feature of new chemical entities (NCEsa) as potential drug candidates identified through high throughput screening (HTS), combinatorial chemistry, and cell-based activity assays.1 Current statistics report that 35–40% of NCEs are known to belong to the biopharmaceutics classification systems (BCS) class II type of molecules with poor solubility and high permeability properties.1, 2 Attempts to improve oral bioavailability for class II compounds focused on enhancement of drug solubility via a myriad of formulation designs including salt complexation3, prodrug formation4, particle size reduction,5, 6 self- emulsifying drug delivery system (SEDDS),6–8, 9, self-microemulsifying drug delivery system (SMEDDS), 6, 9 micellar/surfactant system, 10 and solid dispersion.1, 11, 12 Most of these formulation designs focus on generation of stable, nanosize delivery units obtained either by altering the physicochemical properties of the drug molecules or by addition of cosolvents, surfactants, and/or lipid suspensions. Unfortunately, besides the intrinsic complexity and drug specificity involved in implementation of some of the mentioned methods there are also issues of drug precipitation, low drug loading, instability, excipient-related toxicity, and first-pass metabolism that require further investigation and improvement.1, 13
Though uncommon, there are NCEs that fall outside of the poor solubility/poor bioavailability trend,14 such as the highly hydrophobic NNRTI TMC278, compound 1 (Figure 1a), which has been shown to be highly potent against HIV-1 at relatively low oral doses (~25–75 mg/day).15, 16 Compound 1 belongs to the diarylpyrimidine (DAPY) class of anti-AIDS drugs that specifically bind to a highly hydrophobic pocket in the reverse transcriptase (RT) enzyme of HIV-1.15, 17, 18 Crystallographic and computational studies have shown that ability of the molecules in this class to tolerate prevalent mutations in the binding pocket stem from their capacity to observe multiple binding modes via torsional flexibility (wiggling) and local repositioning (jiggling) while adapting to movements of surrounding pocket residues.15, 19, 20 For some of the NNRTIs exceptional RT-binding properties are accompanied by surprisingly good oral bioavailability.16, 21 While some of the compounds, such as the recently approved DAPY NNRTI drug TMC125/etravirine/Intelence™, require formulation designs involving solid dispersion methodology to improve its intrinsically low oral bioavailability,22 others, including 1, were shown to have good bioavailability in animal models and humans with minimal formulation designs. 16, 21, 23
Figure 1.

Surfactant-dependent drug aggregation in vitro and the 10% protonated aggregate model in silico. a. Molecular structure of 1 with wing I, wing II, and pyrimidine rings labeled as I, II, and P respectively. (*) denotes the preferred protonation site at the N(2) atom of the pyrimidine ring, as suggested by the small-molecule crystal structure of protonated compound 145. b. Hydrodynamic radius distribution as a function of solution pH for 0.1 mM 1 in the presence and the absence of 0.1% tyloxapol. c. The starting conformation of the 10% protonated model in a 60 × 60 × 60 Å cell. Color assignment: yellow – neutral compound 1; red – charged compound 1; green – chloride ion. SPC water molecules are not shown.
Based on observations in a standard cell culture assay and biophysical measurements in solutions simulating fasting gastric conditions, it has been proposed that some NNRTIs can form homogeneous populations of small (~100–120 nm diameter) drug aggregates that contain ~500,000–2,000,000 molecules per particle.21, 23 Oral bioavailability properties of the DAPY compounds were correlated with their lipophilicity, transepithelial transport, human exposure, and ability to form small drug aggregates at low pH and high drug concentration.23,21 Consequently, it was hypothesized that small drug aggregates were the biological units of delivery that formed at high drug concentrations in the stomach and were being further trafficked into lymphatic circulation by small intestine enterocytes via either paracellular or transcellular routes.23
Among currently known nanoparticulate structure types, we have reasons to believe that microemulsion is the most appropriate model to describe NNRTI drug aggregates. Microemulsions are isotropic, thermodynamically stable ternary or pseudoternary systems with 80–100 nm diameter particles, otherwise known as swollen micelles that consist of oil (hydrophobic phase), water (hydrophilic phase), surfactant (stabilizing agent), and frequently a cosolvent.24–27 Surfactants are known to lower the surface tension between two immiscible phases24–27 and to have specific structural characteristics such as charged or polar head groups and hydrophobic tails. In the case of some DAPY NNRTIs we hypothesize that under acidic conditions, protonated drug molecules have surfactant-like features with the protonated pyrimidine ring being a head group and the diaryl wings composing the hydrophobic tail. We propose that those NNRTI DAPY compounds that can exhibit surfactant-like properties upon protonation can facilitate microemulsion-like aggregate formation.
Here, we examine compound 1 behavior at the water/aggregate interface using all-atom molecular dynamics (MD) simulations. A number of computational studies have been targeted at water/vapor interfaces28 and microemulsions such as simulations of single or multiple surfactant molecules in explicit solvent,29 coarse-grained simulations using self-consistent field theory,30 and dissipative particle dynamics (DPD) based on nuclei formation and growth via coalescence-exchange or coagulation of water-in-oil drops for simulation of microemulsions, micelles, etc.31, 32 However, all-atom simulations of aggregate systems consisting of a half million molecules or more is not currently feasible. Therefore, we have devised a computational approach to study the surface dynamics of amolecule-sized aggregate rather than the full nm-sized aggregates. In the present study, we monitor pH-dependent aggregate surface formation with the goal to evaluate the behavior of protonated and neutral drug molecules in terms of their potential surfactant- like behavior.
Materials and Methods
Dynamic light scattering (DLS)
Data collection and sample preparation were performed according to an earlier described method published in Frenkel et al. 2005 23. Data collection was executed using a DynaPro MS800 at 25°C. Each measurement consisted of 20 independent 10 second readings (repeated in triplicate). Data processing was done using DYNAMICS V6.7.60 software. Stock solutions of 1 were prepared by dissolving dry compound (>99% pure w/w, verified by reverse-phase chromatography) in 100% DMSO to a final drug concentration of 20 mM, filtered with a 0.22 μm MillexGV sterile filter, and stored at −80°C. Experimental samples were prepared by addition of a 20 mM stock solution of 1 to buffer at 1:199 volume ratio followed by vortexing for 10 seconds. Buffer solutions were designed to mimic GI conditions of a fasting individual and spanned the pH range from 1.5 to 6.5. Buffers used in the study included the following: 1) 0.15 M HCl pH 1.5; 2) 20 mM malonate buffer pH 2.5 through 4.5; 3) 50 mM malonate buffer pH 5.5 and 6.5; 4) 20 mM malonate buffer pH 2.5 through 4.5 with 0.1% tyloxapol; and 5) 50 mM malonate buffer pH 5.5 and 6.5 with 0.1% tyloxapol.
Malonate buffers were prepared using malonic acid and sodium malonate solutions (J.T. Baker, Inc.). Tyloxapol(Sigma-Aldrich), a nonionic surfactant from the Triton group, was used to evaluate detergent-dependent aggregation behavior of 1. Tyloxapolmicelles with characteristic 3.5 nm hydrodynamic radii46 were observed by DLS in control solutions and were clearly distinguished in experimental conditions from drug containing aggregate populations. Compound 1 was kindly provided by Janssen Pharmaceutica NV (Beerse, Belgium).
Molecular Simulations
The five models we have investigated differ in the fraction of protonated compound 1 molecules that was varied from zero to ninety percent (see Table 1). The starting aggregate models were generated using small-molecule crystal structure coordinates of 1 in an anhydrous crystal form.45 One hundred molecules of 1 were packed in the lattice according to the P21/c space group symmetry of the crystals with final microcrystalline dimensions of approximately 35 × 35 × 45 Å. These models were inserted using the Maestro Program (Schrodinger, LLC) into pre-equilibrated simulation cells of 60 × 60 × 60 Å containing pre-equilibrated water system (SPC water model). Water molecules which overlapped with the solutes were removed. In the resulting model at least two layers of water molecules surrounding the generated drug crystals (see details in Table 1 and Figure 2). Depending on the model, a fraction of compound 1 molecules in the microcrystal were protonated at the N(2) atom of the molecule. The preferred protonation site at N(2) atom of the molecule was indicated by a recently obtained small-molecule crystal structure of protonated compound 1.45 Initial placement of protonated compound 1 molecules was performed in such a way to uniformly cover the surface of the microcrystal. If protonated drug molecules were present in the simulation, an equivalent number of chloride ions were included in the simulation to mirror observed solvent content in the small-molecule structure of the protonated compound 1 (Figure 2).
Table 1.
Composition and analysis of the results of the computational models of compound 1 aggregates.
| 0% | 10% | 30% | 60% | 90% | |
|---|---|---|---|---|---|
| Computational Models | |||||
| Total # of Drug Molecules | 100 | 100 | 100 | 100 | 100 |
| # of Protonated Molecules | 0 | 10 | 30 | 60 | 90 |
| # of Cl− Atoms | 0 | 10 | 30 | 60 | 90 |
| # of Water Molecules | 5135 | 4783 | 4720 | 4582 | 4324 |
| Final Aggregate Composition a | |||||
| Nagg | 98 | 98 | 85 | 46 | 0 b |
| # of Surface Molecules | 48 | 48 | 49 | 36 | 0 b |
| # of Core Molecules | 50 | 50 | 36 | 10 | 0 b |
| # of Protonated Surface Molecules | 0 | 9 | 17 | 3 | 0 b |
| SASA (Å2) | 10610 | 11663 | 10728 | 6950 | 0 b |
| Surface Charge Density (e/nm2) | - | 0.008 | 0.016 | 0.004 | 0 b |
| U Conformation Populationsc | |||||
| Aggregate Core | 99.8 | 65.3 | 61.8 | - | - |
| Aggregate Surface, Neutral | 90.9 | 60.3 | 45.6 | - | - |
| Aggregate Surface, Protonated | - | 63.5 | 58.9 | - | - |
| Lτ3 Conformation Populations c | |||||
| Aggregate Core | 0.2 | 27.9 | 37.2 | - | - |
| Aggregate Surface, Neutral | 9.1 | 35.9 | 51.1 | - | - |
| Aggregate Surface, Protonated | - | 28.3 | 11.2 | - | - |
aggregate composition was determined using the solvation parameter Sm (see Methods for details)
not applicable due to lack of aggregation
fraction in percent
Figure 2.
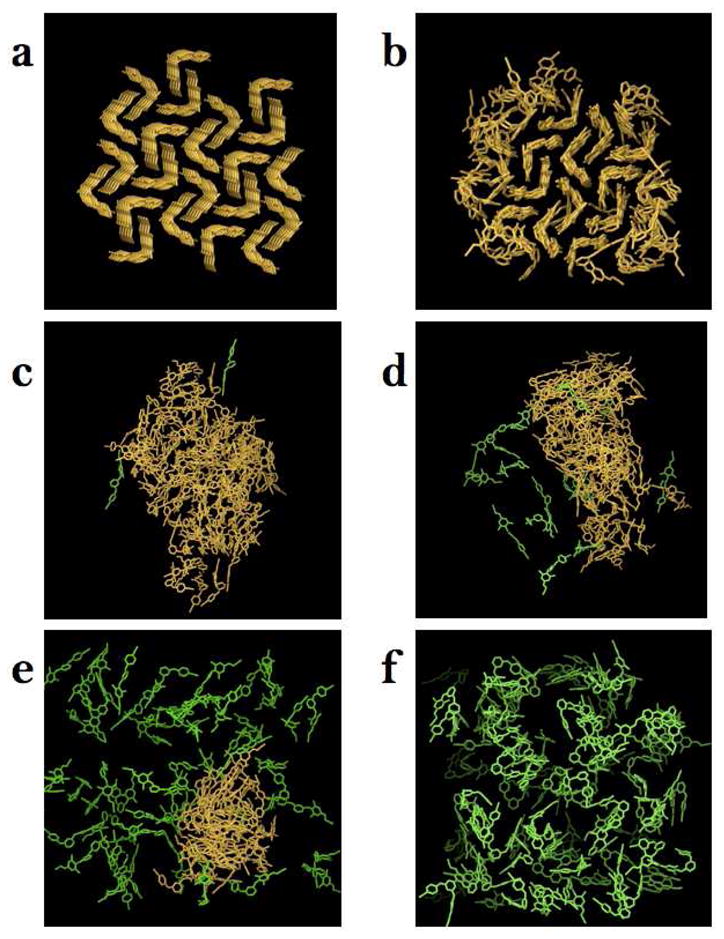
Snapshots of compound 1 aggregate structures extracted from the MD trajectories at various levels of protonation. a. Starting conformation of the 0% protonation model. b–f. Final conformations of the 0, 10, 30, 60, and 90% protonation models. Water molecules and counter ions are not shown. Color assignment: yellow – aggregated compound 1 molecules, green – dissociated compound 1 molecules (aggregate association is measured based on Sm parameter described in Methods.)
MD trajectories were obtained using the IMPACT molecular simulation program47 with the 2005 implementation of the OPLS-2005 force field48–53 (Schrodinger, LLC) under periodic boundary conditions and constant temperature and pressure at 298.15 K and 1 atm.47, 54 All covalent bonds were constrained using the SHAKE algorithm, with a relative tolerance of 10−7. The MD time-step was set to 2 fs. Full periodic boundary conditions were employed and the molecule-based truncation was set at 10 Å distance for non-bonded interactions. Models were equilibrated under constant isotropic pressure and minor changes to the volume were observed relative to the starting volume. Production runs were conducted at constant volume. The 60 and 90% protonated models were simulated for 7 ns and the 0, 10, and 30% protonated models for 9 ns. System coordinates were saved every 20 ps after a 2 ns initial system equilibration period. The resulting trajectories were analyzed using the Maestro program and associated utilities.
Aggregate cluster analysis
A molecule was considered part of the aggregate if it made significantly fewer water contacts than fully solvated molecules. To this end we computed for each molecule m in each MD snapshot a solvation parameter Sm defined as the number of water molecules within 4 Å radius of any atom of the molecule. We defined a fully buried molecule in the core of the aggregate as having Sm= 0. Sm values greater than 20 correspond to fully dissociated drug molecules; 9 < Sm < 20 correspond to molecules on the surface of an aggregate, and 0 < Sm < 10 correspond to molecules that compose the interface between the surface layer and the core of an aggregate (Table 1). The aggregate size is expressed in terms of average number of molecules in an aggregate (Nagg), and average number of surface, core, and charged molecules as reported in Table 1.
Aggregate surface characterization
MD trajectories were evaluated in terms of aggregate morphology, compound 1 torsional flexibility, aggregate packing, and drug molecule surface contribution as a function of drug location within an aggregate. Evaluation of aggregate morphology was done by visual inspection using the Maestro graphical interface in combination with solvent accessible surface area (SASA) estimation based on the periodic boundary-related contacts between models, if such were present, using a 1.4 Å radius probe.
In order to study behavior of 1 in the aggregate we have categorized observed conformations into four main groups based on rotations of five dihedral angles. Torsion angles, τ1 – τ5, were identified using previously established nomenclature (Figure 1a). Drug conformations withτ3 and τ4 less than 90° are called “U” conformations (Figure 4a) and had been previously observed in crystallographic structures of the drug in protein complexes (wild-type and mutant),15 as well as in the small-molecule crystal structures.45 Drug conformations with τ3 greater and τ4 less than 90° result in rotation of wing I relative to pyrimidine ring and are called “Lτ3”, while those with τ3 less and τ4 greater than 90°, where wing II is rotated relative to pyrimidine ring, are called “Lτ4“ (Figure 4a). The most torsionally flexed conformation of 1 is called “E,” for extended, and is characterized by τ3 and τ4 being greater than 90°, where both wings are rotated relative to pyrimidine (Figure 4a). The E conformation has been previously observed for a diaryltriazine analog of a DAPY NNRTI molecule, R120393, in complex with HIV-1 RT and in a small-molecule crystal structure and has been called a seahorse conformation.45, 55
Figure 4.
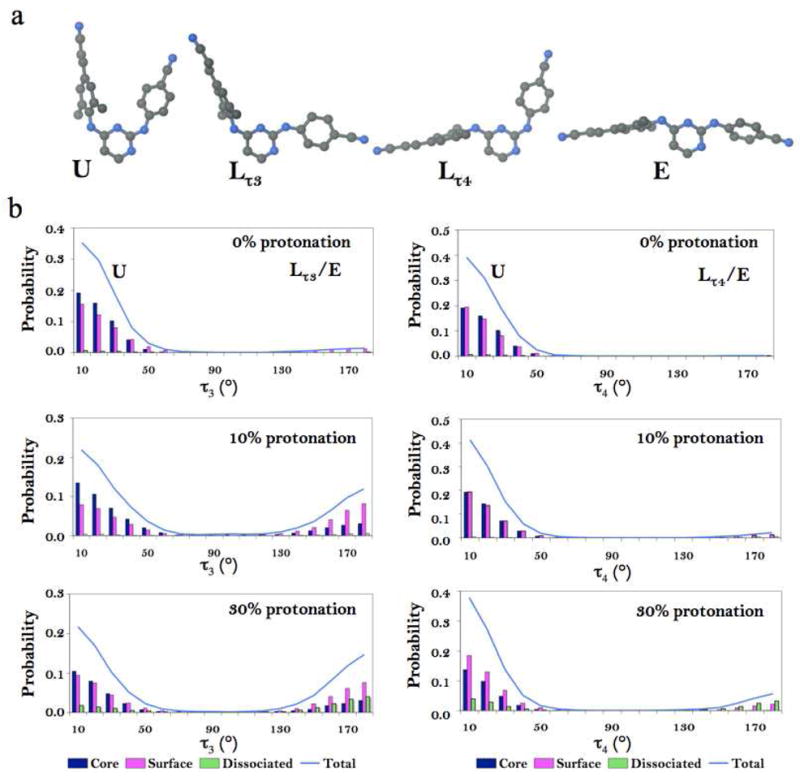
Compound 1 conformations and their occurrences in 0, 10, and 30% protonated model simulations. a. Representative conformations of 1 observed in simulation: U conformation (τ3 and τ4 values between −90° and 90°); Lτ3 conformation(−90° < τ4 < 90° and 90° < τ3 < −90°). Lτ4 conformation (−90° < τ3 <90° and 90° < τ4 > −90°). E conformation ( τ3 > 90°and τ4 < −90°). b. Probability distributions of compound 1 torsional angles τ3 (A) and τ4 (B) from the 0, 10, and 30% protonation models. Color assignment: light blue –all molecules in the simulation; dark blue – core molecules; magenta – surface molecules; green – dissociated molecules.
The packing of the molecules in an aggregate was evaluated using ring-to-ring distance distribution analysis for 0, 10, and 30% models based on the distances between the centers of mass for selected ring pairs, sampling distances within a 10 Å radius. Both intra- and intermolecular ring-to-ring distances were calculated. Based on stacking interactions of the crystal packing observed in the anhydrous crystalline structure of 1, we selected ring pairs for monitoring disruption of crystal packing as a function of protonation (Figure 3, 5). Distances of 3.5 +/− 0.5 Å correspond to intermolecular stacking interactions between wing I and wing II; and the symmetry-related wing II rings in the compound 1 crystal packing.
Figure 3.

Intermolecular ring-to-ring distance distributions for the 0, 10, and 30% protonation models. a. 0%; b. 10%; c. 30%. d. Ring-to-ring distance distribution functions for the core compound 1 molecules and surface compound 1 molecules from the 0% protonation model. Color assignment: red – distances between ring I and ring II; green – distances between ring II and ring II; blue – distances between ring II and pyrimidine ring.
Figure 5.

Compound 1 surface contribution analysis and summary. a. Compound 1 atomic average solvent-accessible surface contributions computed from the 0, 10, and 30% protonation model MD trajectories. b. Schematic diagram summarizing the observed preferred conformations and corresponding location (core and surface) in the aggregate. The diagram shows, starting from the left, a protonated molecule at the surface of the aggregate, a neutral molecule in the core of the aggregate, and a neutral molecule at the surface of the aggregate. Color assignment is based on normalized SASA values ranging from minimum (blue) to maximum (red) hydration.
The contribution of each atom to the aggregate SASA was computed with SURFV software using a 1.4 Å rolling probe 56, 57. Per atom surface contributions were normalized against the maximum SASA (mSASA) of an atom based on its most solvent exposed compound 1 conformation. Average SASA and number of surface charged molecules were used to estimate average aggregate surface charge density, reported in Table 1. Figure 5 pertain results of the hydration analysis, where the color gradient ranging from dark blue corresponds to small percent contributions to the surface and red (highest solvation) is used to accent the least and the most hydrated atoms of the molecules contributing to aggregate surface.
Results
Solution studies
Based on the earlier reported solution study of pH-dependent aggregation behavior for compounds with good oral bioavailability,23 we hypothesized that DAPY NNRTIs exhibit surface-active properties under conditions of low pH and therefore are able to form aggregates in a surfactant-independent fashion. Previous results indicated that 1 forms spherical nanostructures with average radii ~60 nm in aqueous solution in the presence and in the absence of a surface-active agent at pH 1.5.
To answer the question of whether or not the aggregation tendencies of the drug depend on the presence of a stabilizing agent at higher pH conditions, we conducted a series of DLS experiments in the presence and absence of the surfactant. These studies show that 1 is able to display surface activity only at low pH. We monitored the aggregation of 0.1 mM drug solutions in the presence and absence of the surfactant tyloxapol (Figure 1b). As shown in Figure 1b, the average size of compound 1 aggregates in aqueous solutions tends to increase with increase in pH. At the most acidic conditions (pH 1.5), slightly larger aggregates were observed in the presence of tyloxapol (average drug aggregate radius 52.5 ± 6.8 nm) than in its absence (35.5 ± 17.7 nm). This trend consistently continues in the pH range from 2.5 to 3.5, where in the presence of tyloxapol the average aggregate size was greater by ~20 nm than in the tyloxapol-free solutions. At pH 4.5, the trend observed at lower pH was reversed and smaller aggregate size was observed for samples with tyloxapol (112.5 ± 14.5 nm) versus without (198.5 ± 20.0 nm). Formation of the homogeneous aggregate population at higher pH values was not observed and is best characterized as a precipitate.
Based on these observations, we conclude that compound 1 aggregation does not depend on the presence of added surfactant only at low pH conditions. Based on the compound 1 pKa of 5.6 and observed in vitro aggregation tendencies, we hypothesize that surface-active agent responsible for the formation of the aggregates in the absence of tyloxapol is the protonated (positively charged) form of 1. The tendency towards larger aggregates with increasing pH is thus rationalized in terms of the decrease of the fraction of surface active protonated 1 molecules. To understand further the effect of protonation on the drug aggregate assembly processes in aqueous environments we conducted a series of MD simulations to further probe the protonation-dependent behavior of the drug.
Computational studies of drug aggregates
To validate the hypothesis stated above and to unambiguously investigate the pH-dependent aggregation properties of 1, we have formulated minimalist models of solutions containing only water, compound 1 molecules (of which 0 to 90% were charged), and sufficient chloride ions to neutralize the system (Table 1, Figure 1c). By design, the drug concentration in aggregate models exceeds that of the in vitro conditions, yet is believed to be reasonable for studies of aggregate morphology, aggregate packing, conformational variability of drug molecules, and their surface presentation. Morphology, charge distribution, and packing analysis suggest that drug aggregate structure is pH dependent and biphasic with a partially neutral core and a more disordered and partially charged surface.
Visual inspection of the aggregate morphology during the MD simulations of the compound 1/water systems at the increasing level of protonation indicates that aggregate formation is a pH-dependent phenomenon. The original cubic shape of the starting microcrystal (Figure 2a) is lost for all but the model without protonated 1 molecules (0% protonation). The models with 10 and 30% protonated compound 1 molecules produce a continuous aggregate phase while those with 60 and 90% protonation results in either partially or fully dissociated solutions. As reported in Figure 2 and Table 1, the 0, 10, and 30% protonated models yield structures with similar Nagg and SASA, whereas, the 60% and 90% protonated models produced structures with significantly smaller Nagg and SASA values and therefore were not used in quantitative comparison analysis.
Molecular composition analysis of the aggregates reported in Table 1 indicates that charge saturation of the aggregate surface is reached at under 30% protonation. While the number of drug molecules making up the surface of the aggregates in the 10 and 30% protonated models is similar (48 and 49 molecules, respectively) the corresponding number of charged molecules at the surface are different (9 and 17, respectively). Consequently we observe that a three-fold increase in number of charged molecules (from 10 to 30%) is accompanied by only a two-fold increase in the surface charge density, from 0.008 to 0.016 charge/nm 2 respectively. The non-linear trend in surface charge distribution suggests that system reaches surface charge saturation at under 30% protonation. Furthermore, full dissolution of the aggregate at 90% protonation (Figure 2f) after only two nanoseconds of MD simulation suggests that under sufficiently acidic conditions aggregate formation would be inhibited.
Visual examination and quantitative packing analysis of the structures obtained from the simulations indicate that the aggregates tend to assume biphasic structures. The structures of the aggregates obtained at 0% protonation represent extreme examples of this phenomenon. In Figure 2b, we see that the aggregate displays two clearly distinguishable layers, one of which has retained the starting crystalline packing and the other, at the water interface, is partially disordered. Interestingly, such clear differentiation is present only at 0% protonation. Even at only 10% protonation (Figure 2c), the core of the aggregate does not display crystalline ordering.
Our results suggest that protonated 1 molecules tend to induce a liquid-like disorder at the water/aggregate interface that in turn induces disorder in the core of the aggregates. The water/aggregate interface of the 10% and 30% protonated models is populated preferentially by protonated molecules and displays greater disordered than the interface of the 0% model. The natural implication of this observation is that crystalline-like ordering would be more prevalent in regions deep in the aggregate core distant from the surface layer if larger number of drug molecules would be employed in atomistic simulations. This hypothesis is strengthened by the resiliency displayed by the crystalline-like ordered phase at 0% protonation, which, unlike at higher level of protonation, remained stable for the entire duration of the simulation. In conclusion, although the modeling design employed here is not intended for studying the core structure of the aggregates, the present in silico results indicate that the nm-sized aggregates of 1 we observed in vitro likely contain cores largely unaffected by the specific solution pH conditions, which are instead predicted to have a marked effect on the structure of the water/aggregate interface.
Ring-to-ring distance distribution analysis of the MD trajectories confirms that compound 1 molecules form a liquid-like layer at the water/aggregate interface while the core molecules of the 0% model preserve the crystalline arrangement. Distance analysis shows that stacking interactions characteristic of crystal packing are primarily present only in the 0% protonated model and are sampled to a lesser extent in the higher protonation systems (Figure 3a–b). Stacking between wing II and the pyrimidine ring is clearly present in all simulations and is hypothesized to be relevant to the drug aggregate surface structure at the water interface. Analysis of ring-to-ring distance distributions at 0% protonation for core and surface molecules confirms that the internal structure of the aggregate displays crystal ordering while the surface is more disordered or liquid-like (Figure 3d).
Surface properties of drug aggregate models
Conformational and surface area analysis of compound 1 molecules at the aggregate- water interface suggests that torsional flexibility allows 1 to adopt surfactant-like orientations by exposing preferentially their “polar head” and burying their “hydrophobic tail”. We have categorized observed drug conformations in MD trajectories into four main groups: U, L τ3, Lτ4, and E (see Methods for details, Figure 1, 6). The probability distributions for the τ3 and τ4 dihedral angles for core, surface, and dissociated molecules (Figure 4b) consistently indicate that the occurrence of partially and/or fully extended compound 1 conformations (Lτ3, Lτ4, and E) correlates with a higher fraction of protonated drug molecules in the system. U conformations are predominant in the core of the aggregates in all simulations. Neutral compound 1 molecules at the surface in 10 and 30% protonated models show preference for Lτ3 conformations (35.9 and 51.1% probability, respectively, see Table 1), while protonated compound 1 molecules at the surface of the aggregates prefer the U conformation with probability of 63.5 and 58.9%, respectively. Therefore, we conclude that protonated 1 molecules disfavor sampling of the Lτ3/Lτ4/E conformations while neutral molecules observe multiple forms. These observations highlight differences between the behavior of neutral and charged molecules on the aggregate surface.
In addition to looking at the drug aggregate packing motifs and conformational preferences, we also evaluated the makeup of the aggregate surface in terms of individual compound 1 atoms. Atom hydration analysis based on average normalized SASA of each heavy atom (see Methods, Figure 5a) show, as expected, that core molecules of 1 contribute little to the aggregate surface; however those core molecules that present atoms at the surface tend to display either cyano groups or pyrimidine rings. On the other hand, surface molecules, both neutral and protonated, prefer to expose wing II and pyrimidine rings. Hydration of neutral molecules at the surface is fairly uniform (Figure 5a) with preferences towards exposure of the pyrimidine ring for the 0% model and the cyano group in the 30% model. Charged surface molecules preferentially expose their pyrimidine rings at the surface of the aggregate with greatest hydration of the C(3) atom, shown in red (Figure 5a). Based on these results we conclude that the contribution of core molecules to the surface is largely limited to cyano groups while surface molecules mostly display cyano groups, wing II and pyrimidine rings. These findings agree with modes of binding determined in structural studies of RT/compound 1 complexes, where it has been observed that the cyanovinyl group of the molecule is oriented towards the solvent through a hydrophobic tunnel while the pyrimidine ring is partially exposed to the solvent region and hydrophilic residues on the other side of the binding pocket. 15
Taken together, these observations suggest that molecules of 1 can exhibit different conformational preferences based on their environment. In Figure 5b we summarize our conclusions concerning the orientations of the compound 1 molecules at the water/aggregate interface. Core molecules in the aggregate preferred the U conformations while neutral, surface molecules sampled multiple conformations with preference towards Lτ3 conformations that allows for surface exposure of both, pyrimidine ring and cyano groups. Protonated 1 molecules assumed mostly the U conformations preferentially exposing the charged pyrimidine ring while burying the mostly hydrophobic wings.
Discussion and Conclusions
Pharmacokinetic and biophysical studies of 1 suggest that one possible explanation for the exceptional oral bioavailability properties of the drug lies with its ability to form ~100–120 nm diameter, self-formulating NNRTI aggregates and their subsequent uptake into systemiccirculation.21,23 We hypothesized that formation of the monodispersed aggregate populations is a product of the intrinsic properties of the compound 1 molecule. We proposed that aggregates of 1, by size and morphology, resemble large micellar structures and/or microemulsions that are formed in the absence of conventional surfactants. Therefore, we hypothesized that the drug molecule is able to display surfactant-like properties under physiologically relevant conditions facilitating micelle or microemulsion-like formation without the aid of added surfactants. The computational studies reported here support our hypothesis and suggest that under acidic conditions, protonation of 1 changes its behavior towards a more surface active molecule with clear preference toward exposure of hydrophilic portion of the molecule and burring of the hydrophobic groups. The computer simulations also show a clear change in the aggregate size and shape and a transition from solid-like to liquid-like phase with increasing number of charged species in the simulations. The models also suggest that under solutions conditions of the simulation, the aggregates form a microemulsion-like phase with a partially disordered internal structure.10, 27 The structural flexibility and the head group size of the surfactant molecules are known to be fundamentally important for micelle and interfacial surface formation.33–36 Smaller size, higher flexibility, and small electrostatic repulsions produce larger micelle structures and/or tighter surfactant molecule packing at the oil/water interface.10, 27, 33, 35 We believe that intrinsic flexibility of the compound 1 molecule, accompanied by its ability to assume amphiphilic properties under protonated conditions, similarly allows for more advantageous packing of drug molecules at the water/aggregate interface.
Aggregation at physiologically relevant conditions has been observed for many drugs and drug candidates, however, good bioavailability properties are not as frequently observed for these molecules. In the series of studies reported by Seidler, McGovern, Feng, and other colleagues in the Schoichet group, formation of aggregate structures by drug and drug-like molecules has been correlated with promiscuous enzyme inhibition37–41 and false positive results in HTS screening for drug leads.42, 43 In the recently published work by Coan et al. the drug aggregate composition is also compared to that of micelles.44 Using the drug concentration measurements and monomer-to-aggregate volume ratio calculations, the authors concluded that drug aggregates were densely packed. These findings support our hypothesis of micelle-like drug aggregate formation and justify the close packing of the drug aggregates observed in our simulations. Our results also suggest that mechanism of aggregate formation might be shared between promiscuous aggregators and molecules discussed in our work. While many drug molecules might form aggregate structures, we speculate that only those that are able to form these structures in a surfactant-independent fashion under physiologically relevant conditions might be able to follow absorption pathways associated with improved oral bioavailability. Conversely, we believe that drug or drug candidate molecules unable to display amphiphilic properties under physiologically relevant conditions, would tend to be less capable of forming stable, homogeneous populations of nanosize aggregates.
Acknowledgments
The authors are grateful to Paul Lewi, Larry Romsted, Edward Castner, and other members of our research groups for helpful comments and discussion. E.A. is grateful to NIH MERIT Award R37 AI 27690 for support of this work and Y.V.F. was supported by NIH Interdisciplinary Research Workforce fellowship 5 T90 DK070135. The computer simulations for this work have been performed at the BioMaPS High Performance Computing Center at Rutgers University funded in part by the NIH shared instrumentation grant no. 1 S10 RR022375.
Footnotes
Abbreviations: NNRTI, non-nucleoside reverse transcriptase inhibitor; NCE, new chemical entity; HTS, high throughput screening; BCS, biopharmaceutics classification system; SEDDS, self-emulsifying drug delivery system; SMEDDS, self-microemulsifying drug delivery system; RT, reverse transcriptase; DAPY, diarylpyrimidine; MD, molecular dynamics; DLS, dynamic light scattering; DPD, dissipative particle dynamics; SPC, simple point charge; Nagg, number of molecules in an aggregate; Sm, molecule based solvation parameter; SASA, solvent-accessible surface area; mSASA, maximum solvent-accessible surface area.
References
- 1.Stegemann S, Leveiller F, Franchi D, de Jong H, Linden H. When poor solubility becomes an issue: from early stage to proof of concept. Eur J Pharm Sci. 2007;31:249–261. doi: 10.1016/j.ejps.2007.05.110. [DOI] [PubMed] [Google Scholar]
- 2.Amidon GL, Lennernas H, Shah VP, Crison JR. A theoretical basis for a biopharmaceutic drug classification: the correlation of in vitro drug product dissolution and in vivo bioavailability. Pharm Res. 1995;12:413–420. doi: 10.1023/a:1016212804288. [DOI] [PubMed] [Google Scholar]
- 3.Serajuddin AT. Salt formation to improve drug solubility. Adv Drug Deliv Rev. 2007;59:603–616. doi: 10.1016/j.addr.2007.05.010. [DOI] [PubMed] [Google Scholar]
- 4.Rautio J, Kumpulainen H, Heimbach T, Oliyai R, Oh D, Jarvinen T, Savolainen J. Prodrugs: design and clinical applications. Nat Rev Drug Discov. 2008;7:255–270. doi: 10.1038/nrd2468. [DOI] [PubMed] [Google Scholar]
- 5.Serajuddin AT. Solid dispersion of poorly water-soluble drugs: early promises, subsequent problems, and recent breakthroughs. J Pharm Sci. 1999;88:1058–1066. doi: 10.1021/js980403l. [DOI] [PubMed] [Google Scholar]
- 6.Pouton CW. Formulation of poorly water-soluble drugs for oral administration: physicochemical and physiological issues and the lipid formulation classification system. Eur J Pharm Sci. 2006;29:278–287. doi: 10.1016/j.ejps.2006.04.016. [DOI] [PubMed] [Google Scholar]
- 7.Gershanik T, Benita S. Self-dispersing lipid formulations for improving oral absorption of lipophilic drugs. Eur J Pharm Biopharm. 2000;50:179–188. doi: 10.1016/s0939-6411(00)00089-8. [DOI] [PubMed] [Google Scholar]
- 8.Gursoy RN, Benita S. Self-emulsifying drug delivery systems(SEDDS) for improved oral delivery of lipophilic drugs. Biomed Pharmacother. 2004;58:173–182. doi: 10.1016/j.biopha.2004.02.001. [DOI] [PubMed] [Google Scholar]
- 9.Pouton CW. Lipid formulations for oral administration of drugs: non-emulsifying, self-emulsifying and ‘self-microemulsifying’ drug delivery systems. Eur J Pharm Sci. 2000;11 (Suppl 2):S93–S98. doi: 10.1016/s0928-0987(00)00167-6. [DOI] [PubMed] [Google Scholar]
- 10.Narang AS, Delmarre D, Gao D. Stable drug encapsulation in micelles and microemulsions. Int J Pharm. 2007;345:9–25. doi: 10.1016/j.ijpharm.2007.08.057. [DOI] [PubMed] [Google Scholar]
- 11.Porter CJ, Pouton CW, Cuine JF, Charman WN. Enhancing intestinal drug solubilisation using lipid-based delivery systems. Adv Drug Deliv Rev. 2008;60:673–691. doi: 10.1016/j.addr.2007.10.014. [DOI] [PubMed] [Google Scholar]
- 12.Vasconcelos T, Sarmento B, Costa P. Solid dispersions as strategy to improveoral bioavailability of poor water soluble drugs. Drug Discov Today. 2007;12:1068–1075. doi: 10.1016/j.drudis.2007.09.005. [DOI] [PubMed] [Google Scholar]
- 13.Kipp JE. The role of solid nanoparticle technology in the parenteral delivery of poorly water-soluble drugs. Int J Pharm. 2004;284:109–122. doi: 10.1016/j.ijpharm.2004.07.019. [DOI] [PubMed] [Google Scholar]
- 14.O’Driscoll CM, Griffin BT. Biopharmaceutical challenges associated with drugs with low aqueous solubility--the potential impact of lipid-based formulations. Adv Drug Deliv Rev. 2008;60:617–624. doi: 10.1016/j.addr.2007.10.012. [DOI] [PubMed] [Google Scholar]
- 15.Das K, Bauman JD, Clark AD, Jr, Frenkel YV, Lewi PJ, Shatkin AJ, Hughes SH, Arnold E. High-resolution structures of HIV-1 reverse transcriptase/TMC278 complexes: strategic flexibility explains potency against resistance mutations. Proc Natl Acad Sci U S A. 2008;105:1466–1471. doi: 10.1073/pnas.0711209105. [DOI] [PMC free article] [PubMed] [Google Scholar]
- 16.Janssen PAJ, Lewi P, Arnold E, Daeyaert F, de Jonge M, Heeres J, Koymans L, Vinkers HM, Guillemont J, Pasquier E, Kukla MJ, Ludovici DW, Andries K, de Bethune MP, Pauwels R, Das K, Clark A, Frenkel YV, Hughes SH, Medaer B, De Knaep F, Bohets H, De Clerck F, Lampo A, Williams P, Stoffels P. In search of a novel anti-HIV drug: Multidisciplinary coordination in the discovery of 4-[[4-[[4-[(1E)-2-cyanoethenyl]-2,6-dimethylphenyl]amino]-2-pyrimidinyl]amino]benzonitrile (R278474, Rilpivirine) J Med Chem. 2005:1901–1909. doi: 10.1021/jm040840e. [DOI] [PubMed] [Google Scholar]
- 17.Ludovici DW, De Corte BL, Kukla MJ, Ye H, Ho CY, Lichtenstein MA, Kavash RW, Andries K, de Bethune MP, Azijn H, Pauwels R, Lewi PJ, Heeres J, Koymans LM, de Jonge MR, Van Aken KJ, Daeyaert FF, Das K, Arnold E, Janssen PA. Evolution of anti-HIV drug candidates. Part 3: Diarylpyrimidine (DAPY) analogues. Bioorg Med Chem Lett. 2001;11:2235–2239. doi: 10.1016/s0960-894x(01)00412-7. [DOI] [PubMed] [Google Scholar]
- 18.Ludovici DW, Kukla MJ, Grous PG, Krishnan S, Andries K, de Bethune MP, Azijn H, Pauwels R, De Clercq E, Arnold E, Janssen PA. Evolution of anti-HIV drug candidates. Part 1: From alpha-anilinophenylacetamide (alpha-APA) to imidoyl thiourea (ITU) Bioorg Med Chem Lett. 2001;11:2225–2228. doi: 10.1016/s0960-894x(01)00410-3. [DOI] [PubMed] [Google Scholar]
- 19.Das K, Clark AD, Jr, Lewi PJ, Heeres J, de Jonge MR, Koymans LM, Vinkers HM, Daeyaert F, Ludovici DW, Kukla MJ, De Corte B, Kavash RW, Ho CY, Ye H, Lichtenstein MA, Andries K, Pauwels R, de Bethune MP, Boyer PL, Clark P, Hughes SH, Janssen PAJ, Arnold E. Roles of conformational and positional adaptability in structure-based design of TMC125- R165335 (etravirine) and related non-nucleoside reverse transcriptase inhibitors that are highly potent and effective against wild-type and drug-resistant HIV-1 variants. J Med Chem. 2004;47:2550–2560. doi: 10.1021/jm030558s. [DOI] [PubMed] [Google Scholar]
- 20.Lewi PJ, de Jonge M, Daeyaert F, Koymans L, Vinkers M, Heeres J, Janssen PA, Arnold E, Das K, Clark AD, Jr, Hughes SH, Boyer PL, de Bethune MP, Pauwels R, Andries K, Kukla M, Ludovici D, De Corte B, Kavash R, Ho C. On the detection of multiple-binding modes of ligands to proteins, from biological, structural, and modeling data. J Comput Aided Mol Des. 2003;17:129–134. doi: 10.1023/a:1025313705564. [DOI] [PubMed] [Google Scholar]
- 21.Lewi P, Arnold E, Andries K, Bohets H, Borghys H, Clark A, Daeyaert F, Das K, de Bethune MP, de Jonge M, Heeres J, Koymans L, Leempoels J, Peeters J, Timmerman P, Van den Broeck W, Vanhoutte F, Van’t Klooster G, Vinkers M, Volovik Y, Janssen PA. Correlations between factors determining the pharmacokinetics and antiviral activity of HIV-1 non-nucleoside reverse transcriptase inhibitors of the diaryltriazine and diarylpyrimidine classes of compounds. Drug R D. 2004;5:245–257. doi: 10.2165/00126839-200405050-00001. [DOI] [PubMed] [Google Scholar]
- 22.Kiekens FRI, Voorspoels JFM, Baert LEC. Process for preparing spray dried formulation of TMC125. World Intellectual Property Organization; 2007. [Google Scholar]
- 23.Frenkel YV, Clark AD, Jr, Das K, Wang YH, Lewi PJ, Janssen PA, Arnold E. Concentration and pH dependent aggregation of hydrophobic drug molecules nad relevance to oral bioavailability. J Med Chem. 2005;48:1974–1983. doi: 10.1021/jm049439i. [DOI] [PubMed] [Google Scholar]
- 24.Tsujii K. Surface activity: principles, phenomena, and applications. 1997 [Google Scholar]
- 25.Rosen MJ. Surfactants and interfacial phenomena. 2. 1989. [Google Scholar]
- 26.Eicke HF, Parfitt GD. Interfacial phenomena in apolar media. Surfactant Science Series. 1987;21:140–160. [Google Scholar]
- 27.de Gennes PG, Taupin C. Microemulsions and the Flexibility of Oil/Water Interfaces. J Phys Chem. 1982;86:2294–2304. [Google Scholar]
- 28.Chen L. Area dependence of the surface tension of a Lennard-Jones fluid from molecular dynamics simulations. J Chem Phys. 1995;103:10214–10216. [Google Scholar]
- 29.Derecskei B, Derecskei-Kovacs A, Schelly ZA. Atomic-level molecular modeling of AOT reverse micelles.1. The AOT molecule in water and carbon tetrachloride. Langmuir. 1999;15:1981–1992. [Google Scholar]
- 30.Fraaije JGEM, van Vlimmeren BAC, Maurits NM, Postma M. The dynamic mean-field density function method and its application to the mesoscopic dynamics of quenched block copolymer melts. J Chem Phys. 1997;106:4260–4269. [Google Scholar]
- 31.Chen Z, Cheng X, Haishi C, Cheng P, Wang H. Dissipative particle dynamics simulation of the phase behavior and microstructure of CTAB/octane/1-butanol/water microemulsion. Colloid Surf A: Physicochem Eng Aspects. 2007;301:437–443. [Google Scholar]
- 32.Ryjkina E, Kuhn H, Rehage H, Muller F, Peggau J. Molecular dynamic computer simulations of phase behavior of non-ionic surfactants. Anew Chem Int Ed Engl. 2002;41:983–986. doi: 10.1002/1521-3773(20020315)41:6<983::aid-anie983>3.0.co;2-y. [DOI] [PubMed] [Google Scholar]
- 33.Ambade AV, Aathimanikandan SV, van der Poll D, Thayumanavan S. Smaller building blocks form larger assemblies: aggregation behavior of biaryl-based dendritic facial amphiphiles. J Org Chem. 2007;72:8167–8174. doi: 10.1021/jo070447r. [DOI] [PMC free article] [PubMed] [Google Scholar]
- 34.Bhattacharya S, Haldar J. Thermodynamics of micellization of multiheaded single-chain cationic surfactants. Langmuir. 2004;20:7940–7947. doi: 10.1021/la0495433. [DOI] [PubMed] [Google Scholar]
- 35.Haldar J, Aswal VK, Goyal PS, Bhattacharya S. Unusual micellar properties of multiheaded cationic surfactants in the presence of strong charge neutralizing salts. J Colloid Interface Sci. 2005;282:156–161. doi: 10.1016/j.jcis.2004.08.145. [DOI] [PubMed] [Google Scholar]
- 36.Schlossman ML, Tikhonov AM. Molecular ordering and phase behavior of surfactants at water-oil interfaces as probed by X-ray surface scattering. Annu Rev Phys Chem. 2008;59:153–177. doi: 10.1146/annurev.physchem.59.032607.093822. [DOI] [PubMed] [Google Scholar]
- 37.Seidler J, McGovern SL, Doman TN, Shoichet BK. Identification and prediction of promiscuous aggregating inhibitors among known drugs. J Med Chem. 2003;46:4477–4486. doi: 10.1021/jm030191r. [DOI] [PubMed] [Google Scholar]
- 38.McGovern SL, Helfand BT, Feng B, Shoichet BK. A specific mechanism of nonspecific inhibition. J Med Chem. 2003;46:4265–4272. doi: 10.1021/jm030266r. [DOI] [PubMed] [Google Scholar]
- 39.McGovern SL, Caselli E, Grigorieff N, Shoichet BK. A common mechanism underlying promiscuous inhibitors from virtual and high-throughput screening. J Med Chem. 2002;45:1712–1722. doi: 10.1021/jm010533y. [DOI] [PubMed] [Google Scholar]
- 40.Feng BY, Shoichet BK. A detergent-based assay for the detection of promiscuous inhibitors. Nat Protoc. 2006;1:550–553. doi: 10.1038/nprot.2006.77. [DOI] [PMC free article] [PubMed] [Google Scholar]
- 41.Feng BY, Shelat A, Doman TN, Guy RK, Shoichet BK. High- throughput assays for promiscuous inhibitors. Nat Chem Biol. 2005;1:146–148. doi: 10.1038/nchembio718. [DOI] [PubMed] [Google Scholar]
- 42.Shoichet BK. Screening in a spirit haunted world. Drug Discov Today. 2006;11:607–615. doi: 10.1016/j.drudis.2006.05.014. [DOI] [PMC free article] [PubMed] [Google Scholar]
- 43.Shoichet BK. Virtual screening of chemical libraries. Nature. 2004;432:862–865. doi: 10.1038/nature03197. [DOI] [PMC free article] [PubMed] [Google Scholar]
- 44.Coan KED, Shoichet BK. Stoichiometry and physical chemistry of promiscuous aggregate-based inhibitors. J Am Chem Soc. 2008;130:9606–9612. doi: 10.1021/ja802977h. [DOI] [PMC free article] [PubMed] [Google Scholar]
- 45.Frenkel YV, Das K, Emge T, Gallicchio E, Levy RJ, Arnold E. Small molecule crystal structures of TMC278 reveal the role of flexibility in free and bound states. In progress. [Google Scholar]
- 46.Regev O, Zana R. Aggregation Behavior of Tyloxapol, a Nonionic Surfactant Oligomer, in Aqueous Solution. J Colloid Interface Sci. 1999;210:8–17. doi: 10.1006/jcis.1998.5776. [DOI] [PubMed] [Google Scholar]
- 47.Banks JL, Beard HS, Cao Y, Cho AE, Damm W, Farid R, Felts AK, Halgren TA, Mainz DT, Maple JR, Murphy R, Philipp DM, Repasky MP, Zhang LY, Berne BJ, Friesner RA, Gallicchio E, Levy RM. Integrated Modeling Program, Applied Chemical Theory (IMPACT) J Comput Chem. 2005;26:1752–1780. doi: 10.1002/jcc.20292. [DOI] [PMC free article] [PubMed] [Google Scholar]
- 48.Banks JL, Kaminski GA, Zhou R, Mainz DT, Berne BJ, Friesner RA. Parametrizing a polarizable force field from ab initio data. I. The fluctuating point charge model. J Chem Phys. 1999;110:741–754. [Google Scholar]
- 49.Stern HA, Kaminski GA, Banks JL, Zhou R, Berne BJ, Friesner RA. Fluctuating charge, polarizable dipole, and combined models: parameterization from ab Initio quantum chemistry. J Phys Chem B. 1999;103:4730–4737. [Google Scholar]
- 50.Kaminski GA, Stern HA, Berne BJ, Friesner RA, Cao YX, Murphy RB, Zhou R, Halgren TA. Development of a polarizable force field for proteins via ab initio quantum chemistry: first generation model and gas phase tests. J Comput Chem. 2002;23:1515–1531. doi: 10.1002/jcc.10125. [DOI] [PMC free article] [PubMed] [Google Scholar]
- 51.Kaminski GA, Stern HA, Berne BJ, Friesner RA. Development of an accurate and robust polarizable molecular mechanics force field from ab initio quantum chemistry. J Phys Chem A. 2004;108:621–627. [Google Scholar]
- 52.Maple JR, Cao YX, Damm W, Halgren TA, Kaminski GA, Zhang LY, Friesner RA. A polarizable force field and coninuum solvations methodology for modeling of protein-ligand interactions. J Chem Theory and Comput. 2005;1:694–715. doi: 10.1021/ct049855i. [DOI] [PubMed] [Google Scholar]
- 53.Stern HA, Rittner F, Berne BJ, Friesner RA. Combined fluctuating charge and polarizable dipole models: Application to a five-site water potential function. J Chem Phys. 2001;115:2237–2251. [Google Scholar]
- 54.Jorgensen WL, Maxwell DS, Tirado-Rives J. Development and testing of the OPLS all-atom force field on conformational energentics and properties of organic liquids. J Am Chem Soc. 1996;118:11225–11236. [Google Scholar]
- 55.Das K, Lewi PJ, Hughes SH, Arnold E. Crystallography and the design of anti-AIDS drugs: conformational flexibility and positional adaptability are important in the design of non-nucleoside HIV-1 reverse transcriptase inhibitors. Prog Biophys Mol Biol. 2005;88:209–231. doi: 10.1016/j.pbiomolbio.2004.07.001. [DOI] [PubMed] [Google Scholar]
- 56.Nicholls A, Sharp KA, Honig B. Protein folding and association: insights from the interfacial and thermodynamic properties of hydrocarbons. Proteins. 1991;11:281–296. doi: 10.1002/prot.340110407. [DOI] [PubMed] [Google Scholar]
- 57.Sridharan S, Nicholls A, Honig B. A new vertex algorithm to calculate solvent accessible surface areas. Biohys. 1992;61:A174. [Google Scholar]