Abstract
Experimental models that mimic the flow conditions in microcapillaries have suggested that the local shear stresses and shear rates can mediate tumor cell and leukocyte arrest on the endothelium and subsequent sustained adhesion. However, further investigation has been limited by the lack of experimental models that allow quantitative measurement of the hydrodynamic environment over adherent cells. The purpose of this study was to develop a system capable of acquiring quantitative flow profiles over adherent cells. By combining the techniques of side-view imaging and particle image velocimetry (PIV), an in vitro model was constructed that is capable of obtaining quantitative flow data over cells adhering to the endothelium. The velocity over an adherent leukocyte was measured and the shear rate was calculated under low and high upstream wall shear. The microcapillary channel was modeled using computational fluid dynamics (CFD) and the calculated velocity profiles over cells under the low and high shear rates were compared to experimental results. The drag force applied to each cell by the fluid was then computed. This system provides a means for future study of the forces underlying adhesion by permitting characterization of the local hydrodynamic conditions over adherent cells.
Keywords: shear stress, cell deformability, cell adhesion, in vitro flow assay
Introduction
Cell adhesion to the microvascular endothelium is one of the important initial steps in the extravasation of leukocytes in the inflammatory response and tumor cells in the metastasis process. The process of adhesion involves a complex balance of forces resulting from hydrodynamic shear forces and the adhesive bonds between the adhering cells and the endothelium. The roles of fluid shear stresses and cell deformation in cell adhesion and cell rolling have been studied extensively [1–6]. In vivo studies [2,7] of leukocyte-endothelial adhesion as well as computational fluid dynamics (CFD) studies [8–11] have found that the drag force on leukocytes adhering on the endothelium is affected by the incoming wall shear stress as well as the degree of deformation. The endothelial contact area of the leukocytes under adhesion in these studies was found to increase under periods of increasing shear forces, suggesting an increase in viable interactions among adhesion molecules. The computational models have also suggested that the effective drag forces acting on adhering cells is reduced following deformation, thus offering another enhancement of the ability of cells to maintain adhesion under shear flow as a result of deformation. Interestingly, the modeling studies by Liu et al. [3,12–14] have noted that deformation may increase as a result of changes in the Reynolds number with maximum deformation occurring at higher Reynolds numbers. Although the role of shear stress in flow has been analyzed extensively, little attention has been given to the role of shear rate and fluid viscosity in deformation. Increases in the Reynolds number within identical microvascular geometry reflects changes in the fluid velocity and shear rate as well as the viscosity [15]. Thus, it is possible to alter the Reynolds number while maintaining constant incoming shear forces.
A side-view flow chamber was developed by Dong et al. [16] to visualize cell surface adhesion and deformation in a microchannel. It consisted of two chromium plated 45 deg prisms that allowed cells to be visualized and studied in a fashion that is not possible with conventional parallel plate chambers. Among other applications, the side-view flow chamber has been used to measure the effects of flow on cell-surface adhesion strength and the cell-substrate contact interface [6,10].
Particle image velocimetry (PIV) is a quantitative field measurement technique that involves using laser illuminated tracer particles to visualize and quantify flow structure. Generally, for two-dimensional flow data, sets of two closely spaced frames are compared using a cross correlation algorithm that grids the total image field into many smaller “interrogation windows” of known area within which correlation functions are calculated. The maximum of the correlation function within a given interrogation window theoretically corresponds to the given displacement within the associated spatial region of tracer particles during the time delay between frame acquisitions. It is normally advantageous to have a high density of tracer particles so that accurate displacement measurements within each interrogation window can be achieved. Higher spatial resolution velocity profiles can be achieved by minimizing the size, and thus maximizing the number, of interrogation windows. In recent years, PIV techniques have been extended to the microscale, proving highly useful for acquiring flow data [17–20] in microfluidic studies. For example, PIV was used recently to reconstruct the three-dimensional flow profile within several microchannels [21].
The purpose of this study was to develop a system capable of acquiring quantitative flow profiles over adherent cells. Experimental models that mimic the flow conditions in microcapillaries have suggested that the local shear stresses and shear rates can mediate tumor cell and leukocyte arrest on the endothelium and can alter the likelihood of adhesion [22]. However, the mechanisms involved, especially in tumor cell adhesion, are poorly understood and investigation has been limited by the lack of experimental models that allow quantitative analysis of flow profiles over adherent cells. Here we report the construction of an in vitro model capable of acquiring such data by combining the techniques of side-view imaging and particle image velocimetry (PIV), thus providing a means for future study of the hydrodynamic forces underlying cellular adhesion. To complement the experimental results, a CFD model was created that corresponds with the experimental conditions, including the deformed cell shape, under low and high shear rates. Velocity profiles and cell surface shear rates are compared. The good correspondence between experimental and CFD results provides confidence in the presented predictions of quantities not obtainable in these experiments, including drag forces on the cells, local pressure, and viscous forces on the adherent cell and endothelial wall, and local velocity profiles and streamlines.
Materials and Methods
System Design
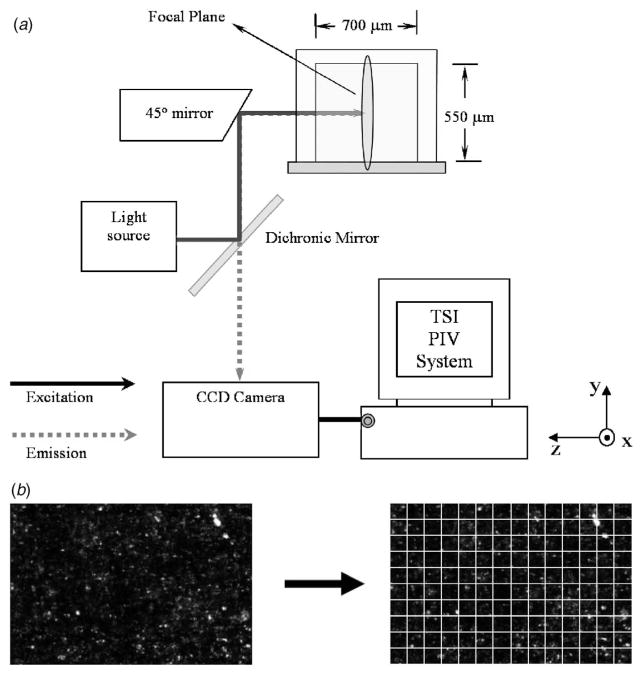
A PIV system has been constructed by combining an Olympus IX 71 microscope with a 20X, 0.4 NA objective, and a TSI microPIV system (TSI Inc., MN) (see Fig. 1(a)). A 45 deg mirror has been coated with a double layer of Cr (50 nm) and Au (200 nm) using sputtering techniques and has been aligned to distribute side-view incident light from a mercury lamp or Nd-YAG 532 nm laser to an objective beneath the stage. An identical setup as used by Cao et al. [16] was used for side-view image capturing of cells, involving the use of a second mirror to redirect light from a condenser bulb above the stage. To ensure proper alignment, an aluminum chassis was designed to hold the channel and mirrors firmly in place.
Fig. 1.
(a) A schematic experimental setup for side view imaging and PIV data acquisition within a microchannel (700×550 μm2). (b) A representative image frame with fluorescent tracer particles. The image is gridded into smaller interrogation windows to calculate local velocity vectors.
This system was used to obtain side-view PIV data in the form of double frame pairs using a Nd-YAG 532 nm laser light source. One μm-diameter orange fluorescent polystyrene microspheres of density 1.05 g/cm3 (Molecular Probes, Inc., OR) were used as tracer particles at a concentration of 0.0175% by volume. For flow experiments involving cells, the microspheres were suspended at a concentration of 0.0524% by volume in RPMI-1640 media lacking phenol red (Gibco Laboratoies, Long Island, NY). To reduce the nonspecific binding of the spheres to each other and to the endothelial monolayer, this solution was supplemented with 5% bovine serum albumin (Sigma-Aldrich, Inc., St. Louis, MO) and incubated for 24 h at 37°C. Prior to experimentation, the solutions were cooled to room temperature and further diluted in RPMI-1640 media to reach the desired microsphere concentration of 0.0175% by volume. The viscosity of this solution was measured with a RotoViscoI cone-plate viscometer (ThermoMC, Madison, WI) to be approximately 1.5 cP at room temperature (18.5°C).
For postprocessing, an average background processing algorithm and image stacking were used to decrease background noise and increase the apparent tracer particle density. Following image stacking, data was imported into INSIGHT 6.0 (TSI Inc., MN) for analysis. The image field was gridded into a set of interrogation windows (Fig. 1(b)) with a 50% overlap to satisfy Nyquist sampling and the data was processed using a direct correlator or FFT correlator. Since only cases of steady state flow were considered, in which the velocity profile did not change during the time when acquiring data, the signal to noise ratio was greatly improved by ensemble averaging the correlation function across all frame pairs according to the techniques outlined by Meinhart and co-workers [23]. The pixel sizes were estimated to be 0.23 μm/pixel and interrogation window sizes were optimized accordingly. The laser pulse spacings used ranged from 150 μs to 600 μs.
Flow Chamber Design
A 700 μm×550 μm in cross-sectional area channel was constructed according to the methods of Cao et al. [16]. Prior to use, the microslides were washed successively in acetone, 93% ethanol, and double distilled water. Preceding these washes, the 93% ethanol and double distilled water were both perfused through 0.20 μm polycarbonate filters to eliminate impurities. Flow was controlled by means of a syringe pump.
The pertinent equations for a flow assay with the side-view flow chamber have been derived by Cao et al. [16] describing an x-directed velocity field in a rectangular capillary of y and z cross-sectional area. The desired shear rate on the bottom of the flow chamber was attained by calculating the corresponding volumetric flow rate infused through the microcapillaries. Only cells in the central third of the channel width were used in order to minimize sidewall effects on the shear rate from the rectangular shaped capillaries.
Side-View Imaging Demonstration
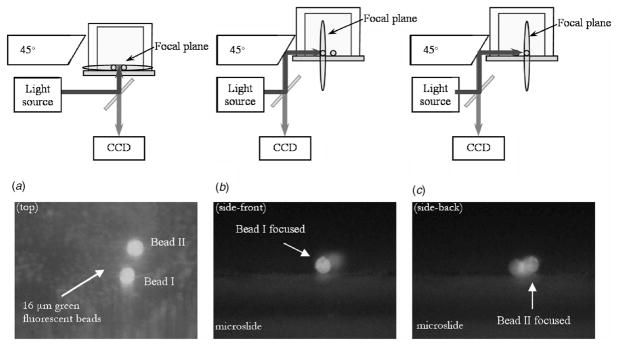
Sixteen μm-diameter green fluorescent polystyrene divinylbenzene (DVB) microspheres (Duke Scientific Corp., CA) were used to demonstrate the side-view imaging abilities of the system. The microspheres were adhered to the inserted microslide by dropping dilute aqueous solutions onto the microslides and allowing surface-surface interactions to promote adhesion. Shown in Fig. 2 are the top and side-views of two beads visualized using a mercury light source. The beads are easily distinguished by changing the focal plane in the z-direction (Fig. 2).
Fig. 2.
(a) A top view experimental setup and a fluorescent image showing two 16 μm diameter fluorescent beads, (b) a side view experimental setup when the focal plane is placed on the front bead (bead I), and its fluorescent image, and (c) when it is on the next bead (bead II) and its fluorescent image
Cell Culture
Fibroblast L-cells that had been transfected to express human ICAM-1 (EI cells; provided by Dr. S. Simon, UC Davis) were maintained in culture as described by Gopalan and co-workers [24]. Prior to flow experiments, these cells were grown to confluency on the inserted microslides of the channel, thus creating an ICAM-1 adhesive substrate. T-leukemic Jurkat cells (provided by Dr. M. Lawrence, University of Virginia, Charlottesville, VA) were maintained in a humidified 5% CO2 tissue culture incubator at 37°C. They were cultured in a suspension of RPMI 1640 medium supplemented with 10% FBS, L-glutamine (0.292 mg/ml), penicillin (100 U/ml), and streptomycin sulfate (100 μg/ml) (Gibco Laboratoies, Long Island, NY). Prior to use in flow experiments, the Jurkat cells were incubated with phorbol myristate acetate (PMA) at a concentration of 200 ng/ml for 20 min at 37°C to promote LFA-1-dependent cell adhesion.
Velocity Profiles over a Leukocyte
The channel was perfused with a leukocyte suspension. For a period of approximately 5–10 min, flow was suspended and the cells were permitted to adhere to the EI monolayer grown on the microslide before flow was reapplied at 73 μl/min and 365 μl/min, corresponding to low and high shear rate cases of 50 s−1 and 250 s−1, respectively. The channel Reynolds number is defined as Re=ρVDh/mu;, where ρ denotes the density of the fluid, V is the average velocity through the channel calculated by the flow rate divided by the cross-sectional area, Dh is the hydraulic diameter calculated as four times the cross-sectional area divided by the perimeter, and μ is the fluid viscosity. The channel Reynolds number associated with the low shear case was 1.3 and the high shear case was 6.5. A larger than average cell (estimated at 22 μm in width) was imaged to give a maximum disruption in the flow field. For the velocity profiles, the interrogation windows were 30×20 pixels in size (width×height).
The upstream wall shear rates were verified by plotting the x-directed velocity values from three columns of vectors calculated using interrogation windows of 128 pixels in width and 12 pixels in height. These were sampled far enough upstream such that there was no disruption in the flow due to the cell, approximately 5 cell lengths upstream from the cell. Linear regressions were calculated from data points less than 55 μm above the channel wall (10% of channel height) where zero velocity was assigned at the top of the endothelial layer as estimated from the image. The upstream wall shear rates in the 73 μl/min (low shear) and 365 μl/min (high shear) cases were calculated from the linear regression and found to be 51.0 (R2 value 0.9924) and 257.7 (R2 value 0.994), respectively. These wall shear rates correspond to wall shear stresses of 0.765 dyn/cm2 and 3.864 dyn/cm2. To ensure deviations from a linear flow profile near the wall did not alter the calculated upstream wall shear rates, quadratic regression curves were also calculated using x-directed velocity values from points up to 170 μm above the channel wall (30.9% of channel height). As in the linear case, zero velocity was assigned at the endothelial cell layer. The slopes at the wall were within 10% of the corresponding values calculated from the linear regressions.
In order to calculate the maximum shear rates over the surface of the cell in each case, the velocity profile above the highest point on the cell were used. In the low shear case the cell’s maximum height is right above the center of the cell, whereas in the high shear case the cell’s maximum height has been displaced forward due to the deformation of the cell in the high shear flow. These chosen velocities were plotted for each case and quadratic regression curves were fitted to the measured flow profiles with the zero velocity occurring at the estimated location of the top of the cell. The slopes of the curves at the point of zero x-directed velocity were taken to be the maximum shear rates above the cell.
Computational Fluid Dynamics Simulations
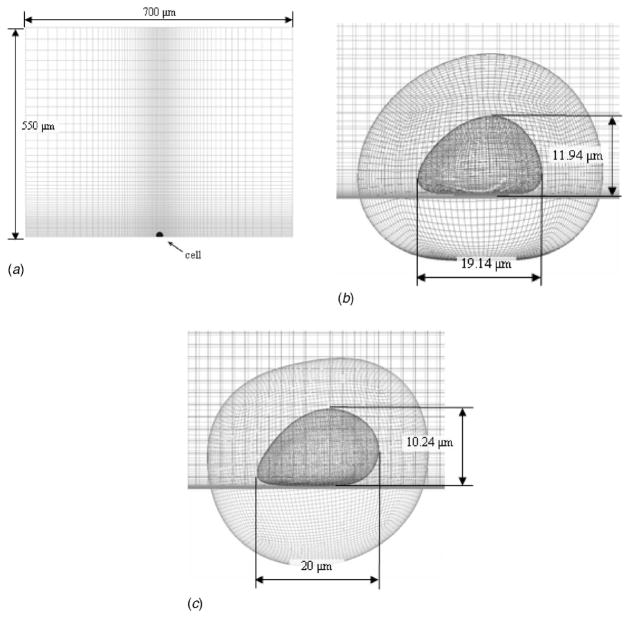
The computational fluid dynamics code used in this study was developed and validated at Penn State University as described previously and solves the full fluid momentum and continuity equations [25]. A three-dimensional model of the microchannel was created 700 μm wide and 550 μm tall. At the center of the channel, a model cell was generated on the bottom wall as shown in Fig. 3. A no slip boundary condition was applied to all four walls of the chamber and the outside of the cell shape. The defined cell shape corresponded to the deformed height, width, and length of the deformed Jurkat cell in the low and high shear cases. Spatially, the observed cell shapes were achieved by applying the analytic deformation, yt = (y/a(x))b(x), to the y-coordinates or heights of a sphere with a one micron radius and scaling to the appropriate size, where yt is the transformed y-coordinate and y is the original coordinate. Various functions of the x-coordinates were used for a and b to recreate the cell shapes under low and high shear rates. Since it has been observed previously [10] that deformed cells maintain their width dimension, no transformation was applied to the z-coordinates. A front view of the channel and cell grids and a close-up of the side views of the cells are shown in Fig. 3. Overset grids were used in order to minimize the total number of elements while maintaining a high resolution immediately surrounding the cell. A fully developed laminar velocity profile in a rectangular duct with the same flow rate as the low and high shear rate experiments, 73 and 365 μl/min, was specified at the inlet [26]. The computational grid extended approximately 4 cell diameters upstream and 2 cell diameters downstream, lengths sufficient for these very low channel Reynolds number flows and given the analytical specification of the inlet velocity.
Fig. 3.
(a) Front view of the channel grid used for the CFD simulations, (b) side view of the cell grid used to model the low shear case, and (c) high shear case, with dimensions
To validate the CFD computations, the simulated drag force on an isolated sphere in a shear flow was shown to be consistent with Stokes’ law (CD =24/Re) within 1%. Also, Cao et al. [10] 8 dyn/cm2 shear stress case was modeled using the same method as described above. The calculated drag force, which includes both the pressure and viscous force components, was 3.0 ×10⁻⁵ dyn, which is within the range of previously reported experimental approximations and theoretical predictions of drag force on an adherent leukocyte of 2×10⁻⁷ to 76×10−5 dyn [10,7,27].
To further validate the simulation technique, shear rates were calculated upstream and over the cell using the same regression methods as described for the PIV data. The upstream shear rate was calculated using horizontal velocities up to 55 μm above the bottom wall approximately 3 cell diameters upstream of the cell, far enough that there was no disturbance due to the cell. To calculate the shear rate over the cell, one vertical column of horizontal velocity was taken over the highest point on the cell that reached to approximately the same height above the cells as the PIV data. These were then plotted and a quadratic regression curve was fitted with the zero velocity at the location of the top of the cell. The slope of the curve at that point was taken to be the shear rate.
Results
Velocity Profile Over a Leukocyte
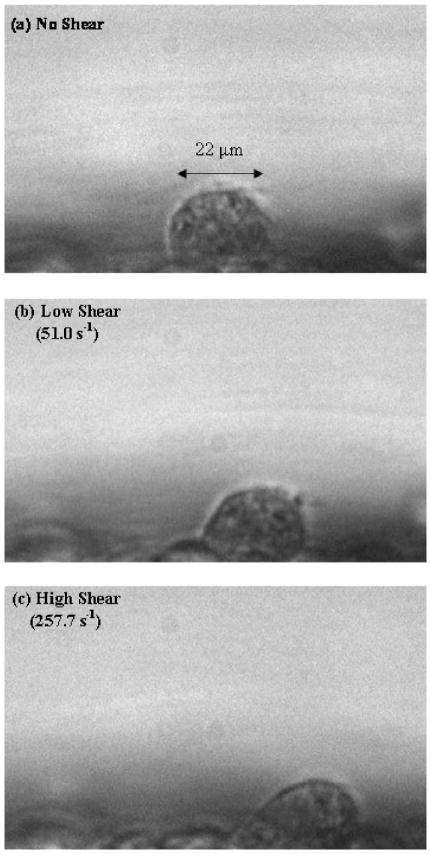
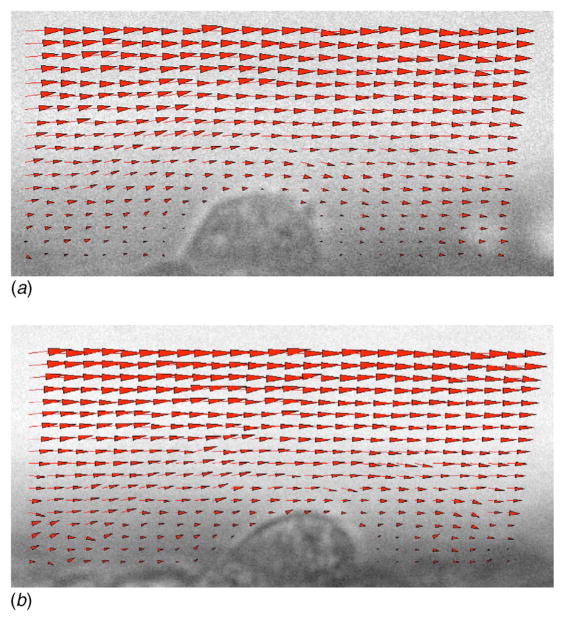
Figure 4 shows a large Jurkat cell of approximately 22 μm in diameter that adhered under static conditions to an EI monolayer within the channel. Flow was applied at 73 μl/min and 365 μl/min to correspond to low and high shear cases of 50 s−1 and 250 s−1, respectively. These shear rates were experimentally verified as discussed in the section Materials and Methods. The cell deformed significantly under both low and high shear when compared to static conditions. The corresponding velocity profiles are shown in Fig. 5.
Fig. 4.
A large Jurkat cell of approximately 22 μm in diameter was adhered under static conditions to an EI monolayer within the channel. Flow was applied in low and high shear cases to yield corresponding upstream wall shear rates of 51.0 s−1 and 257.7 s−1. Large deformation in the cell shape is apparent in both cases.
Fig. 5.
Velocity vector fields representing calculated velocity values associated with the images shown in Figs. 4(b) and 4(c)
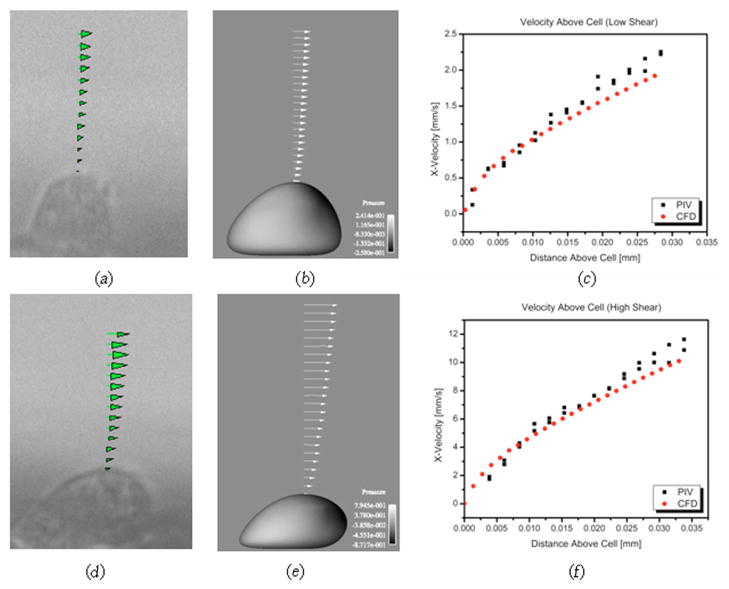
The velocities directly above the top of the cell under low and high shear conditions, taken from the data in Fig. 5, is plotted in Figs. 6(a) and 6(d). The calculated shear rates above the cell were 124.21 s−1 and 502.4 s−1 in the low and high shear cases, respectively. Table 1 compares these values to the upstream wall shear rates and reports the ratios of the shear rate above the cell to the upstream wall shear rate. Under the more severe deformation of the high shear case, the ratio of the shear rate at the cell surface to that at the upstream wall is 13.6% lower than the corresponding ratio of the low shear case.
Fig. 6.
Velocities over the top of the cell in the low shear case attained from (a) experimental PIV results, (b) CFD results, and (c) both PIV and CFD data plotted. Velocities in the high shear case attained from (d) experimental PIV results, (e) CFD results, and (f) both PIV and CFD data plotted. The computation model cells in (c) and (e) are shaded by the pressure distribution on the cell surface.
Table 1.
Comparison of shear rates upstream and above a cell calculated from PIV and CFD results.
| Upstream wall shear rate | Local shear rate | Ratio | |
|---|---|---|---|
| PIV results | 51.0 s−1 | 124.21 s−1 | 2.44 |
| 257.7 s−1 | 502.4 s−1 | 1.95 | |
| CFD results | 48.0 s−1 | 123.34 s−1 | 2.57 |
| 232.8 s−1 | 507 s−1 | 2.18 |
Computational Fluid Dynamics Simulations
Table 1 also compares the shear rate values calculated from the PIV data to those calculated from the CFD simulation results. The differences in shear rates calculated using the CFD results from those calculated using the PIV results were 5.8 and 9.7% for the low and high shear cases upstream and 0.7 and 0.9% for the low and high shear cases above the cells. The velocities used to determine the shear rates above the cells from the CFD results are shown in Figs. 6(b) and 6(e) as vectors and plotted with those from the PIV data in Figs. 6(c) and 6(f).
The drag force calculated on the deformed cell under the low shear rate tested, 51/s, was 1.07×10⁻⁵ dyn. The ratio of the viscous component of the drag force to the pressure component was 2, with a pressure force of 3.58×10⁻⁶ dyn, and a viscous component of 7.17×10⁻⁶ dyn. Under the high shear rate, 257.7/s, the drag force on the deformed cell was 5.46×10⁻⁵ dyn. The pressure component of this force was 1.67×10⁻⁵ dyn and the viscous component was 3.8×10⁻⁵ dyn, for a ratio of 2.3.
Since the CFD results have a higher resolution than the PIV results, the shear rate upstream and above the cell can be examined very close to the walls. Above the cell, the PIV results yield an average shear rate over a vertical distance above the cell approximately twice the cell’s height. From the CFD results, the horizontal velocity profile up to 6 μm above the top of the cell was used in a quadratic regression to calculate the shear rate on the cell surface. This shear rate for the high shear case was 731.8/s (R2 value 0.9999), which is 1.46 times the shear rate calculated using the previous regression. For the low shear case, the same method yields a shear rate of 208.8 (R2 value 0.9976), which is 1.69 times that calculated using velocities further away from the top of the cell. There is no significant difference between the upstream shear rates calculated using the velocity profile up to 6μm or 55 μm above the wall.
Discussion
Technique of Side-View PIV
Building on the developments of previous work in the study of microflows and cellular adhesion, a side-view flow chamber has been integrated with particle image velocimetry (PIV)to produce a novel quantitative method of studying cellular adhesion experimentally. The small scale of the imaged objects in these experiments necessitates the use of aggressive processing to increase the signal to noise ratio and the apparent particle density. This processing facilitates accurate quantitation of steady-state flow profiles in the side-view system. In the future, the system could be improved to allow collection of the dynamic flow profiles as well.
The accuracy of side-view PIV in describing the hydrodynamic activity within the microchannel was assessed by using the system to measure velocity near the bottom wall of the channel and comparing them to theoretical predictions. The experimental PIV-acquired data match the theoretical predictions very closely, with errors of 2.0 and 3.0% for the low and high shear cases, respectively. The usefulness of the side-view PIV system to characterize disturbances in the flow at the cellular length scale has been demonstrated by calculating the flow profile over a Jurkat cell under low and high shear rates.
Implications of Shear Rate Data
The shear rate over the surface of the Jurkat cell in Fig. 4 was calculated to be 124.2 s−1 for an upstream shear rate of 51.0 s−1 (0.765 dyn/cm2) and 502.4 s−1 for an upstream shear rate of 257.7 s−1 (3.864 dyn/cm2). The ratio of the shear rate over the cell to the upstream wall shear rate was 2.44 for the low shear case and 1.95 for the high shear case (Table 1). Thus the normalized shear rate over the surface of the cell decreased by 20.1% when the cell deformed. Since the viscous drag force is directly related to the shear rate, this lends experimental support for the computational studies that have suggested that the effective drag forces acting on adhering cells are reduced following deformation.
Computational Fluid Dynamics
The simulations presented here serve to validate the flow solver used by comparing the calculated flow profile and shear rates to experimental results of the modeled system. Both the upstream and above the cell shear rates were within 10% of the measured shear rates when similar data collection methods were used. This discrepancy may be due to experimental uncertainty of the location of the boundaries, the lack of a cell monolayer in the computational model, and the difference in resolution between the two methods. PIV data is in essence an average of the fluid velocity over a small three-dimensional space. CFD data does not deliver this kind of averaging. The CFD model conserves mass to within a tenth of an order of magnitude. Accordingly, the underprediction of the velocity profile above the cell is likely due to one or both of (1) three-dimensional effects associated with the modeled shape of the cell, and (2) attendant overprediction of velocity closer to the center of the channel (i.e., above the PIV interrogation space).
The enhanced resolution of the CFD results allowed the velocity profiles directly above the top of the cell to be examined more closely. This showed the shear rate very close to the cell was approximately twice what was calculated using the averaging technique, which is an indication of the nonlinearity of the velocity profile above the cell. The quadratic profiles yielded R2 values very close to 1 in the region immediately above the cell, showing a high accuracy of the quadratic regression method.
In future study, the experimental and computational setup will be used to model and validate the calculation of deformable cell shapes under different flow conditions. This coupling of experimental and computational models will yield an accurate prediction of the effect of flow conditions on both cell deformability and adhesion parameters.
Future Study
In future research the experimental system and the computational model described here will be used to investigate the interactions between human neutrophils (PMNs) and melanoma cells in PMN-mediated melanoma extravasation. Analysis of the flow profiles over adherent PMN-melanoma aggregations exposed to differing shear rates and shear stresses may help specify the relative importance of shear rates and shear stresses in mediating the adhesion of leukocyte-tumor cell aggregations [22]. The relative importance of each parameter will likely depend upon the degree of deformation and the Reynolds number.
Acknowledgments
The authors thank Dr. Scott Simon (UC Davis, CA) for providing transfected fibroblast L-cells; Dr. Michael Lawrence (University of Virginia, VA) for T leukemic Jurkat cells. This work was supported in part by the NIH Grant No. CA-97306, NSF Grant Nos. BES-0138474 and NSF REU (Research Experience for Undergraduates) Supplement.
Footnotes
Contributed by the Bioengineering Division of ASME for publication in the Journal of Biomechanical Engineering.
Contributor Information
Jordan Leyton-Mange, Department of Bioengineering, The Pennsylvania State University, 205 Hallowell Building, University Park, PA 16802-6804.
Sung Yang, Department of Bioengineering, The Pennsylvania State University, 205 Hallowell Building, University Park, PA 16802-6804.
Meghan H. Hoskins, Department of Bioengineering, The Pennsylvania State University, 205 Hallowell Building, University Park, PA 16802-6804
Robert F. Kunz, Applied Research Laboratory, Computational Mechanics Division, P.O. Box 30, State College, PA 16804-0030
Jeffrey D. Zahn, Department of Bioengineering, The Huck Institutes of the Life Sciences, The Pennsylvania State University, 205 Hallowell Building, University Park, PA 16802-6804
Cheng Dong, Department of Bioengineering, The Huck Institutes of the Life Sciences, The Pennsylvania State University, 205 Hallowell Building, University Park, PA 16802-6804.
References
- 1.Yuan J, Melder RJ, Jain RK, Munn LL. Lateral View Flow System for Studies of Cell Adhesion and Deformation Under Flow Conditions. BioTechniques. 2001;30(2):388–394. doi: 10.2144/01302rr02. [DOI] [PMC free article] [PubMed] [Google Scholar]
- 2.Dong C, Lei X. Biomechanics of Cell Rolling: Shear Flow, Cell-Surface Adhesion, and Cell Deformability. J Biomech. 2000;33(1):35–43. doi: 10.1016/s0021-9290(99)00174-8. [DOI] [PubMed] [Google Scholar]
- 3.Liu X, Wang X, Yin H, Chen H. Deformation Mechanism of Leukocyte Adhering to Vascular Surface Under Steady Shear Flow. Sci China, Ser C: Life Sci. 2004;47(2):165–174. doi: 10.1360/02yc0255. [DOI] [PubMed] [Google Scholar]
- 4.Khismatullin DB, Truskey GA. A 3D Numerical Study of the Effect of Channel Height on Leukocyte Deformation and Adhesion in Parallel-Plate Flow Chambers. Microvasc Res. 2004;68(3):188–202. doi: 10.1016/j.mvr.2004.07.003. [DOI] [PubMed] [Google Scholar]
- 5.Sugihara-Seki M, Schmid-Schonbein GW. The Fluid Shear Stress Distribution on the Membrane of Leukocytes in the Microcirculation. J Biomech Eng. 2003;125(5):628–638. doi: 10.1115/1.1611515. [DOI] [PubMed] [Google Scholar]
- 6.Lei X, Lawrence MB, Dong C. Influence of Cell Deformation on Leukocyte Rolling Adhesion in Shear Flow. J Biomech Eng. 1999;121(6):636–643. doi: 10.1115/1.2800866. [DOI] [PubMed] [Google Scholar]
- 7.House SD, Lipowsky HH. In Vivo Determination of the Force of Leukocyte-Endothelium Adhesion in the Mesenteric Microvasculature of the Cat. Circ Res. 1988;63(3):658–668. doi: 10.1161/01.res.63.3.658. [DOI] [PubMed] [Google Scholar]
- 8.Kan HC, Udaykumar HS, Shyy W, Tran-Son-Tay R. Numerical Analysis of the Deformation of an Adherent Drop Under Shear Flow. J Biomech Eng. 1999;121(2):160–169. doi: 10.1115/1.2835098. [DOI] [PubMed] [Google Scholar]
- 9.Chapman GB, Cokelet GR. Model Studies of Leukocyte-Endothelium-Blood Interactions. II. Hemodynamic Impact of Leukocytes Adherent to the Wall of Postcapillary Vessels. Biorheology. 1997;34(1):37–56. doi: 10.1016/S0006-355X(97)00003-6. [DOI] [PubMed] [Google Scholar]
- 10.Cao J, Donell B, Deaver DR, Lawrence MB, Dong C. In Vitro Side-View Technique and Analysis of Human T-Leukemic Cell Adhesion to ICAM-1 in Shear Flow. Microvasc Res. 1998;55:124–137. doi: 10.1006/mvre.1997.2064. [DOI] [PubMed] [Google Scholar]
- 11.Khismatullin DB, Truskey GA. A 3D Numerical Study of the Effect of Channel Height on Leukocyte Deformation and Adhesion in Parallel-Plate Flow Chambers. Microvasc Res. 2004;68:188–202. doi: 10.1016/j.mvr.2004.07.003. [DOI] [PubMed] [Google Scholar]
- 12.Liu X, Wang X, Huang H, Chen H. A Biomechanical Model for Simulating the Deformation of a Leukocyte Adhered to the Surface of a Blood Vessel Under Steady Shear Flow. J Biomed Eng. 2003;20(1):30–34. [PubMed] [Google Scholar]
- 13.Liu XH, Wang X. The Deformation of an Adherent Leukocyte Under Steady Shear Flow: A Numerical Study. J Biomech. 2004;37(7):1079–1085. doi: 10.1016/j.jbiomech.2003.11.015. [DOI] [PubMed] [Google Scholar]
- 14.Liu XH, Wang X, Yin HM. Effects of Steady Shear Flow on the Deformation of Leukocyte Adhered to Vascular Endothelial Surface. Space Med Eng (Beijing) 2004;17(1):7–11. [PubMed] [Google Scholar]
- 15.Fung YC. A First Course in Continuum Mechanics for Physical and Biological Engineers and Scientists. Prentice-Hall; New Jersey: 1994. [Google Scholar]
- 16.Cao J, Usami S, Dong C. Development of a Side-View Chamber for Studying Cell-Surface Adhesion Under Flow Conditions. Ann Biomed Eng. 1997;25(3):573–580. doi: 10.1007/BF02684196. [DOI] [PubMed] [Google Scholar]
- 17.Santiago JG, Wereley ST, Meinhart CD, Beebe DJ, Adrian RJ. A Particle Image Velocimetry System for Microfluidics. Exp Fluids. 1998;25:316–319. [Google Scholar]
- 18.Meinhart CD, Wereley ST, Santiago JF. PIV Measurements of a Microchannel Flow. Exp Fluids. 1999;27:414–419. [Google Scholar]
- 19.Cummings EB. An Image Processing and Optimal Nonlinear Filtering Technique for Particle Image Velocimetry of Microflows. Exp Fluids. 2000;29:S.42–S.50. [Google Scholar]
- 20.Nguyen N, Wereley ST. Fundamentals and Applications of Microfluidics. Artech House; Boston: 2002. [Google Scholar]
- 21.Yang S, Leyton-Mange J, Dong C, Zahn JD. Side-View Particle Image Velocimetry (PIV) for Three Dimensional Microflow Profile Reconstruction. Proceedings of the ASME IMECE Fluids Engineering Symposium, IMECE2004-60978; Nov. 13–19; Anaheim, CA. 2004. [Google Scholar]
- 22.Slattery M, Liang S, Dong C. Distinct Role of Hydrodynamic Shear in PMN-Facilitated Melanoma Cell Extravasation. Am J Physiol. 2005;288(4):C831–C839. doi: 10.1152/ajpcell.00439.2004. [DOI] [PMC free article] [PubMed] [Google Scholar]
- 23.Meinhart CD, Wereley ST, Santiago JF. A PIV Algorithm for Estimating Time-Averaged Velocity Fields. Proceedings of the Optical Methods and Image Processing in Fluid Flow, 3rd ASME/JSME Fluids Engineering Conference; San Francisco, CA. 1999. [Google Scholar]
- 24.Gopalan PK, Smith CW, Lu H, Berg E, Mcintire LV, Simon SI. PMN CD18-Dependent Arrest on ICAM-1 in Shear Flow can be Activated Through L-Selectin. J Immunol. 1997;158:367–375. [PubMed] [Google Scholar]
- 25.Kunz RF, Yu WS, Antal SP, Ettorre SM. An Unstructured Two-Fluid Method Based on the Coupled Phasic Exchange Algorithm. AIAA Paper No. AIAA-2001-2672, AIAA Computational Fluid Dynamics Conference, 15th; Anaheim, CA. June 11–14.2001. [Google Scholar]
- 26.White FM. Viscous Fluid Flow. 2. McGraw-Hill; NY: 1991. [Google Scholar]
- 27.Schmid-Schonbein G, Fung YC, Zweifach B. Vascular Endothelium-Leukocyte Interaction: Sticking Shear Force in Venules. Circ Res. 1975;36:173–184. doi: 10.1161/01.res.36.1.173. [DOI] [PubMed] [Google Scholar]


