Abstract
Due to the popularity of Echinacea as a dietary supplement, researchers have been actively investigating which Echinacea constituent or groups of constituents are necessary for immune modulating bioactivities. Our prior studies indicate that alkylamides may play an important role in the inhibition of prostaglandin E2 (PGE2) production. HPLC fractionation, employed to elucidate interacting anti-inflammatory constituents from ethanol extracts of E. purpurea, E. angustifolia, E. pallida, and E. tennesseensis identified fractions containing alkylamides and ketones as key anti-inflammatory contributors using lipopolysaccharide induced PGE2 production in RAW264.7 mouse macrophage cells. Nitric oxide (NO) production and parallel cytotoxicity screens were also employed to substantiate an anti-inflammatory response. Echinacea pallida showed significant inhibition of PGE2 with a first round fraction, containing GC-MS peaks for Bauer Ketones 20, 21, 22, 23, and 24, with 23 and 24 identified as significant contributors to this PGE2 inhibition. Chemically synthesized Bauer Ketones 21 and 23 at 1 μM each significantly inhibited both PGE2 and NO production. Three rounds of fractionation were produced from an E. angustifolia extract. GC-MS analysis identified the presence of Bauer Ketone 23 in third round Fraction 3D32 and Bauer Alkylamide 11 making up 96% of third round Fraction 3E40. Synthetic Bauer Ketone 23 inhibited PGE2 production to 83 % of control and synthetic Bauer Alkylamide 11 significantly inhibited PGE2 and NO production at the endogenous concentrations determined to be present in their respective fraction, thus each constituent partially explained the in vitro anti-inflammatory activity of their respective fraction. From this study two key contributors to the anti-inflammatory properties of E. angustifolia were identified as Bauer Alkylamide 11 and Bauer Ketone 23.
Keywords: Echinacea purpurea, Echinacea angustifolia, Echinacea pallida, Echinacea angustifolia, Prostaglandin E2, Nitric Oxide, Bauer Alkylamides, Bauer Ketones, Anti-inflammatory, Fractionation
Introduction
Sales of Echinacea as a botanical supplement have remained high over recent years in the United States reaching approximately twenty-one million dollars in 2005 (1). The efficacy and health benefits of taking Echinacea as a supplement have yet to be verified scientifically and researchers are still unclear as to how the constituents of Echinacea act individually or in concert to elicit the bioactive properties that have been observed in numerous studies, both in vitro and in vivo (2, 3). Although Echinacea extracts are complex mixtures consisting of several constituents, alkylamides and caffeic acid derivatives have received considerable attention recently for their abilities to modulate the immune system. Recent studies have shown that alkylamides of Echinacea are partially responsible for anti-inflammatory responses such as inhibition of PGE 2, TNF-α, and NO production in RAW264.7 mouse macrophage cells (2–5), as well as inhibition of cyclooxygenase activity in neuroglioma cells and other in vitro model systems (4, 6). Studies have further validated that alkylamides are capable of binding to and activating the cannabinoid receptor type-2 providing insight into the mechanism by which these constituents may modulate immune function (7, 8). Caffeic acid derivatives have been associated with anti-viral and anti-oxidant properties (9–11). It has been hypothesized that alkylamides and caffeic acid derivatives interact, perhaps synergistically, with each other or other compounds to elicit immunomodulatory effects (9).
Prostaglandin E2 is a major lipid mediator of inflammation that is produced through the activation of the arachidonic acid cascade, via the enzymatic activity of the cyclooxygenase isoforms. The inducible nature of PGE2 production when macrophage cells are stimulated by lipopolysaccharide (LPS) makes this eicosinoid an ideal target for measuring an inflammatory response in vitro.
Our studies were conducted to identify Echinacea constituents that are responsible for the previously described PGE2 inhibition (2). Methods have been developed to quantitatively determine the amount of alkylamides and caffeic acid derivatives present in different parts of the Echinacea plant using reverse phased HPLC and GC-MS analysis (12, 13). Semi-preparative reverse phased HPLC was utilized to fractionate Echinacea extracts into fractions and sub-fractions that separate phytochemicals according to their hydrophobic properties, concentrating a reduced number of constituents to analyze for anti-inflammatory potential. Eluents from HPLC fractionations were monitored for absorbance at wavelengths of 260 nm and 330 nm in order to identify lipophilic alkylamides and phenolic compounds, such as caffeic acid derivatives. Further fractionation was guided by identifying fractions capable of inhibiting PGE2 production, allowing for a thorough investigation into the hypothesized synergistic or additive interactions that are thought to occur among the constituents of Echinacea extracts and allow for the identification of key anti-inflammatory constituents through the use of GC-MS analysis. In order to have a more complete view of how interacting constituents found in Echinacea inhibit inflammatory mediators, NO production was also assessed in RAW264.7 macrophage cells treated with chemically synthesized phytochemicals, which were identified to be important in the PGE2 assay with E. angustifolia.
Materials and Methods
Plant Material and Extraction
Plant materials were provided by the USDA North Central Regional Plant Introduction Station (NCRPIS, Ames, IA). E. angustifolia (PI631285), E. purpurea (PI631307), E. pallida (PI631293), E. tennesseensis (PI631250) were used for the semi-preparative HPLC fractionation. Root material from each species was collected as previously described (2) from a 2006 harvest. Further information about the accessions can be found on the Germplasm Resources Information Network database at http://www.ars-grin.gov/npgs/acc/acc_queries.html provided by NCRPIS. Plant materials were stored at −20°C under nitrogen in zip-lock bags prior to use. The Echinacea plant materials were all dried root powders. They were previously washed then completely dried at 40°C forced air conditions, followed by grinding through a 40-mesh screen Wiley grinder (14).
For each accession, 6 grams of Echinacea root material was extracted with 95 % ethanol and 5 % endotoxin-free water using Soxhlet apparatus for 6 hours for exhaustive extraction, following the protocol created by Liu (15). To avoid endotoxin contamination the glassware was heated to 180°C for at least 2 hours prior to use. After the extraction, the 95 % aqueous ethanol solvent was evaporated using a Rotavap (Buchi rotavaps model R-144, R-110, R-111, and R-200, Switzerland) to obtain the dried extract, which was weighed. The dried extracts were redissolved in endotoxin-free water, and ethanol was added at a ratio of 1:3 (water: ethanol) to obtain a concentration of no more than 0.6 g of extracted material/ml for a 5 ml injection though the semi-preparative HPLC fractionation. The extracts were stored at −20°C overnight prior to fractionation.
Semi-Preparative HPLC Fractionation
The 95 % ethanol extracts of Echinacea were filtered through a 0.45 μm filter prior to injection into the semi-preparative HPLC system consisting of two Beckman Model 110B pumps controlled by a Module406 Beckman System Gold Analogue Interface (Beckman Coulter, Fullerton, CA) using a YMC-PACK ODS-AM 250*10 mm I.D. s-5 μm, 12 nm reversed phase C18 columns (Waters Corp.) and a 5 ml loop on a Rheodyne model 7010 injection valve.
Fractionation was conducted with a solvent gradient designed with acetonitrile as solvent B and 0.1 % HPLC grade glacial acetic acid in endotoxin-free Milli-Q water as solvent A. The gradient started at 10 % B, with a flow rate of 3 ml/min, and increased to 30 % B in 30 min. At 30 min, the gradient increased to 90 % B over 50 min. At 80 min, the gradient increased to 100 % B in 10 min. The gradient was held at 100 % B for 20 min. Fraction 1 was collected in the first 30 min of the gradient. Fraction 2 was collected between 30 and 40 min; fraction 3 was collected between 40 and 80 min; fraction 4 was collected between 80 and 90 min; and fraction 5 was collected between 90 and 110 min. Second round fractions were generated by collecting at 1 min intervals across the same gradient profile within bioactive fractions. For bioassay purposes, subfractions of E. angustifolia Fraction 3 (3A, 3B, 3C, 3D, and 3E) were created by pooling 8 min intervals across the 40 min of Fraction 3. For example, 3B represents eluent collected between min 9 and min 16 within Fraction 3 (or at min 49 to min 56 of gradient time). The third round fractions were then collected at 1 min intervals. For example, Fraction 3D28 was the 3 ml fraction collected at 28 minutes into Fraction 3 (or at min 68 of gradient time). The fractions and subfractions were dried, first by removal of the organic phase by rotary evaporation, and second, by the amount of water by freeze-drying. Compounds in first round fractions of all Echinacea species and second round fractions produced from E. angustifolia were identified using HPLC compared to synthetic standards. The literature has shown that alkylamides dissolved in liquid form and stored at −20°C are stable over extended periods of time (15–17). Therefore, all fractions were diluted in dimethyl sulfoxide (DMSO, Sigma; St. Louis, MO) and stored at −20°C to maintain the stability of alkylamides and thawed at room temperature in preparation for analysis.
High Performance Liquid Chromatography Analysis of E. angustifolia Second Round Fractions
HPLC analysis and quantification of constituents found in second round fractions of E. angustifolia was performed as previously described (2).
GC-MS Analysis
GC-MS analyses were performed using an Agilent Technologies (Palo Alto, CA, USA) gas chromatograph (6890 series), equipped with a model 5973 mass detector operating in the electron impact ionization mode (70 eV). The analyses were carried out by injecting in split-less mode. Analytes were separated using an Agilent Technologies capillary column (HP-5MS fused silica column coated with 5% diphenyl 95% dimethyl polysiloxane, with the dimensions 30 m length × 250 μm bore, 0.25 μm film thickness). Helium was used as the carrier gas at the flow rate of 1.2 ml/min. Identification of compounds was facilitated by using the Agilent Technologies enhanced ChemStation Software, version D.02.00.275.
Alkylamide and Ketone Synthesis
Alkylamide synthesis was conducted as described previously (2). Ketones were chemically synthesized according to the procedures outlined by Kraus et al. (18) and in the thesis of Jaehoon Bae (19). Alkylamide and ketone concentrations were calculated after correcting for percent purity, yielding concentrations equivalent to 100 % pure synthetic constituent. Calculated percent purity before correction for Bauer Alkylamide 10 was 82 %, Bauer Alkylamide 11 was 92 %, Bauer Ketone 20 was 82 %, Bauer Ketone 21 was 76 %, Bauer Ketone 23 was 90 %, and Bauer Ketone24 was 99%. All synthetic alkylamides and ketones were stored at −80°C under argon gas.
Cell Culture
The cell culture model used for these studies was RAW264.7 mouse monocyte/macrophage cells that were obtained from American Type Culture Collection (cat: TIB-71, Manassas, VA). All culturing conditions and procedures were previously described by Hammer et al. (20) with the exception of maintaining optimal growth conditions at 95% humidity.
Measurement of Prostaglandin E2
Prostaglandin E2 production was analyzed using PGE2 enzyme immunoassay (GE Biosciences; Piscataway, NJ) after treating RAW264.7 mouse macrophage cells for eight hours with fractions from E. angustifolia, E. purpurea, E. pallida, and E. tennesseensis and with or without lipopolysaccharide (E. coli O26:B6, Sigma; St. Louis, MO) as previously described (2). Quercetin (3,5,7,3′4′-pentahydroxy flavon), a common flavanoid found in many plant species including Echinacea, was used as the positive control at a concentration of 10 μM (Sigma; St. Louis, MO). Also, baicalein (5,6,7-trihydroxyflavone), a flavanoid found in the medicinal herb Scutellaria baicalensis was used as a positive control at a concentration of 6 μM (Synthesized by G. A. Kraus’s laboratory at Iowa State University).
Measurement of Nitric Oxide Production
Nitric oxide production was analyzed using Griess Reagent System (Promega; Madison, WI) following the manufacturers protocol. RAW264.7 cells were plated at a density of 1.57 × 10⁵ cells/well in a 24 well cell culture plate and incubated overnight. Chemically synthesized ketones of Echinacea and combinations of alkylamides and/or ketones were then added to the cells either with or without LPS for a 24 hour time period. Each treatment contained four controls which were media, media + DMSO (vehicle control), media + LPS, and media + DMSO + LPS. Quercetin was used as the positive control at a concentration of 10 μM (Sigma; St. Louis, MO). After the 24 hour treatment period, the cell supernatants were collected, stored at 4°C until used in the NO assay.
Cytotoxicity of Echinacea Fractions
The method used to detect cytotoxicity was previously described by LaLone et al. (2) using the Celltiter96 Aqueous One Solution Cell Proliferation Assay (Promega Corp., Madison, WI). Cytotoxicity analysis was carried out for all fractions from all Echinacea species analyzed. Each fraction was screened for cytotoxicity at concentrations comparable to those used in the PGE2 assay and incubated for 24 hours. Ursolic acid (Fisher Scientific; Hanover Park, IL) was used as the positive control at three concentrations, 10 μM, 30 μM, and 50μM, with significant cytotoxicity identified at the two highest concentrations. Synthetic Bauer Alkylamide 11 and Bauer Ketone 23 were also screened for cytotoxicity after incubation with macrophages for 72 hours.
Statistical Analysis
Both log transformed PGE2 data and NO data were analyzed using randomized complete block design with variable levels of treatment, followed by a t-test based on pooled error variance to determine statistical significance compared to the (Media + DMSO + LPS) control. In all figures, the data are represented as % of control ± standard error, normalizing the (Media + DMSO + LPS) control to 100% PGE2 or NO production within each block and summarizing across all blocks to obtain the mean and standard error. The three subsamples of cytotoxicity values in each block were averaged before analysis as a randomized complete block design as above. The cytotoxicity data are also presented as % of control ± standard error, normalizing the (Media + DMSO) control to 100% cell survival. All statistical analysis was conducted using the GLM procedures in SAS (version 9.1, SAS Institute Inc.; Cary, NC).
Results
Fractions from E. pallida, E. purpurea, and E. tennesseensis Inhibit PGE2 Production
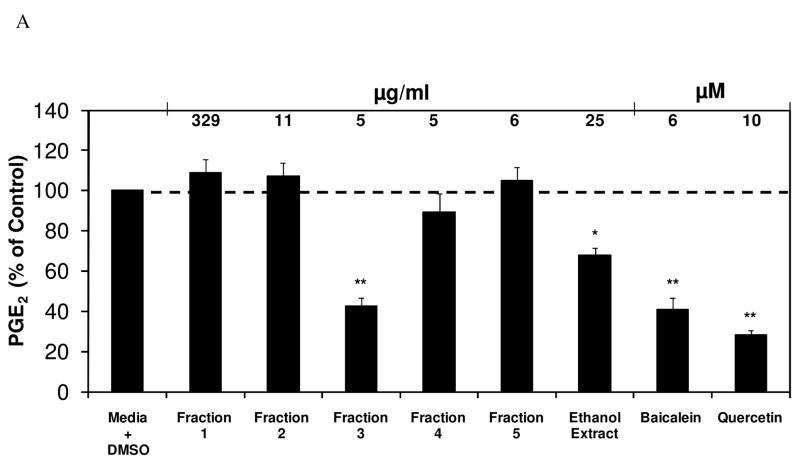
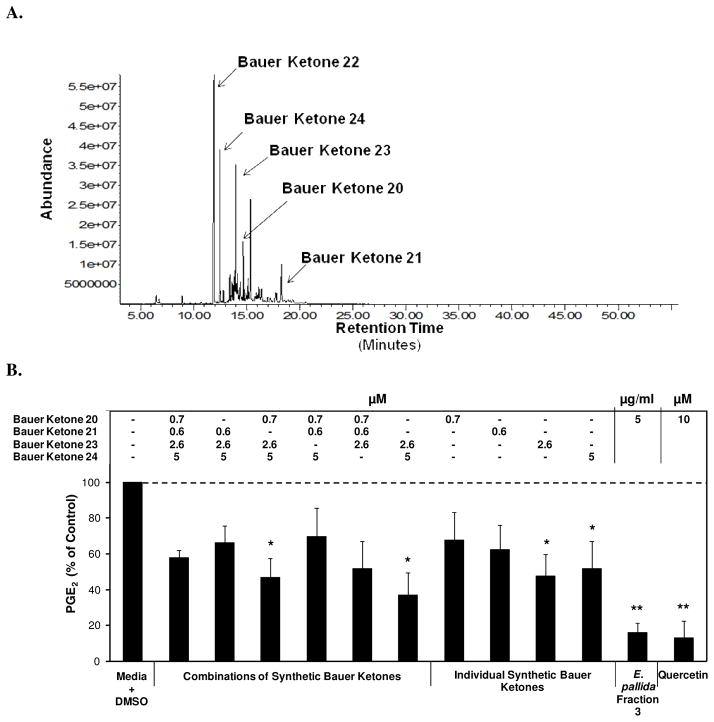
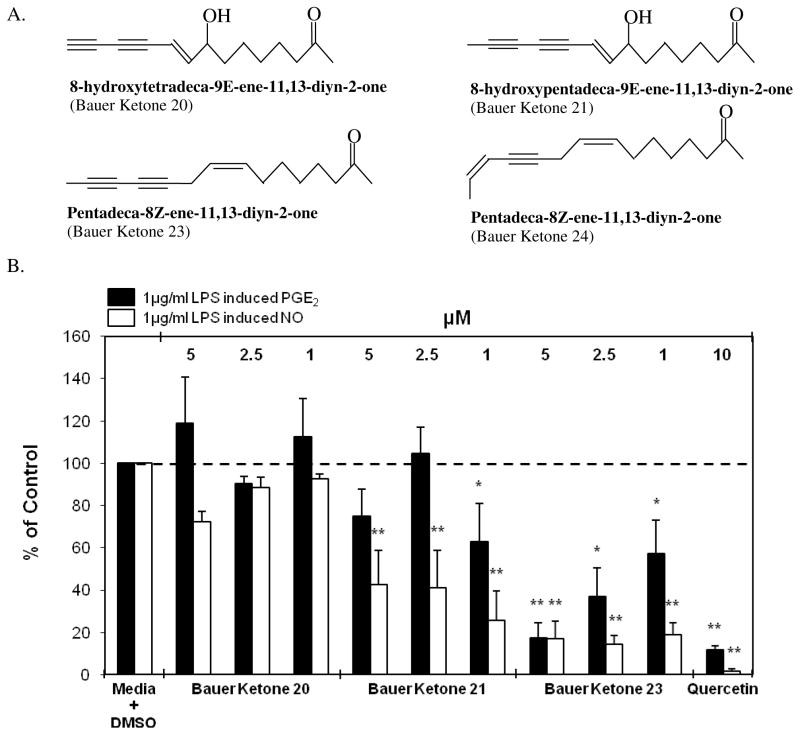
In order to elucidate key constituents capable of inhibiting select inflammatory mediators, a Soxhlet ethanol extract of E. pallida was fractionated into five fractions and each was assessed for its effect on PGE2 production in RAW264.7 mouse macrophage cells. The analysis yielded one fraction, Fraction 3, capable of significantly inhibiting PGE2 production (36.8 % of control) at a concentration of 5 μg/ml (Figure 1). Another interesting observation was that Fraction 3, at a concentration of 5 μg/ml, inhibited PGE2 production to a greater extent than the initial ethanol extract of E. pallida at a concentration of 25 μg/ml, indicating the importance of enriching selected constituents and separating them from others using fractionation. When Fraction 3 from E. pallida was diluted from 5 μg/ml to 1 μg/ml, inhibition of PGE2 production was still observable (71.2 % of control, p = 0.07). In a parallel cytotoxicity study it was determined that the fractions from E. pallida were not cytotoxic to the RAW264.7 mouse macrophage cells, indicating that cell death could not account for the observed inhibition of PGE2 production (Figure 1) GC-MS analysis indicated that Fraction 3 contains numerous constituents, including Bauer Ketones 20, 21, 22, 23, and 24 (Figure 2A). Quantification of Bauer Ketones, 20, 21, 23, and 24 present in Fraction 3 yielded concentrations of 0.7 μM, 0.6 μM, 2.6 μM, and 5 μM, respectively. Combinations of quantified Bauer Ketones were analyzed for their ability to inhibit PGE2 production (Figure 2B). This analysis indicated that Bauer Ketones 23 and 24 were the most important of the identified ketones in partially explaining the PGE2 inhibitory capabilities of Fraction 3 from E. pallida. Chemically synthesized Bauer Ketones 20, 21, and 23, which are constituents of E. pallida ethanol extracts and HPLC generated fractions (Figure 3A), were analyzed for their ability to inhibit PGE2 production and NO production at three concentrations (5 μM, 2.5 μM, and 1 μM) to determine if they played a key role in the significant inhibition of PGE2 identified with Fraction 3. It was determined that Bauer Ketones 21 and 23 were capable of significant inhibition of PGE2 (p<0.05) and NO (p<0.0001) production at a concentration as low as 1 μM (Figure 3B).
Figure 1.
(A) Fraction 3 from a 2005 extract of Echinacea pallida (PI631293) significantly inhibited PGE2 production in RAW264.7 cells. The black bars represent PGE2 levels after induction with 1 μg/ml LPS and treatment with an Echinacea fraction or ethanol extract (n = 3). All treatments + LPS were compared to media + DMSO + LPS control that was set at 100 % (2.0 ng/ml). Treatments were also performed without LPS induction showing no significant reduction in PGE2 production (p ≥ 0.21). The treatments without LPS were compared to the media + DMSO control set at 100 % (0.2 ng/ml). Media alone did not inhibit PGE2 production (104 % of control). Baicalein and quercetin were used as positive controls and showed significant inhibition of PGE2 production (p<0.001). Parallel cytotoxicity screens were conducted yielding no significant cytotoxicity with any of the E. pallida fractions (data not shown). * and ** are representative of p<0.05 and p<0.001. Each bar represents % of control ± standard error.
Figure 2.
(A) GC-MS chromatogram of Fraction 3 from E. pallida, identifying key ketones. All identified constituents were confirmed via synthetic standards. (B) Significant inhibition of LPS induced PGE2 production in RAW264.7 cells after treatment with chemically synthesized Bauer Ketones at concentrations present in Fraction 3 from E. pallida. The black bars represent PGE2 levels after induction with 1 μg/ml LPS and treatment with an Echinacea fraction or synthetic Bauer Ketone (n = 3). All treatments + LPS were compared to media + DMSO + LPS control that was set at 100 % (5.6 ng/ml) with the combination of Bauer Ketones 21, 23, and 24 showing significant reduction of PGE2 production (p = 0.032). Treatments were also performed without LPS induction and compared to the media + DMSO control set at 100 % (0.03 ng/ml) and no significant changes were observed with any of the treatments in this comparison. Media alone did not inhibit PGE2 production (99 % of control). * and ** are representative of p<0.05 and p<0.001. Each bar represents % of control ± standard error. Quercetin was used as the positive control.
Figure 3.
(A) Structures and nomenclature for Bauer Ketones identified in Fraction 3 from E. pallida. (B) Significant inhibition of LPS induced PGE2 and NO production in RAW264.7 cells after treatment with chemically synthesized Bauer Ketones 21 and 23. The black bars represent PGE2 levels and the white bars represent NO levels after induction with 1 μg/ml LPS and treatment with a ketone (n = 3). All treatments + LPS were compared to media + DMSO + LPS control that was set at 100 % PGE2 production (3.7 ng/ml) and NO production (12.4 ng/ml). Treatments were also performed without LPS induction showing significant reduction of PGE2 production with Bauer Ketone 21 at 1 μM (p = 0.046). The treatments without LPS were compared to the media + DMSO control set at 100 % PGE2 production (0.02 ng/ml). There was no significant difference in NO production in treatments without LPS. Quercetin was used as a positive control for both studies and showed significant inhibition of PGE2 and NO production (p<0.0001). * and ** are representative of p<0.05 and p<0.001. Each bar represents % of control ± standard error. Parallel cytotoxicity screens were conducted yielding no significant cytotoxicity with any of the chemically synthesized Bauer Ketones (data not shown)
Fractionation of a Soxhlet ethanol extract of E. purpurea yielded seven fractions, none of which were able to significantly inhibit PGE2 production and none were found to be cytotoxic (Table 1).
Table 1.
Inhibition of LPS induced PGE2 production and cytotoxicity analysis after treatments with E. purpurea and E. tennesseensis fractionsa
| Anti-inflammatory (PGE2) | Cytotoxicity | |||||
|---|---|---|---|---|---|---|
| Species Fraction Accession | Concentration (μg/ml) | % of Control ± SE | p-value | Concentration (μg/ml) | % Control ± SE | p-value |
| E. purpurea Fraction 1 PI631307 | 274 | 122. ± 22 | 0.62 | 274 | 101 ± 2 | 0.81 |
| E. purpurea Fraction 2 PI631307 | 89 | 134 ± 10 | 0.38 | 89 | 98 ± 3 | 0.49 |
| E. purpurea Fraction 3 PI631307 | 75 | 65 ± 21 | 0.08 | 75 | 105 ± 2 | 0.23 |
| E. purpurea Fraction 4 PI631307 | 41 | 112 ± 11 | 0.75 | 41 | 98 ± 4 | 0.56 |
| E. purpurea Fraction 5 PI631307 | 95 | 118 ± 21 | 0.68 | 95 | 96 ± 2 | 0.33 |
| E. purpurea Fraction 6 PI631307 | 96 | 123 ± 15 | 0.56 | 96 | 101 ± 4 | 0.87 |
| E. purpurea Fraction 7 PI631307 | 23 | 137 ± 39 | 0.53 | 23 | 94 ± 1 | 0.14 |
| E. purpurea Ethanol Extract PI631307 | 25 | 48 ± 13 | 0.02 | 25 | 105 ± 4 | 1.0 |
| E. tennesseensis Fraction 1 PI631250 | 271 | 87 ± 9 | 0.48 | 577 | 94 ± 3 | 0.11 |
| E. tennesseensis Fraction 2 PI631250 | 0.3 | 109 ± 11 | 0.72 | 0.3 | 96 ± 5 | 0.30 |
| E. tennesseensis Fraction 2 PI631250 | 0.14 | 104 ± 13 | 0.91 | |||
| E. tennesseensis Fraction 3 PI631250 | 41 | 6 ± 2 | <0.0001 | 41 | 96 ± 3 | 0.77 |
| E. tennesseensis Fraction 3 PI631250 | 20 | 24 ± 10 | <0.0001 | |||
| E. tennesseensis Fraction 3 PI631250 | 5 | 90 ± 21 | 0.48 | |||
| E. tennesseensis Fraction 4 PI631250 | 8 | 119 ± 4 | 0.43 | 17 | 97 ± 3 | 0.38 |
| E. tennesseensis Fraction 5 PI631250 | 11 | 128 ± 14 | 0.28 | 23 | 89 ± 3 | 0.01 |
| E. tennesseensis Ethanol Extract PI631250 | 25 | 89 ± 9 | 0.56 | 59 | 89 ± 1 | 0.01 |
HPLC was used to fractionate a 2005 extract of E. purpurea (PI631370) and a 2005 extract of E. tennesseensis (PI631250), yielding no significant inhibition of PGE2 production at concentrations lower than 20 μg/ml. All treatments were compared to media + DMSO control that was set at 100% for both PGE2 analysis and cytotoxicity. For E. purpurea and E. tennesseensis, 100% of control for PGE2 was 1.7 ng/ml and 2.8 ng/ml, respectively. Baicalein (6 μM) was the positive control for the PGE2 assay and ursolic acid (10 μM, 30 μM, 50 μM) was the positive control for the MTS cytotoxicity assay. Each fraction or extract represents three replicates ± standard error for both the PGE2 and cytotoxicity analyses. Cytotoxicity was not performed on dilutions of fractions when the higher concentrations were not cytotoxic.
A Soxhlet ethanol extract of E. tennesseensis, which is a less studied species, was fractionated into five fractions by reverse phase HPLC in order to identify PGE2 inhibitory capabilities. Fraction 3, containing Bauer Alkylamides 12, 13, 14, 16, and 17, was able to significantly inhibit PGE 2 at a concentration of 41 μg/ml or 20 μg/ml, but when the fraction was diluted to 5 μg/ml its inhibitory ability was lost (Table 1). The initial ethanol extract (59 μg/ml) and HPLC Fraction 5 (23 μg/ml) of E. tennesseensis were significantly cytotoxic to the RAW264.7 cells, but due to their inability to significantly inhibit PGE2 production further dilutions were not carried out.
Three Rounds of Bioactivity Guided Fractionation of an E. angustifolia Ethanol Extract
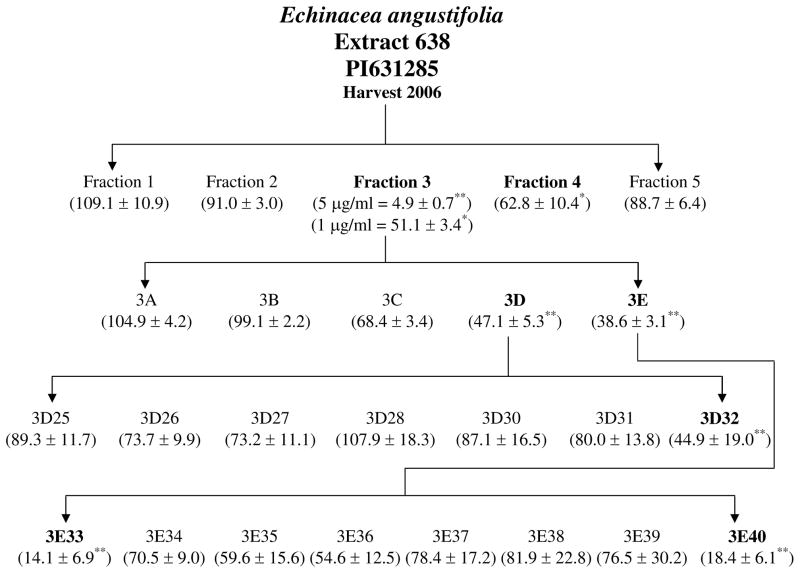
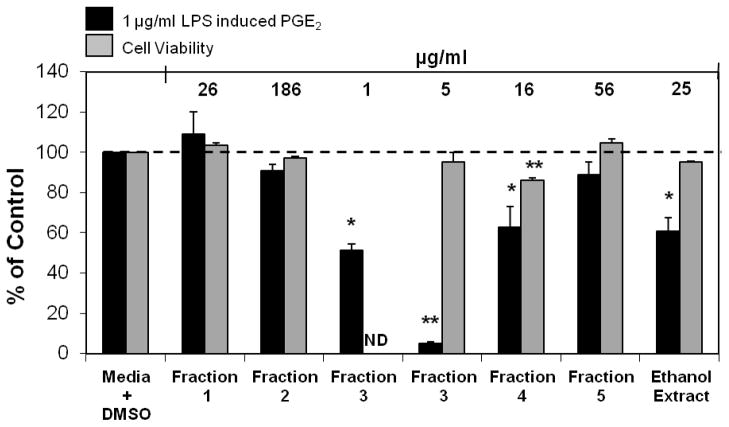
Inhibition of PGE2 production was used to guide three rounds of HPLC fractionation initiated with a Soxhlet ethanol extract of E. angustifolia. Figure 4 outlines the fractionation scheme. The first round of fractionation produced 5 fractions. The alkylamide rich Fraction 3, from E. angustifolia, was shown to significantly inhibit PGE 2 production (51.1 % of control) at a concentration as low as 1 μg/ml (Figure 5). Although fraction 4 had the ability to significantly inhibit PGE2 production at a concentration of 16 μg/ml, it proved to be significantly cytotoxic for the RAW264.7 cells. Therefore, Fraction 3 was identified for further rounds of fractionation.
Figure 4.
Semi-preparative reverse phased HPLC fractionation scheme of E. angustifolia extract from 2006 harvest (PI631285). Bolded fractions represent those showing significant inhibition of LPS induced PGE2 production. Numbers in parenthesis indicate % of control ± standard error of PGE2 production compared to the media + DMSO + LPS control set at 100% PGE2 production. * and ** are representative of p<0.05 and p<0.001. See figures 4–8 for details on PGE2 data including concentrations studied.
Figure 5.
Inhibition of LPS induced PGE2 production and cytotoxicity analysis after treatments with first round fractions from a 2006 extract of E. angustifolia (PI631285) in RAW264.7 cells. The black bars represent PGE2 levels after induction with 1 μg/ml LPS and treatment with an Echinacea fraction or ethanol extract (n = 3). All treatments + LPS were compared to media + DMSO + LPS control that was set at 100 % PGE2 production (2.2 ng/ml). Treatments were also performed without LPS induction showing significant reduction of PGE2 with fractions 1, 3, 4, and ethanol extract (p ≤ 0.035). The treatments without LPS were compared to the media + DMSO control set at 100 % PGE2 production (0.1 ng/ml). Grey bars symbolize cell survival compared to the media + DMSO control set at 100 % cell survival. Baicalein was used as the positive control in the PGE2 analysis and showed significant inhibition of PGE2 production (p<0.0001). ND indicates analysis not determined. Ursolic acid was used as a positive control in the cytotoxicity assay and showed significant cell death at 30 μM and 50 μM (p<0.0001). Media alone was also used as a negative control showing no significant inhibition of PGE2 or cytotoxicity. * and ** are representative of p<0.05 and p<0.001. Since Fraction 3 showed no cytotoxicity at 5 μg/ml it was not assessed for cytotoxicity at 1 μg/ml. Each bar represents % of control ± standard error.
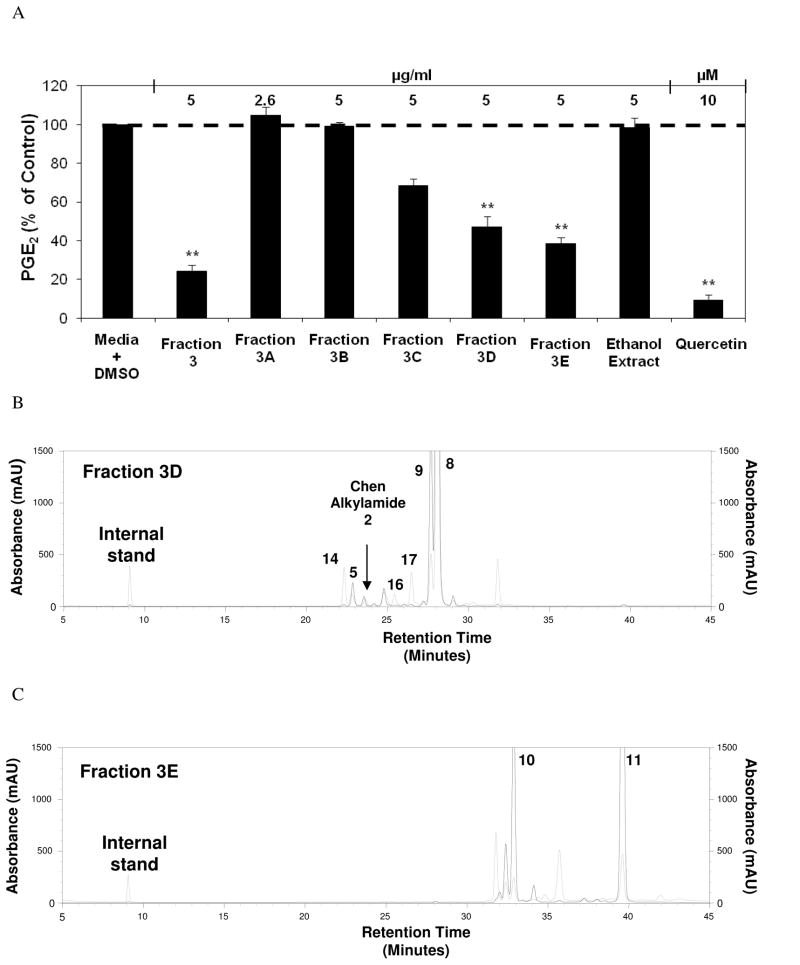
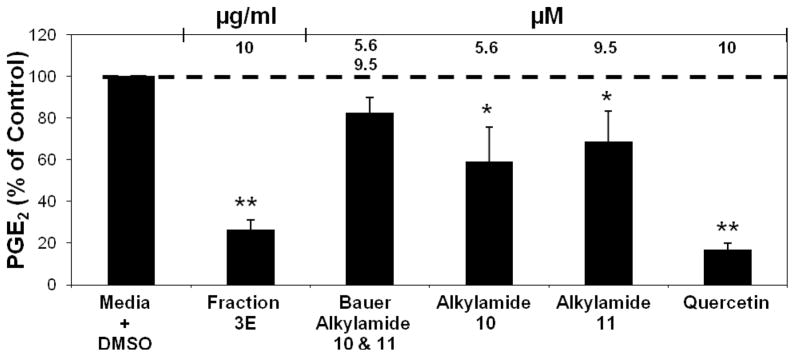
The second round of fractionation, initiated with Fraction 3 from the previous round, yielded five second-round fractions labeled 3A through 3E. Of these, Fractions 3D and 3E, at a concentration of 5 μg/ml, significantly inhibit PGE2 production at 47.1 % and 38.6 % of control, respectively, without any obvious cytotoxicity (Figure 6A). HPLC analysis of solids from 0.15 mg second round fractions 3D and 3E led to the detection of several alkylamides (as detected by absorbance at 260 nm) in Fraction 3D (Figure 6B), and identification of Bauer Alkylamides 10 and 11 in Fraction 3E (Figure 6C). Concentrations of Bauer Alkylamides 10 and 11 were estimated in Fraction 3E from the HPLC analysis at 5.62 and 9.48 μM, respectively (Table 2). PGE2 production was analyzed to determine whether these chemically synthesized Bauer Alkylamides, individually or in combination at the concentrations detected in Fraction 3E were able to explain the inhibition of PGE2 production observed with Fraction 3E. The combination of Bauer Alkylamides 10 and 11 at the concentrations detected by the HPLC analysis of Fraction 3E, inhibited PGE 2 production 82.6% of control, which indicates therefore that the two alkylamides could not be the sole components responsible for the observed bioactivity of fraction 3E (Figure 7). In these experiments, cell viability was not significantly different than the media + DMSO control. It was interesting to note that synthetic Bauer Alkylamides 10 and 11 when screened alone in the PGE2 production assay, were significantly inhibitory at the concentrations found in Fraction 3E, but additive effects were not detected in the PGE2 production screen. The combination of alkylamides found in Fraction 3D was not carried out as Fraction 3E was more effective at inhibiting PGE2 production and there were several other alkylamides identified in Fraction 3D, many of which are not synthetically available.
Figure 6.
(A) Inhibition of LPS induced PGE2 production in RAW264.7 cells after treatments with second round fractions from Fraction 3 of E. angustifolia (from figure 4). The bars represent PGE2 levels after induction with 1 μg/ml LPS and treatment with an Echinacea fraction or ethanol extract (n = 3). All treatments + LPS were compared to media + DMSO + LPS control that was set at 100 % PGE2 production (1.8 ng/ml). Treatments were also performed without LPS induction showing significant reduction of PGE2 with Fraction 3 and 3E (p ≤ 0.029). The treatments without LPS were compared to the media + DMSO control set at 100 % PGE2 production (0.1 ng/ml). Baicalein and quercetin were used as positive controls. Parallel cytoxicity screens were conducted yielding no significant cytotoxicity with any of the fractions (Data not shown). * and ** are representative of p<0.05 and p<0.001. Each bar represents % of control ± standard error. (B) HPLC chromatograms of second round Fractions 3D and (C) 3E, identifying key alkylamides (Quantification from HPLC present in Table 2). Black lines represent 260 nm and grey lines represent 330 nm. The internal standard used for both (B) and (C) was N-isobutylundeca-2-ene-8,10-diynamide (C15H21O2).
Table 2.
HPLC analysis of the constituents found in E. angustifolia Fractions 3D and 3Ea
| Fraction 3D | Fraction 3E | |||
|---|---|---|---|---|
| Metabolite Concentration | Metabolite Concentration | |||
| Metabolite | (μg/ml) | (μM) | (μg/ml) | (μM) |
| Chen Alkylamide 2 | 0.7 | 0.2 | 0.0 | 0.0 |
| Bauer Alkylamide 5 | 2.1 | 0.5 | 0.0 | 0.0 |
| Bauer Alkylamide 8 | 36.6 | 9.0 | 0.0 | 0.0 |
| Bauer Alkylamide 9 | 15.3 | 3.8 | 0.0 | 0.0 |
| Bauer Alkylamide 10 | 0.0 | 0.0 | 22.6 | 5.6 |
| Bauer Alkylamide 11 | 0.1 | 0.03 | 37.8 | 9.5 |
| Bauer Alkylamide 14 | 2.1 | 0.5 | 0.0 | 0.0 |
| Bauer Alkylamide 16 | 0.8 | 0.2 | 0.0 | 0.0 |
| Bauer Alkylamide 17 | 1.7 | 0.5 | 0.0 | 0.0 |
Figure 7.
Combination of Bauer Alkylamides 10 and 11 at the concentrations found in fraction 3E (Table 2). The bars represent PGE2 levels after induction with 1 μg/ml LPS and treatment with an Echinacea fraction (n = 3). All treatments + LPS were compared to media + DMSO + LPS control that was set at 100 % PGE2 production (4.4 ng/ml). Treatments were also performed without LPS induction showing significant reduction of PGE2 with fraction 3E (p = 0.0275). The treatments without LPS were compared to the media + DMSO control set at 100 % PGE2 production (0.2 ng/ml). Quercetin was used as the positive control. * and ** are representative of p<0.05 and p<0.001. Each bar represents % of control ± standard error.
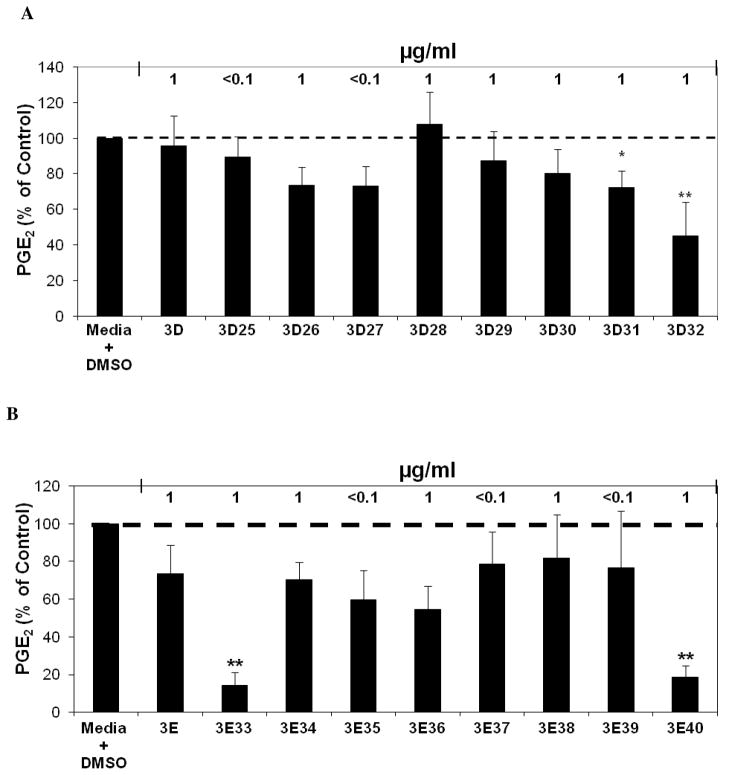
A third round of HPLC fractionation was carried out starting with the material from second round fractions 3D and 3E to further elucidate key constituents found in E. angustifolia that contribute to the inhibition of PGE2 production. Fractionation of Fractions 3D and 3E each produced eight fractions labeled Fractions 3D25 through 3D32 and Fractions 3E33 through 3E40, respectively. One of these, Fraction 3D32 was significantly inhibitory of PGE2 production (44.9 % of control) at a concentration of 1 μg/ml (Figure 8A). The fractionation of Fraction 3E produced two fractions that significantly inhibited PGE2 production at a concentration of 1 μg/ml, Fraction 3E33 that inhibited PGE2 production at 14.1 % of control, and Fraction 3E40 that inhibited PGE2 production at 18.4 % of control (Figure 8B). These third round fractions were not significantly cytotoxic to the RAW264.7 mouse macrophage cells.
Figure 8.
(A) Inhibition of LPS induced PGE2 production analysis after treatments with E. angustifolia third round D fractions. The black bars represent PGE2 levels after induction with 1 μg/ml LPS and treatment with an Echinacea fraction or ethanol extract (n = 3). All treatments + LPS were compared to media + DMSO + LPS control that was set at 100 % PGE2 production (2.8 ng/ml). Treatments were also performed without LPS induction showing significant reduction of PGE2 with Fractions 3D, 3D26, 3D27, 3D30, and 3D31 (p ≤ 0.04). The treatments without LPS were compared to the media + DMSO control set at 100 % PGE2 production (0.2 ng/ml). Baicalein was used as a positive control (p<0.05). Parallel cytoxicity screens were conducted yielding no significant cytotoxicity with any of the third round fractions. * and ** are representative of p<0.05 and p<0.001. Each bar represents % of control ± standard error. (B) Inhibition of LPS induced PGE2 production after treatments with E. angustifolia third round E fractions. The black bars represent PGE2 levels after induction with 1 μg/ml LPS and treatment with an Echinacea fraction or ethanol extract (n = 3). All treatments + LPS were compared to media + DMSO + LPS control that was set at 100 % PGE2 production (1.9 ng/ml). Treatments were also performed without LPS induction showing significant reduction of PGE2 with fractions 3E, 3E33, 3E34, 3E36, 3E37, and 3E38 (p ≤0.027). The treatments without LPS were compared to the media + DMSO control set at 100 % PGE2 production (0.1 ng/ml). Baicalein was used as a positive control (p<0.05). Parallel cytoxicity screens were conducted yielding no significant cytotoxicity with any of the third round fractions. * and ** are representative of p<0.05 and p<0.001. Each bar represents % of control ± standard error.
GC-MS Analysis of Selected Third Round E. angustifolia Fractions
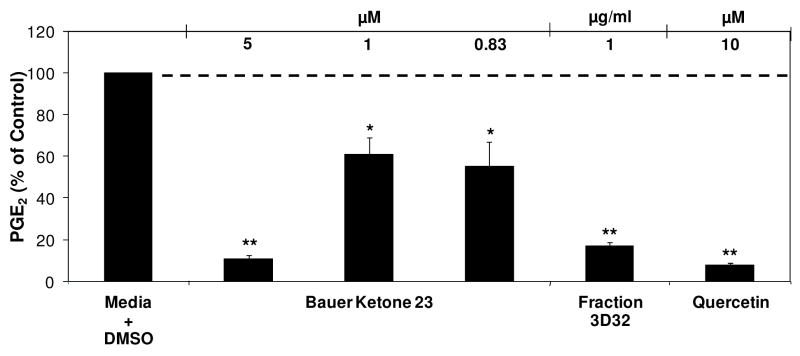
Selected fractions from the third round fractionation of E. angustifolia were analyzed by GC-MS based on their activity in the PGE2 production assay (Table 3). Fractions 3D32, 3E33 and 3E40 were selected for GC-MS analysis due to their ability to significantly inhibit PGE2 production at a concentration of 1 μg/ml. Two fractions, Fraction 3D28 and 3E38, were also selected for further analysis because they were fractions that did not significantly inhibit PGE2 production. These analyses, determined that Bauer Ketone 23 is a major constituent of Fraction 3D32, occurring at a concentration of 0.83 μM. Bauer Ketone 23 and Bauer Alkylamide 10 were detected in 1 μg/ml of Fraction 3E33 at concentrations of 0.15 μM and 0.25 μM, respectively and Bauer Alkylamide 11 was quantified to be present at a concentration of 3.55 μM in Fraction 3E40.
Table 3.
GC-MS analysis of selected third round E. angustifolia fractionsa
| Echinacea angustifolia Fraction | Compound Identified | % of Fraction by Dry Weight | Approximate Concentration of Compound (μg) | Approximate Concentration of Compound (μM) |
|---|---|---|---|---|
| 3D28 | Bauer Alkylamide 8–9 | 18 | 0.18 | 0.64 |
| 3D32 | Bauer Ketone 23 | 75 | 0.75 | 0.83 |
| 3E33 | Bauer Alkylamide 10 | 34 | 0.34 | 0.15 |
| Bauer Ketone 23 | 12 | 0.12 | 0.25 | |
| 3E38 | Bauer Alkylamide 11 | 87 | 0.87 | 3.47 |
| 3E40 | Bauer Alkylamide 11 | 96 | 0.96 | 3.55 |
GC-MS analysis identified constituents present in 1 μg/ml of third round fractions, as well as the metabolites concentration. All identified constituents were confirmed via synthetic standards.
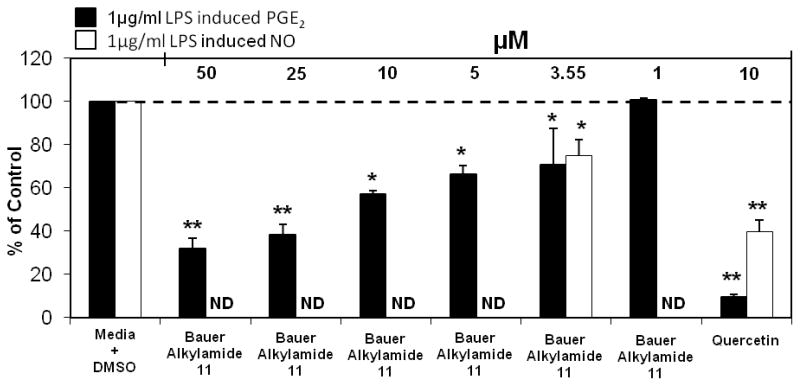
Combinations of synthetic constituents and individual synthetic constituents, identified to be present through GC-MS analysis of these third round HPLC fractions were screened for their ability to modulate PGE2 and NO production at the concentrations present in their respective third round fractions. Synthetic Bauer Ketone 23 was shown to significantly inhibit PGE2 and NO production previously at a concentration of 1 μM (Figure 3B), and after further dilution of Bauer Ketone 23 to the concentration of 0.83 μM inhibition of PGE 2 production remained significant whereas NO production was not significantly inhibited (55.2 % of control and 68.2% of control, respectively) (Figure 9 for PGE2 data). Bauer Ketone demonstrated no cytotoxicity after incubation for 72 hours (109.1% of control). Synthetic Bauer Alkylamide 11, at a concentration of 3.55 μM significantly inhibited PGE2 production (70.6 % of control) and NO production (75.1 % of control) (Figure 10), without any cytotoxicity after a 72 hour incubation (94.1% of control). The combination of synthetic Bauer Alkylamide 10 and Bauer Ketone 23 did not inhibit PGE2 production at the concentrations present in Fraction 3E33 (121.0 % of control). Neither synthetic Bauer Ketone 23 alone nor the combination of Bauer Alkylamide 10 and Bauer Ketone 23 at the concentrations present in the respective bioactive fractions significantly modulated NO production or cell viability (p ≥ 0.09).
Figure 9.
Inhibition of LPS induced PGE2 production after treatment of synthetic Bauer Ketone 23 at concentration present in third round E. angustifolia Fraction 3D32. The black bars represent PGE2 levels after induction with 1 μg/ml LPS and with the ketone or fraction (n = 3). All treatments + LPS were compared to media + DMSO + LPS control that was set at 100 % PGE2 production (3.8 ng/ml). Treatments were also performed without LPS induction showing no significant differences in PGE2 production. Quercetin was used as a positive control. * and ** are representative of p<0.05 and p<0.001. Each bar represents % of control ± standard error. A parallel cytotoxicity screen was conducted yielding no significant cytotoxicity with Bauer Ketone 23 at the concentrations measured (data not shown).
Figure 10.
Significant inhibition of LPS induced PGE2 and NO production in RAW264.7 cells after treatment with chemically synthesized Bauer Alkylamide 11. The black bars represent PGE2 levels and the white bars represent NO levels after induction with 1 μg/ml LPS and treatment with alkylamide (n = 3). All treatments + LPS were compared to media + DMSO + LPS control that was set at 100 % PGE2 production (4.7 ng/ml) and NO production (11.6 ng/ml). Treatments were also performed without LPS induction showing no significant differences in PGE2 or NO production. ND indicates analysis not determined. Quercetin was used as a positive control for both studies and showed significant inhibition of PGE2 and NO production at 10 μM (p<0.0001). * and ** are representative of p<0.05 and p<0.001. Each bar represents % of control ± standard error. Parallel cytotoxicity screens were conducted yielding no significant cytotoxicity with Bauer Alkylamide 11 at the concentrations screened (data not shown).
Although identified alkylamides and ketones found in these bioactive fractions were stable under our storage and experimental conditions (analyzed by GC-MS), instability of bioactivity was identified with these third round bioactive fractions of E. angustifolia. Thus, although these fractions were significantly bioactive when initially assayed soon after fractionation, in February 2007, when these fractions were re-assayed for bioactivity when the synthesis of Bauer Alkylamides and Ketones became available in 2008, these fractions did not retain the same level of inhibitory activity in the PGE2 production assay at the concentrations previously analyzed (Table 4).
Table 4.
Change in PGE2 activity over storage time with third round E. angustifolia fractions
| E. angustifolia Fraction | PGE2 production (% of control) August 2007 | PGE2 production (% of control) June 2008 |
|---|---|---|
| 3E33 | 14.1 ± 6.9** | 133.1 ± 43.5 |
| 3E40 | 18.4 ± 6.1** | 81.0 ± 3.9 |
indicates significant p-value <0.0001. Bauer Alkylamides and Ketones identified to be present in Table 3 were quantified prior to PGE2 analysis in 2007 and again after PGE2 analysis in 2008 yielding no difference in these constituent concentrations. Data represents % of control ± standard error, with 100 % of control for 2007 Fractions 3E33 and 3E40 at 1.9 ng/ml and for 2007 Fraction 3E33 and 3E40 at 3.5 ng/ml and 4.7 ng/ml, respectively.
Discussion
The study reported here illustrates the important role Echinacea alkylamides and ketones play in the inhibition of the production of inflammatory mediators and the complexities associated with the examination of these interacting constituents. The significant discoveries from the present study are the identification of Bauer Ketones 21 and 23 as potential anti-inflammatory agents capable of significant inhibition of PGE2 and NO production at 1 μM concentrations and the finding that chemically synthesized Bauer Ketone 23 and Bauer Alkylamide 11 when screened for inhibition of PGE2 production at concentrations present in their respective E. angustifolia fractions, are capable of inhibiting and partially explaining the significant PGE2 suppression identified with their respective plant derived fractions. Also, Bauer Ketones 23 and 24 were identified as key components responsible for the inhibition of PGE2 identified with E. pallida Fraction 3. Another key observation is that caffeic acid derivatives found in Echinacea are not likely to be key contributors to the inhibition of certain inflammatory mediators due to the fact that these constituents were concentrated in Fraction 1 of all of the species fractionated, and none of these fractions demonstrated the ability to significantly inhibit PGE2 production at concentrations ranging from 26 μg/ml to 329 μg/ml.
Ethanol extracts from E. tennesseensis and E. purpurea were unable to produce fractions capable of inhibiting PGE2 production to a significant degree at concentrations below 5 μg/ml. Therefore, studies on these two species ceased after the first round of fractionation.
Of the four species screened E. pallida and E. angustifolia were expected to produce the most active fractions because of previous results (2) indicating that extracts from these plants were inhibitory in the PGE2 assay. The fractionation conducted with a ketone rich accession of E. pallida provided insight into the anti-inflammatory potential of ketones found in this species. Compared to our previous studies that examined chemically synthesized alkylamides and their ability to inhibit PGE2 production (2), it appears that ketones are able to significantly inhibit this inflammatory endpoint at a much lower concentration. For example, the most potent alkylamide (Bauer Alkylamide 14) was reported to significantly inhibit PGE2 production, at a concentration of 10 μM (2), whereas Bauer Ketone 23 could do so at a concentration of 1 μM. Significant cytotoxicity was not identified for any of the Bauer Ketones screened at concentrations below 20 μM, coinciding with a recent cell viability study reporting that Bauer Ketone 21 had IC50 values of >100 μM and 80.13 μM in human pancreatic and colorectal adenocarcinoma cells, respectively (10). By examining the ability of selected polyacetylenes isolated from n-hexane extracts of E. pallida to cross the Caco-2 monolayer, this study also provided evidence that Bauer Ketones 22 and 24 are likely to be bioavailable, with apparent permeabilities of 32 × 10−6 cms−1 and 10 × 10−6 cms−1, respectively (10). Therefore, these results warrant further elucidation with ketones found in other species of Echinacea to identify their full anti-inflammatory potential.
Previous studies have shown that Echinacea polyacetylenes, generically called ketones, were able to modulate the multidrug transporter P-glycoprotein (Pgp), which bestows resistance to anticancer chemotherapy when highly expressed in cancer cells. In a human kidney cell line (HK-2), made to constitutively over express high and constant levels of Pgp, it was determined through a bioassay-guided fractionation of an E. pallida extract that Bauer Ketone 24 decreased the efflux of the Pgp probe calcein-AM by three-fold compared to the control at a concentration of 30 μM (21). To our knowledge there are no reports regarding the anti-inflammatory potential of the Bauer Ketones, yet there are studies describing anti-inflammatory effects of polyacetylenes in other species. For example, polyacetylenes of Daucus carota L. have been shown to inhibit LPS induced nitric oxide production in the RAW264.7 macrophage cell line (22) and polyacetylene spiroketals from Plagius flosculosus have been identified to inhibit LPS induced IL-1, IL-6, TNF-α, and PGE2 production, as well as inhibit the degradation of IkB and further DNA binding of NF-kB (23).
Echinacea angustifolia, classified as one of the three Echinacea medicinal species, has been featured in other studies due to its alkylamide rich composition (2, 24, 25). The first round of HPLC fractionation of the ethanol extract of E. angustifolia yielded one fraction, Fraction 3, which inhibited PGE2 production by 51.1% of control at a concentration of 1 μg/ml, therefore establishing a rationale for additional fractionation. Results from the second round of HPLC fractionation yielded two fractions, Fraction 3D and 3E, which significantly inhibited PGE2 production. Multiple alkylamides were identified in Fraction 3D, which made this fraction an excellent candidate for further fractionation.
HPLC analysis of Fraction 3E indicated the occurrence of two highly abundant alkylamides, Bauer Alkylamides 10 and 11, which had previously been chemically synthesized for our studies (2). We hypothesized that Bauer Alkylamides 10 and 11, when combined at concentrations similar to those found in Fraction 3E, could explain that fractions PGE2 inhibitory capabilities. Synthetic Bauer Alkylamide 10 and 11 individually were capable of significant inhibition of PGE2 production at concentrations of 5.6 μM and 9.5 μM, respectively. However, the combination of synthesized Bauer Alkylamides 10 and 11 at concentrations present in Fraction 3E could not explain Fraction 3E’s PGE2 inhibitory capabilities. Previous studies in our lab found that individually, chemically synthesized Bauer Alkylamide 10 and 11 were not capable of significant PGE2 inhibition at concentrations lower than 50 μM. We attribute this significant change in activity to a couple of modifications in our screening protocol. The first major change was using optimal growth conditions for the RAW264.7 cells by setting the incubation humidity to 95% as opposed to our previous studies that used 70% humidity. Second, in the current study we analyze each chemically synthesized preparation prior to its use as an inhibitor of PGE2 production, allowing for impurities in the alkylamide preparations, and normalizing to a concentration at 100% purity; this normalization was not conducted in our previous studies of the inhibition of PGE2 production. These changes have therefore allowed for greater sensitivity in our screening of inflammatory mediators using the RAW264.7 mouse macrophage cell line.
GC-MS analysis of the third round of HPLC fractions of E. angustifolia identified Bauer Ketone 23 to be present in two of these fractions; Fraction 3D32 contained Bauer Ketone 23 at a concentration of 0.83 μM, and several other unidentifiable peaks. To our knowledge this is the first study to identify the presence of Bauer Ketone 23 in E. angustifolia. Bauer Ketone 23 partially explained the inhibition of PGE2 production observed with Fraction 3D32 (44.9 % of control) and can therefore be identified as a key constituent contributing to the immune modulating properties of E. angustifolia and perhaps other species. Chemically synthesized Bauer Alkylamide 11 showed significant inhibition of PGE2 and NO production at the concentration that this alkylamide occurs in Fraction 3E40. Although this constituent appeared to account for approximately 96% of the mass that occurred in this fraction, it only partially explained the PGE2 inhibition observed with its respective fraction. Through these studies, Bauer Alkylamide 11 of E. angustifolia was identified as another key contributor to the suppression of PGE2 and NO. This alkylamide was shown to have bioactivities at concentrations relevant to those found in the plant extracts and contributed to anti-inflammatory properties throughout an inflammatory response measured via PGE2 production at eight hours and nitric oxide production at 24 hours after induction with LPS to induce the mouse macrophage cells. Chen et al. previously identified Bauer Alkylamide 11 as an inhibitor of NO production in the RAW264.7 cells with an ID50 of 23.9 μM (3) and our studies add to this by determining that inhibition of NO production can be accomplished at alkylamide concentrations available in E. angustifolia.
Two main observations from these studies have led us to the hypothesis that other unidentified constituents found in Echinacea are critical components to the anti-inflammatory potential of this botanical. First we have demonstrated that individually Bauer Alkylamides and Ketones can significantly inhibit PGE2 and NO production, but only partially explain the activity found in the fractions from the species. Also, when known constituents were combined at concentrations relevant to extracts and partially purified fractions there was no evidence of an additive or synergistic effect on inhibition of PGE2 or NO production. Secondly, although the concentrations of Bauer Alkylamide 10 and 11, and Bauer Ketone 23 did not change over storage time throughout our studies, the most convincing argument for this hypothesis developed through the instability we observed throughout our studies with the bioactivity of E. angustifolia third round fractions. Significant inhibition of PGE2 production was lost after storing selected third round fractions at −20°C for approximately one year, without any significant decrease in the concentrations of Bauer Alkylamides and Ketones. These observations provide evidence to the hypothesis that other unstable constituents contribute to the identified inhibition of PGE2 production
In summary, this research confirmed our previous studies that E. angustifolia and E. pallida are important species of Echinacea for discovering the anti-inflammatory properties of this botanical genus, and further allowed for the identification of constituents that are key contributors to those properties. From the fractionations of E. pallida and E. angustifolia extracts two major compounds, Bauer Alkylamide 11 and Bauer Ketone 23, were identified to play a key role in the inhibition of PGE2 by RAW264.7 mouse macrophage cell model. These constituents were also identified as inhibitors of NO production, indicating that they are important mediators for an extended period throughout the inflammatory response. The analysis of Bauer Ketone 23 at the concentration present in Fraction 3D32, and of Bauer Alkylamide 11 at the concentration present in Fraction 3E40, indicates that more studies should be directed toward the identification and synthesis of known and unknown compounds and the roles they may play, either individually or in concert with known constituents, to modulate mediators of the inflammatory response.
The results obtained from this study may pave the way for the production of Echinacea species that are better suited for anti-inflammatory medicinal purposes. These could be produced through the fabrication of genetically modified plants, the detection of other plant organs and tissues that are rich in specific constituents, or the identification of optimal growth conditions for the enhanced availability of constituents such as Bauer Ketones 21, 23, and 24 and Bauer Alkylamides 10 and 11.
Acknowledgments
The authors would like to thank all members of the Center for Research on Botanical Dietary Supplements at Iowa State University and the University of Iowa for their cooperation and ongoing advice in directing the progress of this research. A special thanks for the gift of Echinacea plant material from the North Central Regional Plant Introduction Station at Iowa State University (Ames, IA). The authors would also like to acknowledge George Kraus and Jaehoon Bae for providing the chemically synthesized alkylamides and ketones for this study.
Note
This publication was made possible by grant number P01 ES012020 from the National Institute of Environmental Health Sciences (NIEHS) and the Office of Dietary Supplements (ODS), National Institutes of Health (NIH) and grant number 9P50AT004155–06 from the National Center for Complementary and Alternative Medicine (NCCAM) and ODS, NIH. Its contents are solely the responsibility of the authors and do not necessarily represent the official views of the NIEHS, NCCAM, or NIH.
Abbreviations Used
- E
Echinacea
- PI
Plant Introduction
- DMSO
Dimethyl Sulfoxide
- PGE2
Prostaglandin E2
- NO
Nitric Oxide
- LPS
Lipopolysaccharide
- GC-MS
Gas Chromatography Mass Spectrometry
- HPLC
High Performance Liquid Chromatography
- ID50
Inhibition Dose producing 50 % inhibition
Footnotes
Safety
LPS compounds are pyrogenic and should not be inhaled or allowed to enter the bloodstream.
Contributor Information
Carlie A. LaLone, Email: peck0060@iastate.edu.
Ludmila Rizshsky, Email: ludmilar@iastate.edu.
Kimberly D.P. Hammer, Email: kdhammer@wisc.edu.
Lankun Wu, Email: lkwu@iastate.edu.
Avery K.S. Solco, Email: avery@tamu.edu.
Manyu Yum, Email: myum@iastate.edu.
Basil J. Nikolau, Email: dimmas@iastate.edu.
Eve S. Wurtele, Email: mash@iastate.edu.
Patricia A. Murphy, Email: pmurphy@iastate.edu.
Meehye Kim, Email: meehkim@kfda.go.kr.
Literature Cited
- 1.Blumenthal M, Ferrier G, Cavaliere C. Total Sales of Herbal Supplements in United States Show Steady Growth. The Journal of the American Botanical Council. 2006;71:64–66. [Google Scholar]
- 2.LaLone CA, Hammer KD, Wu L, Bae J, Leyva N, Liu Y, Solco AK, Kraus GA, Murphy PA, Wurtele ES, Kim OK, Seo KI, Widrlechner MP, Birt DF. Echinacea species and alkamides inhibit prostaglandin E(2) production in RAW264.7 mouse macrophage cells. J Agric Food Chem. 2007;55(18):7314–22. doi: 10.1021/jf063711a. [DOI] [PMC free article] [PubMed] [Google Scholar]
- 3.Chen Y, Fu T, Tao T, Yang J, Chang Y, Wang M, Kim L, Qu L, Cassady J, Scalzo R, Wang X. Macrophage activating effects of new alkamides from the roots of Echinacea species. J Nat Prod. 2005;68(5):773–6. doi: 10.1021/np040245f. [DOI] [PubMed] [Google Scholar]
- 4.Clifford LJ, Nair MG, Rana J, Dewitt DL. Bioactivity of alkamides isolated from Echinacea purpurea (L.) Moench. Phytomedicine. 2002;9(3):249–53. doi: 10.1078/0944-7113-00105. [DOI] [PubMed] [Google Scholar]
- 5.Zhai Z, Haney D, Wu L, Solco A, Murphy PA, Wurtele ES, Kohut ML, Cunnick JE. Alcohol extracts of Echinacea inhibit production of nitric oxide and tumor necrosis factor-alpha by macrophages in vitro. Food Agric Immunol. 2007;18(3–4):221–236. doi: 10.1080/09540100701797363. [DOI] [PMC free article] [PubMed] [Google Scholar]
- 6.Hinz B, Woelkart K, Bauer R. Alkamides from Echinacea inhibit cyclooxygenase-2 activity in human neuroglioma cells. Biochem Biophys Res Commun. 2007;360(2):441–6. doi: 10.1016/j.bbrc.2007.06.073. [DOI] [PubMed] [Google Scholar]
- 7.Gertsch J, Schoop R, Kuenzle U, Suter A. Echinacea alkylamides modulate TNF-alpha gene expression via cannabinoid receptor CB2 and multiple signal transduction pathways. FEBS Lett. 2004;577(3):563–9. doi: 10.1016/j.febslet.2004.10.064. [DOI] [PubMed] [Google Scholar]
- 8.Raduner S, Majewska A, Chen JZ, Xie XQ, Hamon J, Faller B, Altmann KH, Gertsch J. Alkylamides from Echinacea are a new class of cannabinomimetics. Cannabinoid type 2 receptor-dependent and -independent immunomodulatory effects. J Biol Chem. 2006;281(20):14192–206. doi: 10.1074/jbc.M601074200. [DOI] [PubMed] [Google Scholar]
- 9.Dalby-Brown L, Barsett H, Landbo AK, Meyer AS, Molgaard P. Synergistic antioxidative effects of alkamides, caffeic acid derivatives, and polysaccharide fractions from Echinacea purpurea on in vitro oxidation of human low-density lipoproteins. J Agric Food Chem. 2005;53(24):9413–23. doi: 10.1021/jf0502395. [DOI] [PubMed] [Google Scholar]
- 10.Chicca A, Pellati F, Adinolfi B, Matthias A, Massarelli I, Benvenuti S, Martinotti E, Bianucci AM, Bone K, Lehmann R, Nieri P. Cytotoxic activity of polyacetylenes and polyenes isolated from roots of Echinacea pallida. Br J Pharmacol. 2008;153(5):879–85. doi: 10.1038/sj.bjp.0707639. [DOI] [PMC free article] [PubMed] [Google Scholar]
- 11.Barnes J, Anderson LA, Gibbons S, Phillipson JD. Echinacea species (Echinacea angustifolia (DC.) Hell. Echinacea pallida (Nutt.) Nutt. Echinacea purpurea (L.) Moench): a review of their chemistry, pharmacology and clinical properties. J Pharm Pharmacol. 2005;57(8):929–54. doi: 10.1211/0022357056127. [DOI] [PubMed] [Google Scholar]
- 12.Cech NB, Eleazer MS, Shoffner LT, Crosswhite MR, Davis AC, Mortenson AM. High performance liquid chromatography/electrospray ionization mass spectrometry for simultaneous analysis of alkamides and caffeic acid derivatives from Echinacea purpurea extracts. J Chromatogr A. 2006;1103(2):219–28. doi: 10.1016/j.chroma.2005.11.008. [DOI] [PubMed] [Google Scholar]
- 13.Molgaard P, Johnsen S, Christensen P, Cornett C. HPLC method validated for the simultaneous analysis of cichoric acid and alkamides in Echinacea purpurea plants and products. J Agric Food Chem. 2003;51(24):6922–33. doi: 10.1021/jf026158f. [DOI] [PubMed] [Google Scholar]
- 14.Romero FR, Delate K, Hannapel DJ. The effect of seed source, light during germination, and cold-moist stratification on seed germination in three species of Echinacea for organic production. HortScience. 2005;40(6):1751–1754. [PMC free article] [PubMed] [Google Scholar]
- 15.Liu Y, Murphy PA. Alkamide stability in Echinacea purpurea extracts with and without phenolic acids in dry films and in solution. J Agric Food Chem. 2007;55(1):120–6. doi: 10.1021/jf0619481. [DOI] [PMC free article] [PubMed] [Google Scholar]
- 16.Livesey J, Awang DV, Arnason JT, Letchamo W, Barrett M, Pennyroyal G. Effect of temperature on stability of marker constituents in Echinacea purpurea root formulations. Phytomedicine. 1999;6(5):347–9. doi: 10.1016/S0944-7113(99)80057-9. [DOI] [PubMed] [Google Scholar]
- 17.McCann DA, Solco A, Liu Y, Macalusa F, Murphy PA, Kohut ML, Senchina DS. Cytokine- and interferon-modulating properties of Echinacea spp. root tinctures stored at −20 degrees C for 2 years. J Interferon Cytokine Res. 2007;27(5):425–36. doi: 10.1089/jir.2006.0104. [DOI] [PMC free article] [PubMed] [Google Scholar]
- 18.Kraus GA, Bae J, Wu L, Wurtele E. The synthesis and natural distribution of the major ketone constituents in Echinacea pallida. Molecules. 2007;12(3):406–14. doi: 10.3390/12030406. [DOI] [PMC free article] [PubMed] [Google Scholar]
- 19.Bae J. Synthesis of the natural compounds in Echinacea. Iowa State University; Ames, IA: 2006. [Google Scholar]
- 20.Hammer KD, Hillwig ML, Solco AK, Dixon PM, Delate K, Murphy PA, Wurtele ES, Birt DF. Inhibition of prostaglandin E(2) production by anti-inflammatory hypericum perforatum extracts and constituents in RAW264.7 Mouse Macrophage Cells. J Agric Food Chem. 2007;55(18):7323–31. doi: 10.1021/jf0710074. [DOI] [PMC free article] [PubMed] [Google Scholar]
- 21.Romiti N, Pellati F, Nieri P, Benvenuti S, Adinolfi B, Chieli E. P-Glycoprotein inhibitory activity of lipophilic constituents of Echinacea pallida roots in a human proximal tubular cell line. Planta Med. 2008;74(3):264–6. doi: 10.1055/s-2008-1034308. [DOI] [PubMed] [Google Scholar]
- 22.Metzger BT, Barnes DM, Reed JD. Purple carrot (Daucus carota L.) polyacetylenes decrease lipopolysaccharide-induced expression of inflammatory proteins in macrophage and endothelial cells. J Agric Food Chem. 2008;56(10):3554–60. doi: 10.1021/jf073494t. [DOI] [PubMed] [Google Scholar]
- 23.Calzado MA, Ludi KS, Fiebich B, Ben-Neriah Y, Bacher S, Munoz E, Ballero M, Prosperini S, Appendino G, Schmitz ML. Inhibition of NF-kappaB activation and expression of inflammatory mediators by polyacetylene spiroketals from Plagius flosculosus. Biochim Biophys Acta. 2005;1729(2):88–93. doi: 10.1016/j.bbaexp.2005.04.007. [DOI] [PubMed] [Google Scholar]
- 24.Farinacci M, Colitti M, Stefanon B. Modulation of ovine neutrophil function and apoptosis by standardized extracts of Echinacea angustifolia, Butea frondosa and Curcuma longa. Vet Immunol Immunopathol. 2009;128(4):366–73. doi: 10.1016/j.vetimm.2008.11.024. [DOI] [PubMed] [Google Scholar]
- 25.Zhai Z, Solco A, Wurtele E, Kohut ML, Murphy PA, Cunnick JE. Echinacea increases arginase activity and has anti-inflammatory properties in RAW264.7 macrophage cells, indicative of alternative macrophage activation. J Ethnopharmacol. 2009;122(1):76–85. doi: 10.1016/j.jep.2008.11.028. [DOI] [PMC free article] [PubMed] [Google Scholar]


