

Abstract
The Vaccine Research Center has developed vaccine candidates for different diseases/infectious agents (including HIV-1, Ebola, and Marburg viruses) built on an adenovirus vector platform, based on adenovirus type 5 or 35. To support clinical development of each vaccine candidate, pre-clinical studies were performed in rabbits to determine where in the body they biodistribute and how rapidly they clear, and to screen for potential toxicities (intrinsic and immunotoxicities). The vaccines biodistribute only to spleen, liver (Ad5 only), and/or iliac lymph node (Ad35 only) and otherwise remain in the site of injection muscle and overlying subcutis. Though ∼1011 viral particles were inoculated, already by Day 9, all but 103 to 105 genome copies per μg of DNA had cleared from the injection site muscle. By three months, the adenovector was cleared with, at most, a few animals retaining a small number of copies in the injection site, spleen (Ad5), or iliac lymph node (Ad35). This pattern of limited biodistribution and extensive clearance is consistent regardless of differences in adenovector type (Ad5 or 35), manufacturer's construct and production methods, or gene-insert. Repeated dose toxicology studies identified treatment-related toxicities confined primarily to the sites of injection, in certain clinical pathology parameters, and in body temperatures (Ad5 vectors) and food consumption immediately post-inoculation. Systemic reactogenicity and reactogenicity at the sites of injection demonstrated reversibility. These data demonstrate the safety and suitability for investigational human use of Ad5 or Ad35 adenovector-based vaccine candidates at doses of up to 2 × 10¹¹ given intramuscularly to prevent various infectious diseases.
Keywords: Adenovirus vector, Adenovirus Type 5, Adenovirus Type 35, HIV-1, Ebola, Marburg, Biodistribution, Repeated Dose Toxicology, Safety, Vaccine
Introduction
Adenovirus (Ad) vectored vaccine candidates are a novel product class that began to be tested clinically for preventive infectious disease indications starting in the early 2000s. Initial candidates were based on adenovirus type 5 (Ad5); however, newer pre-clinical and clinical candidates are based on alternative adenovirus serotypes, such as Ad35, or on chimeric constructs designed with the intention of circumventing the high degree of pre-existing immunity to Ad5 in the human population, should this factor or other safety issues prove to reduce the utility of the Ad5 vectors currently in clinical testing (Thorner et al., 2006). This novel product class represents a unique regulatory challenge. In order to advance pre-clinical candidates forward into the clinic, pre-clinical safety evaluations need to be conducted to determine where in the body the adenovectors would biodistribute after intramuscular inoculation (in order to identify potential target organs for toxicity) and whether any toxicological effects could be identified. Such effects might either be as a direct (intrinsic) toxicity from the adenovectors or as immunotoxicity resulting from the host immune response to the vaccine insert or adenovector antigens (for a brief discussion about vaccine-induced immunotoxicity, see Sheets et al., 2006b).
Frequent vaccine-induced adverse reactions or toxicities are generally referred to as “reactogenicity” and they will be referred to this way throughout this article. These can include local reactions at the site of injection, such as pain, tenderness, erythema, or induration, or systemic reactions, such as fever, fatigue, malaise, myalgia, headache, nausea, vomiting, inappetence, etc. Reactogenicity is often the consequence of intended or unintended immune responses and inflammation induced by the vaccine. Vaccines by and large are safe, as they must be, given that they are administered to healthy individuals to prevent a potential future disease. Most of the side effects seen with vaccines are of this typical type of local and systemic reactogenicity. Thus, preclinical safety assessments of vaccine candidates to support their clinical investigation must address the types and severity of reactogenicity that is expected with vaccines as well as identify any potential safety signals that might be unusual to a particular vaccine candidate.
Rabbits were chosen as the test model for these studies as they are a species large enough to receive a full human dose of vaccine. This is important since the immunogenicity and/or pharmaceutical effect of vaccines does not scale directly to body weight or body surface area, as may be the case for most drugs that disseminate through the blood to other parts of the body. Vaccines act at the local site of injection (if delivered parenterally) to induce an immune response that traffics systemically. Thus, delivery of a full human dose to the animal model is deemed the most suitable means of addressing potential human toxicities (CBER, 2006; Chang et al., 2007). Based on current clinical experience with Ad5 vectors as vaccine candidates, rabbits appear to be a good predictor of the reactogenicity that is being observed in the clinic (Catanzaro et al., 2006). For Ad35, there are not yet sufficient clinical data to validate the rabbit as the appropriate animal model. However, Ad35 as a vaccine vector for tuberculosis and malaria entered clinical trials in late 2006 (Crucell, 2006a, 2006b), so these data will be forthcoming. In addition, the Ad35 vaccine described herein has also entered clinical trials (GenVec, 2007). While Ad5 (a subgroup C Adenovirus) primarily enters cells by binding to the Coxsackie and Adenovirus receptor (CAR), Ad35 (a subgroup B Adenovirus) utilizes CD46 (membrane cofactor protein) as a receptor. The tissue distribution of CD46 expression is reported for a small number of species, but has not yet been elucidated for rabbits. Further, it should be noted that this is not the appropriate animal model for HIV disease or AIDS. Nor is it the appropriate model to assess the effect vaccination might have on subsequent acquisition of HIV (or appropriate model, such as SIV) or disease, as would be assessed in a challenge-protection model. The studies undertaken as reported herein were not intended to model HIV acquisition or disease progression in vaccinated animals, only to assess acute or sub-acute intrinsic toxicities and immunotoxicities, as recommended by regulatory authorities, specifically, the United States Food and Drug Administration (FDA), which has regulatory jurisdiction over the clinical trials we have proposed or performed with these investigational vaccines.
The Vaccine Research Center (VRC) is developing several vaccine candidates to prevent human diseases based on the adenovirus vector platform. These candidate vaccines are intended for use in prevention of diseases caused by viruses including Human Immunodeficiency Virus (HIV-1), Ebola, and Marburg. Inoculation of adenovectors with gene-inserts encoding HIV-1, Ebola, or Marburg proteins results in the in vivo expression of the viral antigens. Strong antigen-specific cellular and humoral immune responses are thus induced (Sullivan et al., 2000; Catanzaro et al., 2006; Sullivan et al., 2006; Sun et al., 2006, unpublished data). In order to provide preclinical data to support the safety and suitability of the candidate vaccines to proceed into human clinical testing, three biodistribution studies and four repeated dose toxicology studies were performed on the four adenovector-based vaccine products that will be described herein. In addition, two of the repeated dose toxicology studies reported were performed delivering the adenovector as a boost to a DNA plasmid vaccine prime. The biodistribution and safety of DNA plasmid vaccines were separately demonstrated and previously reported (Sheets et al., 2006a, 2006b). The methods and study designs reported herein are quite similar to those performed on the DNA plasmid vaccines. The primary difference between the earlier studies and these are that the DNA plasmid vaccines do not biodistribute outside the injection site and primarily result in local reactions. However, like the adenovectors, the biodistribution and toxicology profiles seem to reflect the platform (DNA plasmids or adenovectors) rather than the gene-inserts being expressed.
Materials and Methods
Adenovirus Vector Vaccine Products (Table 1)
TABLE 1.
Products Tested.
| Product | Study | Virus | Genes | Adenovirus type | Vector characteristics | Manufacturer |
|---|---|---|---|---|---|---|
| 14 | A, D | HIV-1 | Clade B gag-pol, Clade A env, Clade B env, Clade C env | 5 | ΔE1, E3, E4 | GenVec |
| 18 | B, E | Ebola | Sudan/Gulu glycoprotein (GP) with point mut., Zaire GP with point mut. | 5 | ΔE1, E3 | Crucell |
| 21 | F | Marburg | Marburg GP | 5 | ΔE1, E3 | Crucell |
| 22 | E | Ebola | Sudan/Gulu. WT GP, Zaire WT GP | 5 | ΔE1, E3 | Crucell |
| 25 | F | Marburg | Marburg GP | DNA plasmid | CMV/R promoter | Althea |
| 27 | C, G | HIV-1 | Clade A env | 35 | ΔE1 | GenVec |
Product 14 (Ad5HIV)
This product is described in Catanzaro et al. (2006), and is produced by GenVec. Dosage of GenVec-produced adenovectors is expressed in terms of particle units (PU). The DNA plasmid prime used with this product was also previously described (Sheets et al., 2006a) and the biodistribution and toxicological safety when given alone were reported (Sheets et al. 2006a, 2006b). The genes expressed by both prime and boost are essentially matched. Clinical safety data for both products administered separately are reported (Catanzaro et al., 2006; Graham et al., 2006) and safety data are being generated for the prime-boost regimen, which is currently being studied in several Phase 1 and 2 trials being conducted in the Americas and Africa.
Product 18 (Ebola)
This product is a combination of 2 adenovectors based on Ad5 and produced by Crucell. These vectors contain deletions in E1 and E3, rendering them replication-defective. The vectors express glycoproteins of Ebola Sudan/Gulu and Zaire strains for which a mutation (mut) that abrogates the cytopathicity observed in vitro with the wild-type sequences (Sullivan et al., 2000, 2005, 2006) has been introduced. Dosage of Crucell-produced adenovectors is expressed in terms of viral particles (VP).
Product 21 (Ad5Marburg)
This product, produced by Crucell, is based on an Ad5 vector, which is deleted in E1 and E3. The gene insert expresses the WT glycoprotein of Marburg virus (Angola strain).
Product 22 (Ebola)
This product is also a combination of 2 adenovectors based on Ad5, produced by Crucell, and expressing the wild-type (WT) glycoproteins of Ebola Sudan/Gulu and Zaire strains. This product differs from Product 18 in that each gene insert expresses unmutated full-length WT sequences.
Product 25 (DNAMarburg)
This product, manufactured by Althea, expresses the same Marburg glycoprotein as Product 21 described above, in a DNA plasmid backbone under the CMV/R promoter (as described in Sheets et al., 2006a for other DNA plasmid vaccine products). This product was delivered by Biojector 2000, as previously described (Sheets et al., 2006a).
Product 27 (Ad35HIV)
This prototype vaccine, also produced by GenVec, encodes only the HIV-1 Clade A env gene (identical to that contained in Product 14) but this gene is inserted into an adenoviral vector system based on Ad35, instead of Ad5. This vector contains deletions in the E1 region, rendering it replication-defective.
Dosage Quantitation of Adenovectors
The difference in units in which the doses are described is due to differences in assay methodology of each manufacturer. Dosage of GenVec-produced adenovectors is expressed in terms of particle units (PU). Dosage of Crucell-produced adenovectors is expressed in terms of viral particles (VP). In both cases what is being measured is the number of physical viral particles, as opposed to an infectious titer, since the adenovectors are replication-defective. The units do not measure a biological function, such as “infectiousness,” but are physical measurement of particles, functional or not.
Biodistribution Study Designs
Studies A, B, and C were performed by GeneLogic (Gaithersburg, MD, now Bridge Laboratories) and involved inoculation of 11–17-week-old New Zealand white rabbits with 0.5–1 × 10¹¹ PU or VP of adenovector delivered intramuscularly (IM) into the hind limb in 0.5 ml. In each study, comparison was made to the vaccine's final formulation buffer (FFB, vaccine vehicle). Animals were inoculated one time at Study Day (SD) 1 and sacrificed by sodium pentobarbital and exsanguination at SD9, SD61 (Studies A and B), or SD91/93. The variance in study days for sacrifice between studies was based on pragmatic scheduling considerations at the animal facility and timepoints approximated 1 wk, 2 mo (Studies A and B), and 3 mo post-inoculation. The 2 mo time point was deleted from Study C design to streamline the study based on the prior experience.
The following organs were collected for biodistribution analyses: blood, gonads, liver, thymus, heart, lung, kidney, spleen, mesenteric lymph node, right and left popliteal lymph nodes or right & left iliac lymph nodes, subcutis at the injection site, thigh muscle at the injection site, bone marrow (from left femur), and brain. Paired organs were processed together, except the popliteal or iliac lymph nodes, which were processed separately. Tissues and bone marrow cells were snap frozen in liquid nitrogen after being placed in sterile vials and stored at −70° C. In addition, animals were monitored for morbidity (tremors, convulsions, salivation, diarrhea, lethargy, coma, atypical behavior) and mortality twice daily and for clinical signs of toxicity (evaluation of skin and fur characteristics, eye and mucous membranes, respiratory, circulatory, autonomic and central nervous systems, and somatomotor and behavior patterns) prior to dosing, weekly, and at sacrifice. Body weights were taken prior to dosing, weekly, and at sacrifice (fasted) and food consumption was measured daily. These studies were performed in compliance with Good Laboratory Practices (GLP) regulations (21 CFR 58).
Repeated-Dose Toxicology Study Designs
The Study Schemas are displayed in Table 2. All studies were performed by GeneLogic (now Bridge Laboratories) at its facilities in (Gaithersburg, MD). In each study, 10 New Zealand white rabbits per gender were inoculated intramuscularly with the doses and on the schedules indicated in Table 2. Doses were split to permit administration of 0.5 ml/inoculation. Split doses were administered ≈1 inch apart into the hind limb and each subsequent dose was delivered to alternate hind limbs. The DNA plasmid prime in the Ad5 HIV study (Study D) and the Marburg study (Study F) were inoculated with the Biojector 2000 as described in Sheets et al. (2006a). The adenovectors were delivered with needle-and-syringe.
TABLE 2.
Study Schema.
| Study designation | Study Type | Product | Dose | Dosing Schedule | Blood Draw Schedule | Necropsy Schedule |
|---|---|---|---|---|---|---|
| A | Biodistribution | 14 (HIV-1) | 1011 PU | SD1 | N/A | SD9, 61, 91 |
| B | Biodistribution | 18 (Ebola) | 0.89 × 10¹¹ VP | SD1 | N/A | SD9, 61, 93 |
| C | Biodistribution | 27 (HIV-1) | 0.5 × 10¹¹ PU | SD1 | N/A | SD9, 91 |
| D | Toxicology | 14 (HIV-1) | 1011 PU | SD1, 22 | PTID *, SD3, 24, SD36 | SD24, 36 |
| 9, 14 (HIV-1) | 4 mg, 1011 PU | SD1, 22, 43, 64 (#9), SD85, 106 (#14) | PTID, SD3, 24, 45, 66, 86, 108, 120 | SD108, 120 | ||
| E | Toxicology | 18 (Ebola mut) | 2 × 10¹¹ VP | SD1, 22, 43 | PTID, SD3, 24, 45, 57 | SD45, 57 |
| 22 (Ebola WT) | 2 × 10¹¹ VP | SD1, 22, 43 | PTID, SD3, 24, 45, 57 | SD45, 57 | ||
| F | Toxicology | 25, 21 (Marburg) | 4 mg, 1011 VP | SD1, 22, 43, 64 (#25), SD85, 106 (#21) | PTID, SD4, 30, 60, 90, 108, 120 | SD108, 120 |
| G | Toxicology | 27 (HIV-1) | 1011 PU | SD1, 22, 43 | PTID, SD4, 30, 45, 57 | SD45, 57 |
PTID = prior to initial dosing
In each study, the number of inoculations was determined by considering the proposed or potential clinical trial design and adding one additional inoculation. In the cases of prime-boost regimens, one additional prime and one additional boost inoculation were given beyond that planned for the clinic in order to introduce a margin-of-safety into the toxicology study design because dosing at higher than the intended human dose with clinical trial material was of limited feasibility. The highest proposed clinical dose of adenovirus vector was given in each study.
Half the animals (5 per gender) were sacrificed 2 d (immediate) after, and the rest 2 wk (recovery) after, the final inoculation (see Table 2 for SD). Animals were monitored for mortality and morbidity (cageside and clinical observations as described above), Draize scores, body temperatures, body weight and weight changes, food consumption, ophthalmology, and clinical pathology (hematology, chemistries, and coagulation parameters–as reported in Table 2 in Sheets et al. (2006b); in addition, fibrinogen was monitored in Studies F & G) during the in-life portion of the study and immediately prior to or at the time of sacrifice.
Necropsies included organ weights and ratios and gross and histopathology (tissues as listed in Tables 3, 4, and 5 in Sheets et al. [2006b]). Samples were taken for immunogenicity assays (ELISAs) to confirm that active doses were inoculated (i.e., dosing confirmation) as required by GLP. These studies were performed in accordance with GLP, except the immunogenicity analyses, which were performed as described below. Draize scores were measured as: a score of 0 or grade of none reflected no swelling or normal color; a score of 1 or grade of minimal reflected slight swelling with an indistinct border or light pink, indistinct; a score of 2 or grade of mild reflected defined swelling with a distinct border or bright pink to pale red, distinct; a score of 3 or grade of moderate reflected defined swelling with a raised border (< 1 mm) or bright red, distinct; a score of 4 or grade of severe reflected pronounced swelling with a raised border (≥ 1 mm) or dark red, pronounced.
Statistical analyses of repeated-dose toxicology studies: Body temperature, body weights and changes, food consumption, organ weights and ratios, and clinical pathology data were analyzed using the Kolmogorov-Smirnov test for normality, the Levene Median test for equal variance and by oneway Analysis of Variance (ANOVA). If either the normality or equal variance tests failed, then the analysis continued using the non-parametric Kruskal-Wallis ANOVA on rank-transformed data. The probability value of less than 0.05 (two-tailed) was used as the critical level of significance for all tests, without introducing adjustments for the multiplicity of analyses. Statistical analyses were conducted using SigmaStat Statistical Software (Jandel Scientific, San Rafael, CA). The concurrent gender-matched concurrent placebo control group was used for comparison of data in all cases. For any group/time point where n = 1, no statistical analysis was performed. Because of the multiplicity of analyses performed and the number of analyses of clinical pathology parameters demonstrating statistical significance, additional statistical analyses (ANOVA) were performed on the clinical pathology parameters in order to highlight those that were most consistent between genders, timepoints, and studies, or to identify those that may have been overlooked by investigating for clinical correlates to the differences noted.
Tissue Processing and DNA Extraction
Generally, 200 mg of tissue were processed for DNA extraction. Tissues were subjected to enzymatic digestion with Qiagen lysis buffer and proteinase K. DNA was extracted with the BioRobot M48 Workstation (Qiagen) using reagents and protocols recommended by the manufacturer. A naïve tissue sample was included with each run of the BioRobot to serve as a sentinel control for contamination. The concentration of the eluted DNA was determined by UV spectrophotometry, and adjusted to a final concentration suitable for qPCR.
qPCR Analysis for Study A
A multiplex TaqMan qPCR assay was designed to target each of the four recombinant adenovectors containing HIV inserts that compose the Product #14 vaccine. Primers and probe were designed using Primer Express™ software (Applied Biosystems, Inc., Foster City, CA). The four forward primers used were 5′-CTGTAGATCACCAGCATGCCC-3′, 5′-GGATCTTCTCCCAGCGGTC-3′, 5′-CAGAAACCCAGGATACCCCAC-3′, and 5′-GCTAGACTCGAGAGCGGCC-3′. The two reverse primers used were 5′-ACATCCACTTTGCCTTTCTCTCC-3′ and 5′-GCTGGAGCTGGACAAGTGG-3′; the probe was 5′-FAM-TCGAATTCTGCAGTGATCAGGGATCC-BHQ2-3′. TaqMan reactions were performed in a 96-well plate using the ABI PRISM 7700 instrument. Amplification of the target sequence was performed in duplicate reactions each containing up to 1 μg genomic DNA (gDNA) from tissue, and 2× TaqMan Universal PCR Master Mix (Applied Biosystems) with the primers at final concentrations of 50, 50, 50, 150, 150, and 150 nM respectively, and the probe at a final concentration of 100 nM.
A third replicate reaction was performed spiked with 100 copies of the target sequence to monitor qPCR inhibition. Cycling conditions were 50°C for 2 min, 95°C for 10 min, and 45 cycles of 95°C for 15 sec and 60°C for 1 min. Quantification of the target sequence in each specimen was determined using a standard curve of plasmid DNA diluted in a background of gDNA isolated from a naïve animal. Standards, no template controls, sentinel extraction controls, and background gDNA controls were all run in duplicate reactions. Assay performance characteristics were established and the assay qualified for use in the animal model. The limit of detection (LOD) of the assay was 10 copies of target sequence/microgram (μg) of gDNA and the limit of quantification (LOQ) was 50 copies/μg of gDNA. qPCR analyses were performed by Althea Technologies, Inc. (San Diego, CA)
qPCR Analysis for Study B
A TaqMan® qPCR assay was designed to target the adenovirus vector sequence common to both components of the vaccine. Primers and probe were designed using Primer Express software (Applied Biosystems). Forward primer used was 5′-TTAAGCTGGGATGGGTGCAT-3′, the reverse primer was 5′-TGGTGGTTCTGCACAACATGA-3′, and the probe was 5′-FAM-TATGTTCCCAGCCATATCCCTCCGG –BHQ2-3′.TaqMan reactions were performed in a 96-well plate using the ABI PRISM 7700 instrument. Amplification of the target sequence was performed in duplicate reactions each containing up to 1 μg genomic DNA (gDNA) from tissue, and 2× TaqMan Universal PCR Master Mix (Applied Biosystems) with primers and probe at final concentrations of 300 nM and 100 nM, respectively. A third replicate reaction was performed spiked with 100 copies of the target sequence to monitor qPCR inhibition. Cycling conditions were 50°C for 2 min, 95°C for 10 min, and 45 cycles of 95°C for 30 sec and 60°C for 1 min. Quantification of the target sequence in each specimen was determined using a standard curve of plasmid DNA diluted in a background of gDNA isolated from a naïve animal. Standards, no template controls, sentinel extraction controls, and background gDNA controls were all run in duplicate reactions. Assay performance characteristics were established and the assay qualified for use with the animal model. The limit of detection (LOD) of the assay was 10 copies of target sequence per microgram (μg) of gDNA and the limit of quantification (LOQ) was 50 copies per μg of gDNA. qPCR analyses were performed by Althea Technologies, Inc.
qPCR Analysis for Study C
A TaqMan qPCR assay was designed to target the Adenovirus type 35 (Ad35) backbone of the Ad35 vectored HIV vaccine. Primers and probe were designed using Primer Express software (Applied Biosystems). The forward primer used was 5′-TGGATAAAAGTTTGGCAATGGA-3′, the reverse primer was 5′-AATCGTGCCAGATGAATTAACAA-3′, and the probe was 5′ -FAM-ATACTCGCGTGCCAGGCACTTCC-BHQ2-3′. TaqMan reactions were performed in a 96-well plate using the ABI PRISM7700 instrument. Amplification of the target sequence was performed in duplicate reactions each containing up to 1 μg genomic DNA (gDNA) from tissue, and 2× TaqMan Universal PCR Master Mix (Applied Biosystems) with primers and probe at final concentrations of 300 nM and 100 nM, respectively.
A third replicate reaction was performed spiked with 100 copies of the target sequence to monitor qPCR inhibition. Cycling conditions were 50°C for 2 min, 95°C for 10 min, and 40 cycles of 95°C for 15 sec and 60°C for 1 min. Quantification of the target sequence in each specimen was determined using a standard curve of plasmid DNA diluted in a background of gDNA isolated from a naïve animal. Standards, no template controls, sentinel extraction controls, and background gDNA controls were all run in duplicate reactions. Assay performance characteristics were established and the assay qualified for use with the animal model. The limit of detection (LOD) of the assay was 10 copies of target sequence/μg of gDNA and the limit of quantification (LOQ) was 50 copies/μg of gDNA. qPCR analyses were performed by Althea Technologies, Inc.
Statistical Analyses on the PCR Results
Mean copy numbers for each tissue at the first and last time points were compared using the Wilcoxon Rank-sum test. Initially, differences between genders for each tissue and time point were compared to confirm that gender differences did not exist, so that data for both genders could be pooled and analyzed together. The p-values are reported in Figure 1.
FIG. 1.
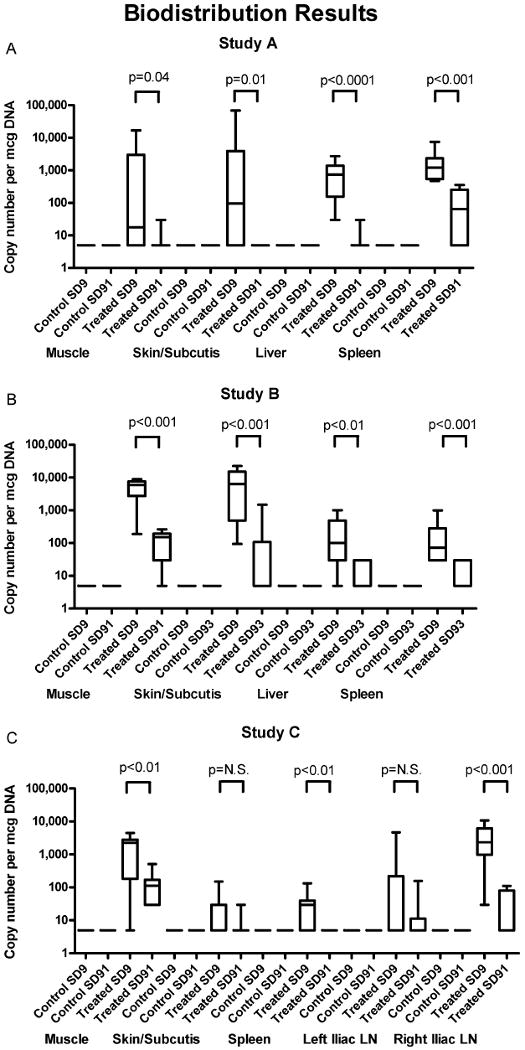
Biodistribution results. Box and whisker plots showing the copy numbers present in various tissues at SD9 and SD91/93 for control and treated animals in Studies A, B, and C. p-values are reported for comparisons between first and last time points in the treated groups, demonstrating clearance of vector from these tissues over the time course of the studies.
Immunogenicity by Antibody ELISA
Optimized concentrations of purified recombinant antigens were coated onto Immunol-2 HB microtiter plates (Thermo Lab-systems, Milford, MA) overnight at 4°C. As detailed in Table 3, HIV GAG antigen was purchased commercially, while the remainder of the antigens were generated in-house. The VRC plasmids were expressed in 293T cells and purified for the major protein product. Plates were washed and blocked (20% FBS/1% BSA-buffered solution) for 1 hr at 37°C. Duplicate wells received the rabbit sera dilutions and were then incubated 2 hr at 37°C; after washing and removal of non-adherent materials, each well received (and was incubated with) biotin-labeled anti-rabbit (IgG/IgA/IgM) (KPL, Gaithersburg, MD) for 1 hr at 37°C. After this period, each well was washed and then received (and was incubated with) streptavidin-HRPO (horseradish peroxidase) for 30 min at room temperature; after washing, each well then received TMB (3,3′,5,5′ -tetramethylbenzidine) substrate and was incubated for 30 min at room temperature. Color development was stopped by addition of 10 μl 1N sulfuric acid, and the absorbance in each well was then read within 30 min at 450 nm.
TABLE 3.
Recombinant Antigens Used in Immunogenicity Assessments (ELISA).
| Antigen | Source |
|---|---|
| HIV ENV A | VRC Plasmid 5304 |
| HIV ENV B | VRC Plasmid 2801 |
| HIV ENV C | VRC Plasmid 5308 |
| HIV GAG | ImmunoDiagnostics, Inc. Woburn, MA |
| Marburg-GP-Angola | VRC Plasmid 6715 |
| Ebola GP-Sudan/Gulu | VRC Plasmid 6204 |
| Ebola GP-Zaire | VRC Plasmid 6605 |
A minimum of 2 dilutions of the pre-vaccination and end of study samples were run for each animal and antigen in duplicate wells. Mean ODs for each dilution were compared to the mean OD of the same dilution of the pre-immunization sample. Sera were considered responsive if the post-vaccination OD was >0.2 more than the pre-vaccination sample of the same animal.
Results
Biodistribution
As a general pattern, the adenovectors remained primarily at the site of inoculation in the muscle and subcutis and only trafficked to the liver (Ad5), iliac lymph nodes (Ad35), and spleen, but no other distal organs, including remaining absent from the gonads. Over time, the number of animals with positive tissues and the copy numbers present in those positive tissues declined steadily, demonstrating clearance of the adenovectors.
Individual Study Results
Study A: Biodistribution of Ad5-vectored HIV Vaccine Candidate (Product #14)
Two groups were inoculated in this study. One group received 0.5 ml FFB (diluent) IM and the other group received 1011 PU Product #14 IM in 0.5 ml. All animals survived to scheduled sacrifice. There were no clinical signs of treatment-related toxicity during the study. There were no differences in body weights or weight changes compared to controls. Decreases in food consumption in the 24-48 hr following vaccination correlated with findings in the repeated dose toxicology study (Study D) and achieved statistical significance in males. PCR results are shown in Figure 1 and Table 4.
TABLE 4.
Quantifiably Positive PCR Results in All Tissues in All Studies at the Final Study Timepoint.
| Injection Site Muscle | Injection Site Sub-cutis | Blood | Bone Marrow | Brain | Gonads | Heart | Kidneys | Liver | Lungs | Lymph Node - M esenteric | Lymph Node** | Lymph Node*** | Spleen | Thymus | ||
|---|---|---|---|---|---|---|---|---|---|---|---|---|---|---|---|---|
| Study A | Placebo (n = 2) | 0 | 0 | 0 | 0 | 0 | 0 | 0 | 0 | 0 | 0 | 0 | 0 | 0 | 0 | 0 |
| Test Article (n = 10) | 0 | 0 | 0 | 0 | 0 | 0 | 0 | 0 | 0 | 0 | 0 | 0 | 0 | 5 | 0 | |
| Study B | Placebo (n = 10) | 0 | 0 | 0 | 0 | 0 | 0 | 0 | 0 | 0 | 0 | 0 | 0 | * | 0 | 0 |
| Test Article (n = 10) | 6 | 3 | 0 | 0 | 0 | 0 | 0 | 0 | 0 | 0 | 0 | 0 | * | 0 | 0 | |
| Study C | Placebo (n = 10) | 0 | 0 | 0 | 0 | 0 | 0 | 0 | 0 | 0 | 0 | 0 | 0 | 0 | 0 | * |
| Test Article (n = 10) | 7 | 0 | 0 | 0 | 0 | 0 | 0 | 0 | 0 | 0 | 0 | 1 | 3 | 0 | * |
# - absolute # quantifiably positive
#(#) - absolute # (%)
N.D. = not done
Study A = left popliteal lymph nodes, Study B = draining popliteal lymph nodes, Study C = left iliac lymph nodes
Study A = right popliteal lymph nodes, Study C = right iliac lymph nodes
The range of values among those quantifiably positive at study endpoint was 63-1474 copies/mcg genomic DNA
Study B: Biodistribution of Ad5-vectored Ebola Vaccine Candidate (Product #18)
Two groups were inoculated in this study. One group received 0.5 ml FFB (diluent) IM and the other group received 0.89 × 10¹¹ VP Product #18 IM in 0.5 ml. All animals survived to scheduled sacrifice. There were no clinical signs of treatment-related toxicity during the study. There were no differences in body weights or weight changes compared to controls. There were no findings on gross pathology. PCR results are shown in Figure 1 and Table 4.
Study C: Biodistribution of Ad35-vectored HIV Vaccine Prototype (Product #27)
Two groups were inoculated in this study. One group received 0.5 ml FFB (diluent) IM and the other group received 0.5 × 10¹¹ VP Product #27 IM in 0.5 ml. All animals survived to scheduled sacrifice. There were no clinical signs of treatment-related toxicity during the study. There were no differences in body weights or weight changes compared to controls. PCR results are shown in Figure 1 and Table 4.
Repeated Dose Toxicology (Studies D, E, F, and G)
In the studies of Ad5 vectors, but not the Ad35 vector (Study G), body temperatures were elevated in the period immediately post-vaccination (Figure 2). Mild fevers were noted in another study of an Ad35 vector delivered at a higher dose (∼1012, reported in Cheng et al., 2007), but were not seen at the dose studied here (1011 PU). Additionally, mean food consumption was diminished in the period immediately post-vaccination after each Ad5 inoculation and after repeated, but not initial, inoculations of Ad35 (Figure 3). Thus, while the primary toxicity noted was local (Draize scores and histopathology) and reversible, reversible systemic toxicity (fevers, food consumption, clinical pathology parameters) was also noted. However, no specific target organs (other than injection sites) were affected grossly or histopathologically demonstrating that the vaccine candidates tested were safe and suitable for investigational clinical use at doses up to 2 × 10¹¹ PU/VP given intramuscularly.
FIG. 2.
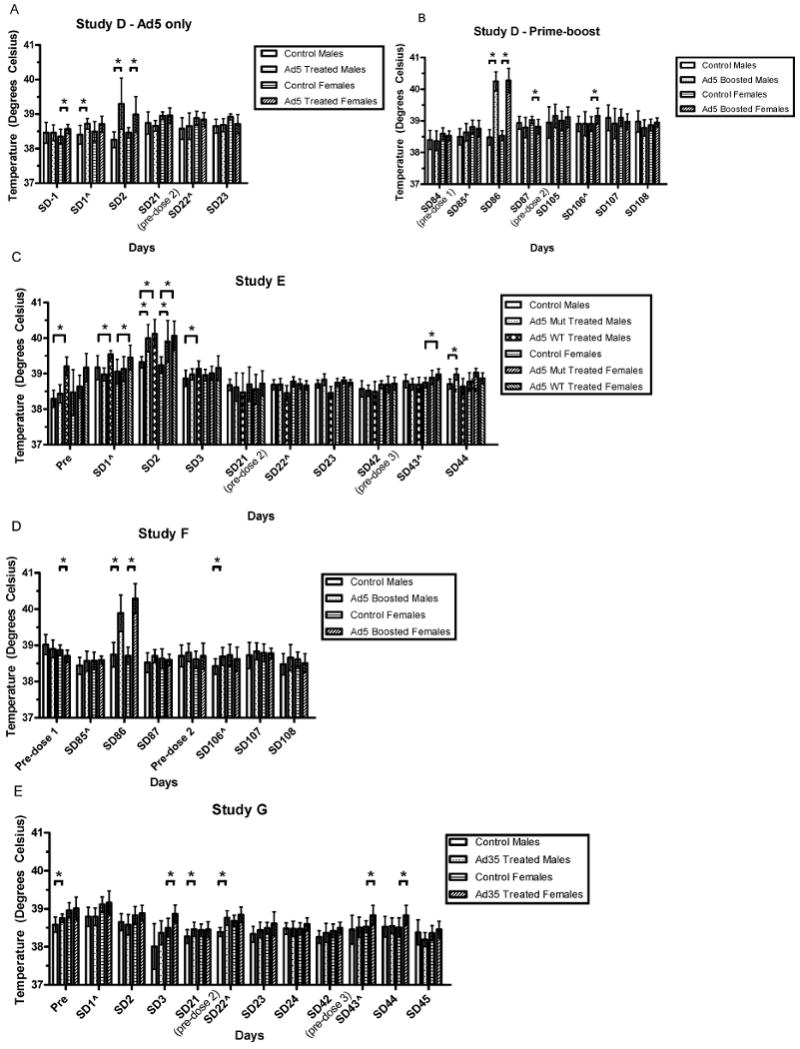
Body temperatures in immediate post-vaccinal periods in Studies D, E, F, and G. Mean body temperatures are compared to gender-matched controls. Differences which were significant at the p ≤ 0.05 level are noted with an asterisk. Adjustments were not made to account for multiplicity, to more stringently detect potential safety signals. The groups compared are indicated by the lines over the bars. Error bars reflect the standard deviations. Time points marked with were taken 3 hr post-inoculation (hpi) on that study day.
FIG. 3.
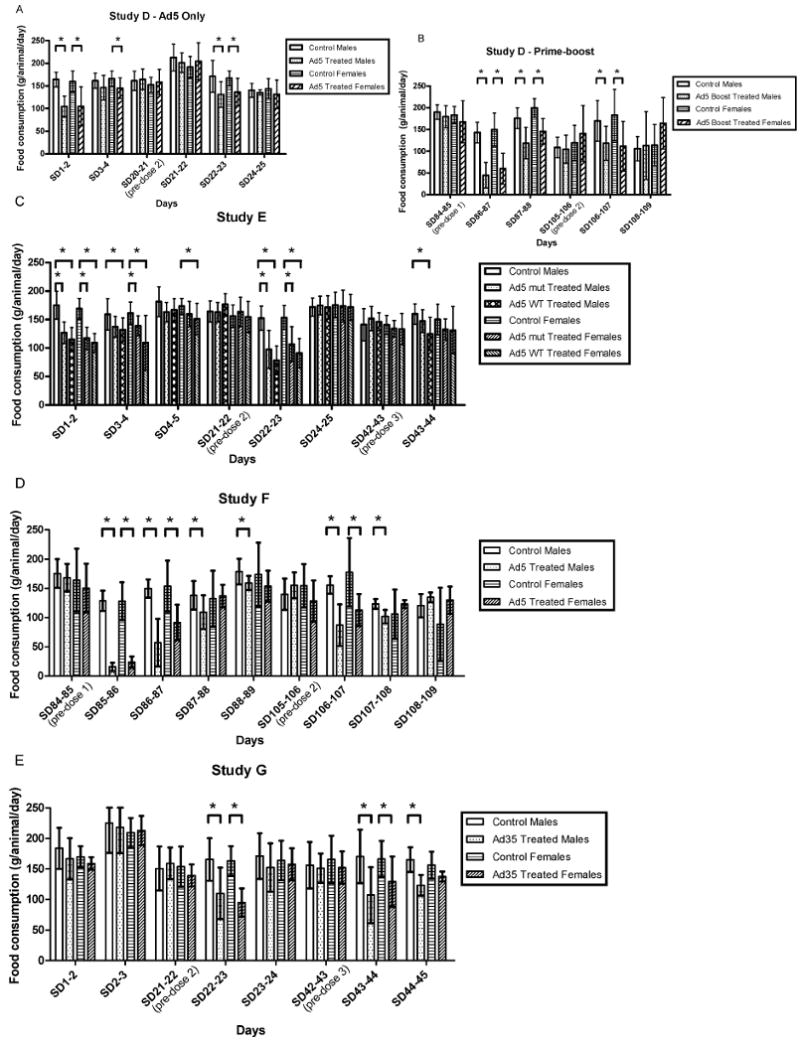
Food consumption in the immediate post-vaccinal periods in Studies D, E, F, and G. Mean food consumption was compared to gender-matched controls. Differences that were significant at the p <0.05 level are noted with an asterisk. Adjustments were not made to account for multiplicity, to more stringently detect potential safety signals. The groups compared are indicated by the lines over the bars. Error bars reflect the standard deviations. This parameter was not measured on study days when animals were fasted for blood draws.
In each repeated dose toxicology study, the clinical pathology parameters noted in Table 5 appear to have been impacted by vaccination due to the occurrence of statistically significant differences in one or both genders, at one or more timepoints, and across studies. While all were statistically significantly different from concurrent gender-matched controls, some were also outside the historical reference range for the gender, species, and laboratory. While additional parameters were found to be statistically significantly different from concurrent controls, the following were considered in evaluating those additional differences: The means remained within the historical reference range, the magnitude or directions of the differences were not clinically meaningful, and/or there was a lack of correlation across genders, groups, timepoints, studies, and with other parameters (e.g., clinical symptoms, histopathology, other related clinical pathology parameters). Therefore such findings were deemed to be incidental and not treatment-related and are not reported herein.
TABLE 5.
Potentially adenovector-related clinical pathology parameters by study
| SERUM CHEMISTRIES | Treated | Controlsa | |||||||
|---|---|---|---|---|---|---|---|---|---|
|
|
|
||||||||
| Parameter | Study | Product | Timepoint | Gender | Direction | Mean | S.D.b | Mean | S.D. |
| Cholesterolc | D | 14 | SD3 | M | ↑ | 102 | 20.81 | 80 | 18.66 |
| F | ↑ | 124 | 32.06 | 92 | 25.61 | ||||
| E | 18 | M | ↑ | 130.8 | 28.63 | 73.3 | 10.61 | ||
| F | ↑ | 166.78 | 36.32 | 104.7 | 20.22 | ||||
| 22 | M | ↑ | 117.1 | 10.81 | 73.3 | 10.61 | |||
| F | ↑ | 135.8 | 21.7 | 104.7 | 20.22 | ||||
| G | 27 | SD4 | M | ↓ | 64 | 5.33 | 84.71 | 14.97 | |
| Triglyceridesd | D | 14 | SD3 | M | ↑ | 287 | 127.87 | 159 | 58.62 |
| F | ↑ | 188 | 53.96 | 126 | 42.01 | ||||
| 9, 14 | SD86 | M | ↑ | 744 | 570.96 | 192 | 178.16 | ||
| E | 18 | SD3 | M | ↑ | 404.9 | 198.73 | 153.9 | 48.28 | |
| F | ↑ | 318.78 | 222.7 | 138.6 | 54.81 | ||||
| 22 | M | ↑ | 297 | 107.63 | 153.9 | 48.28 | |||
| F | ↑ | 216 | 30.61 | 138.6 | 54.81 | ||||
| G | 27 | SD4 | M | ↑ | 187.5 | 72.8 | 126.8 | 44.59 | |
| SD30 | M | ↑ | 145.6 | 66.18 | 82.9 | 22.2 | |||
| Globuline | D | 14 | SD3 | M | ↑ | 2.3 | 0.15 | 2 | 0.12 |
| F | ↑ | 2.2 | 0.1 | 2 | 0.1 | ||||
| SD24 | M | ↑ | 2.2 | 0.13 | 2 | 0.08 | |||
| F | ↑ | 2.2 | 0.12 | 1.9 | 0.1 | ||||
| SD36 | M | ↑ | 2.2 | 0.23 | 1.9 | 0.14 | |||
| 9, 14 | SD86 | F | ↑ | 2.4 | 0.16 | 2.1 | 0.24 | ||
| SD108 | M | ↑ | 2.3 | 0.18 | 2.1 | 0.16 | |||
| F | ↑ | 2.3 | 0.08 | 2.2 | 0.18 | ||||
| E | 18 | SD3 | M | ↑ | 2.42 | 0.21 | 1.96 | 0.12 | |
| F | ↑ | 2.5 | 0.3 | 2.03 | 0.19 | ||||
| 22 | M | ↑ | 2.3 | 0.21 | 1.96 | 0.12 | |||
| F | ↑ | 2.26 | 0.19 | 2.03 | 0.19 | ||||
| 18 | SD24 | M | ↑ | 1.85 | 0.16 | 1.43 | 0.21 | ||
| F | ↑ | 1.93 | 0.16 | 1.55 | 0.11 | ||||
| 22 | M | ↑ | 1.71 | 0.13 | 1.43 | 0.21 | |||
| F | ↑ | 1.82 | 0.14 | 1.55 | 0.11 | ||||
| 18 | SD45 | M | ↑ | 2.02 | 0.15 | 1.51 | 0.17 | ||
| F | ↑ | 2.07 | 0.14 | 1.68 | 0.13 | ||||
| 22 | M | ↑ | 2.05 | 0.12 | 1.51 | 0.17 | |||
| F | ↑ | 2.08 | 0.12 | 1.68 | 0.13 | ||||
| 18 | SD57 | M | ↑ | 1.66 | 0.09 | 1.34 | 0.011 | ||
| F | ↑ | 1.58 | 0.19 | 1.42 | 0.16 | ||||
| 22 | M | ↑ | 1.8 | 0.12 | 1.34 | 0.11 | |||
| F | 25, 21 | SD90 | M | ↑ | 2.43 | 0.16 | 2.07 | 0.14 | |
| F | ↑ | 2.59 | 0.13 | 2.2 | 0.22 | ||||
| SD120 | F | ↑ | 2.28 | 0.15 | 2.08 | 0.11 | |||
| G | 27 | SD4 | M | ↑ | 2.26 | 0.11 | 2.1 | 0.14 | |
| SD30 | M | ↑ | 2.22 | 0.08 | 2 | 0.08 | |||
| F | ↑ | 2.32 | 0.27 | 2.05 | 0.1 | ||||
| SD45 | M | ↑ | 2.16 | 0.15 | 1.96 | 0.09 | |||
| F | ↑ | 2.2 | 0.07 | 2 | 0.16 | ||||
| SD57 | F | ↑ | 2.38 | 0.19 | 2.08 | 0.08 | |||
| A/G ratiof | D | 14 | SD3 | M | ↓ | 1.6 | 0.11 | 2 | 0.19 |
| F | ↓ | 1.8 | 0.15 | 1.9 | 0.11 | ||||
| SD24 | M | ↓ | 1.8 | 0.11 | 2 | 0.15 | |||
| F | ↓ | 1.47 | 0.11 | 2 | 0.07 | ||||
| SD36 | M | ↓ | 1.7 | 0.2 | 2 | 0.21 | |||
| 9, 14 | SD86 | F | ↓ | 1.7 | 0.18 | 2.1 | 0.16 | ||
| E | 18 | SD3 | M | ↓ | 1.53 | 0.13 | 1.88 | 0.16 | |
| F | ↓ | 1.47 | 0.16 | 1.83 | 0.22 | ||||
| 22 | M | ↓ | 1.66 | 0.18 | 1.88 | 0.16 | |||
| F | ↓ | 1.59 | 0.18 | 1.83 | 0.22 | ||||
| 18 | SD24 | M | ↓ | 2.17 | 0.22 | 2.95 | 0.56 | ||
| F | ↓ | 2.06 | 0.24 | 2.61 | 0.17 | ||||
| 22 | M | ↓ | 2.4 | 0.24 | 2.95 | 0.56 | |||
| F | ↓ | 2.18 | 0.22 | 2.61 | 0.17 | ||||
| 18 | SD45 | M | ↓ | 1.97 | 0.18 | 2.77 | 0.37 | ||
| F | ↓ | 1.95 | 0.19 | 2.33 | 0.18 | ||||
| 22 | M | ↓ | 2.05 | 0.16 | 2.77 | 0.37 | |||
| F | ↓ | 1.87 | 0.16 | 2.33 | 0.18 | ||||
| 18 | SD57 | M | ↓ | 2.42 | 0.21 | 2.99 | 0.2 | ||
| F | ↓ | 2.23 | 0.09 | 2.77 | 0.23 | ||||
| 22 | F | ↓ | 2.45 | 0.16 | 2.77 | 0.23 | |||
| F | 25, 21 | SD90 | M | ↓ | 1.71 | 0.12 | 2.07 | 0.18 | |
| F | ↓ | 1.52 | 0.09 | 1.86 | 0.09 | ||||
| SD120 | F | ↓ | 1.72 | 0.1 | 1.91 | 0.11 | |||
| G | 27 | SD30 | M | ↓ | 1.74 | 0.08 | 1.84 | 0.08 | |
| F | ↓ | 1.73 | 0.15 | 1.84 | 0.14 | ||||
| SD45 | M | ↓ | 1.75 | 0.15 | 1.92 | 0.1 | |||
| F | ↓ | 1.62 | 0.16 | 1.82 | 0.09 | ||||
| SD57 | F | ↓ | 1.65 | 0.15 | 1.94 | 0.04 | |||
| HEMATOLOGIES | |||||||||
| Hemoglobing | D | 14 | SD3 | M | ↓ | 11.9 | 0.48 | 13.1 | 0.71 |
| SD24 | M | ↓ | 12 | 0.9 | 13.2 | 0.67 | |||
| 9,14 | SD108 | M | ↓ | 12.7 | 0.64 | 13.4 | 1.55 | ||
| E | 22 | SD -4 | M | ↓ | 12.53 | 0.75 | 13.3 | 0.54 | |
| 18 | SD3 | M | ↓ | 11.54 | 0.66 | 12.35 | 0.81 | ||
| 22 | M | ↓ | 10.92 | 0.75 | 12.35 | 0.81 | |||
| F | ↓ | 11.16 | 0.5 | 12.07 | 0.58 | ||||
| 18 | SD24 | M | ↓ | 12.96 | 0.66 | 13.92 | 0.5 | ||
| 22 | M | ↓ | 12.91 | 0.64 | 13.92 | 0.5 | |||
| 18 | SD45 | M | ↓ | 14.18 | 0.56 | 14.75 | 0.59 | ||
| 22 | M | ↓ | 13.94 | 0.56 | 14.75 | 0.59 | |||
| F | ↓ | 13.84 | 0.37 | 14.41 | 0.65 | ||||
| F | 25, 21 | SD90 | M | ↓ | 13.2 | 0.53 | 14.47 | 0.95 | |
| F | ↓ | 12.79 | 0.78 | 13.77 | 0.67 | ||||
| SD108 | M | ↓ | 13.16 | 0.42 | 13.92 | 0.49 | |||
| G | 27 | SD30 | F | ↓ | 13.35 | 0.56 | 14.04 | 0.59 | |
| SD45 | M | ↓ | 13.7 | 0.6 | 14.82 | 0.31 | |||
| F | ↓ | 13.06 | 0.75 | 14.34 | 0.61 | ||||
| SD57 | F | ↑ | 14.22 | 0.65 | 13.44 | 0.38 | |||
| Hematocrith | D | 14 | SD3 | M | ↓ | 39.2 | 1.83 | 43.9 | 2.69 |
| SD24 | M | ↓ | 38.6 | 3.38 | 42.1 | 2.32 | |||
| 9, 14 | SD120 | M | ↓ | 44.1 | 1.28 | 47.1 | 1.46 | ||
| E | 18 | SD -4 | M | ↓ | 37.52 | 1.93 | 39.69 | 1.58 | |
| 22 | SD3 | M | ↓ | 33.11 | 1.91 | 35.55 | 2.05 | ||
| F | ↓ | 32.41 | 3.45 | 35.41 | 1.91 | ||||
| 18 | M | ↓ | 31.41 | 2.03 | 35.55 | 2.05 | |||
| F | ↓ | 32.03 | 1.58 | 35.41 | 1.91 | ||||
| 22 | SD24 | M | ↓ | 38.43 | 2.02 | 40.46 | 1.42 | ||
| 18 | M | ↓ | 37.89 | 1.92 | 40.46 | 1.42 | |||
| 18 | SD45 | M | ↓ | 39.56 | 1.29 | 41.67 | 1.87 | ||
| F | 25, 21 | SD -6 | M | ↑ | 36.66 | 1.16 | 35.3 | 1.39 | |
| F | ↓ | 33.76 | 1.91 | 36.02 | 1.91 | ||||
| SD90 | M | ↓ | 39.27 | 1.59 | 41.99 | 2.88 | |||
| F | ↓ | 37.79 | 2.06 | 40.28 | 1.82 | ||||
| SD108 | M | ↓ | 38.66 | 1.25 | 40.92 | 1.62 | |||
| G | 28 | SD30 | F | ↓ | 39.51 | 1.49 | 41.02 | 2.27 | |
| SD45 | M | ↓ | 40.46 | 1.65 | 43.28 | 0.79 | |||
| F | ↓ | 38.42 | 2.06 | 42.12 | 1.47 | ||||
| Plateletsi | D | 14 | SD3 | F | ↓ | 303 | 104.75 | 425 | 128.03 |
| 9, 14 | SD86 | M | ↓ | 232 | 17.16 | 354 | 67 | ||
| F | ↓ | 172 | 46.64 | 356 | 101.49 | ||||
| E | 18 | SD3 | M | ↓ | 224.67 | 154.19 | 394 | 95.96 | |
| F | ↓ | 201.3 | 89.58 | 480.8 | 123.48 | ||||
| 22 | M | ↓ | 261.67 | 138.01 | 394 | 95.96 | |||
| F | ↓ | 272.56 | 114.52 | 480.8 | 123.48 | ||||
| F | 25, 21 | SD90 | M | ↑ | 991.8 | 138.03 | 473.9 | 66.57 | |
| F | ↑ | 1037.6 | 164.13 | 495.22 | 127.88 | ||||
| G | 27 | SD45 | F | ↓ | 618.7 | 149.08 | 809.9 | 155.31 | |
| Mean | D | 14 | SD3 | M | ↑ | 8 | 1.29 | 6.2 | 1.66 |
| Platelet | E | 18 | M | ↑ | 8.36 | 2.38 | 6.08 | 0.18 | |
| Volumej | F | ↑ | 8.49 | 2.77 | 6.46 | 0.46 | |||
| 22 | M | ↑ | 7.17 | 0.9 | 6.08 | 0.18 | |||
| F | ↑ | 7.36 | 0.92 | 6.46 | 0.46 | ||||
| 18 | SD24 | M | ↑ | 6.75 | 1.45 | 5.74 | 0.3 | ||
| 22 | M | ↑ | 6.32 | 0.36 | 5.74 | 0.3 | |||
| F | 25, 21 | SD90 | M | ↑ | 6.76 | 0.46 | 6.38 | 0.52 | |
| COAGULATION | |||||||||
| Activated | D | 14 | SD24 | F | ↑ | 83.71 | 7.65 | 73.35 | 10.95 |
| Partial | 9, 14 | SD86 | F | ↑ | 86.66 | 9.41 | 75 | 11.97 | |
| Thromboplastin | E | 18 | SD3 | M | ↑ | 105.96 | 27.18 | 54.02 | 10.85 |
| Timek | F | ↑ | 119.27 | 15.85 | 85.93 | 19.77 | |||
| 22 | M | ↑ | 114.06 | 17.65 | 54.02 | 10.85 | |||
| F | ↑ | 117.5 | 6.52 | 85.93 | 19.77 | ||||
| 18 | SD24 | F | ↑ | 107.19 | 12.35 | 84.32 | 14.21 | ||
| SD45 | M | ↑ | 108.11 | 7.65 | 81.11 | 14.94 | |||
| F | ↑ | 104.88 | 19.47 | 85.15 | 15.44 | ||||
| 22 | M | ↑ | 105.47 | 14.17 | 81.11 | 14.94 | |||
| F | ↑ | 103.81 | 8.87 | 85.15 | 15.44 | ||||
| F | 25, 21 | SD90 | M | ↑ | 135.1 | 17.4 | 86.51 | 8.13 | |
| F | ↑ | 132.5 | 15.83 | 93.69 | 17.85 | ||||
| SD108 | M | ↑ | 100.72 | 10.29 | 81.76 | 9.18 | |||
| G | 27 | Pre-dose | F | ↓ | 79.02 | 10.35 | 87.37 | 6.76 | |
| SD30 | F | ↑ | 112.9 | 15.21 | 96.93 | 16.31 | |||
| SD45 | M | ↑ | 117.6 | 12.58 | 96.48 | 8.1 | |||
| Prothrombin | D | 14 | SD3 | M | ↓ | 8.69 | 0.8 | 8.93 | 0.9 |
| Timel | F | ↓ | 8.64 | 0.8 | 8.93 | 0.7 | |||
| SD24 | M | ↓ | 8.96 | 0.12 | 9.17 | 0.12 | |||
| F | ↓ | 9.02 | 0.1 | 9.27 | 0.14 | ||||
| E | 18 | SD3 | M | ↓ | 5.88 | 0.03 | 6.17 | 0.09 | |
| F | ↓ | 5.88 | 0.06 | 6.23 | 0.11 | ||||
| 22 | SD3 | M | ↓ | 5.87 | 0.05 | 6.17 | 0.09 | ||
| F | ↓ | 5.9 | 0.06 | 6.23 | 0.11 | ||||
| 18 | SD24 | M | ↓ | 6.02 | 0.09 | 6.5 | 0.12 | ||
| F | ↓ | 6.02 | 0.09 | 6.57 | 0.24 | ||||
| 22 | M | ↓ | 6.05 | 0.12 | 6.5 | 0.12 | |||
| F | ↓ | 6.05 | 0.14 | 6.57 | 0.24 | ||||
| 18 | SD45 | M | ↓ | 6.27 | 0.14 | 6.56 | 0.12 | ||
| F | ↓ | 6.26 | 0.16 | 6.62 | 0.25 | ||||
| 22 | M | ↓ | 6.3 | 0.12 | 6.56 | 0.12 | |||
| F | ↓ | 6.33 | 0.09 | 6.62 | 0.25 | ||||
| F | 25, 21 | SD90 | F | ↓ | 6.74 | 0.18 | 6.98 | 0.18 | |
| SD108 | M | ↓ | 6.57 | 0.07 | 6.99 | 0.08 | |||
| F | ↓ | 6.54 | 0.08 | 7.05 | 0.21 | ||||
| G | 27 | SD57 | F | ↓ | 6.45 | 0.11 | 6.99 | 0.17 | |
| Fibrinogenm | F | 25, 21 | SD90 | M | ↑ | 725.7 | 84.62 | 335.1 | 70.08 |
| F | ↑ | 653.2 | 81.96 | 273 | 65.69 | ||||
| SD108 | M | ↑ | 665.8 | 78.7 | 347.8 | 28.53 | |||
| F | ↑ | 559.6 | 77.32 | 262.5 | 40.9 | ||||
| G | 27 | SD4 | M | ↑ | 472 | 77.46 | 361.6 | 29.47 | |
| F | ↑ | 359.1 | 47.83 | 294.1 | 48.54 | ||||
| SD30 | M | ↑ | 407.3 | 95.76 | 307.5 | 49.2 | |||
| F | ↑ | 353.8 | 144.62 | 247 | 21.58 | ||||
| SD45 | M | ↑ | 620.8 | 41.91 | 339.8 | 50.42 | |||
| F | ↑ | 569.6 | 91.1 | 269.8 | 17.92 | ||||
| SD57 | F | ↑ | 297.8 | 42.58 | 238 | 14.92 | |||
Gender-matched concurrent controls
S.D. = standard deviation.
Cholesterol male reference range 50–131, female reference range. 51–137.
Triglycerides male reference range 35–274, female reference range 34–150.
Globulin male reference range 1.2–2.6, female reference range 1.5–2.6.
A/G ratio male reference range 1.4–2.9, female reference range 1.4–2.6.
Hemoglobin male reference range 11.3–15, female reference range 11.1–14.5.
Hematocrit male reference range 33.4–45.5, female reference range 33.3–43.8.
Platelets male reference range 237–725, female reference range 258–712.
MPV male reference range 5.5–7.6, female reference range 5.5–7.9.
APTT male reference range 51.56–113, female reference range 50.2–112.
PT male reference range 6–8.67, female reference range 6–8.63.
This parameter (fibrinogen) was only measured in Studies F (Marburg) & G (Ad35), so the absence of values from Studies D (Ad5 HIV) & E (Ebola) in this table should not be construed as there being no differences, but rather no measurements; male reference range: 224–500, female reference range 198–447
Cells highlighted in light gray represent mean values that fall outside the historical reference range.
Parameters Unaffected by Adenovector Delivery
All animals survived to scheduled sacrifice except one control female in Study F (Marburg) that was found dead on SD60 with no prior clinical observations. No treatment-related findings were noted with regard to morbidity/clinical observations nor ophthalmology. The only treatment-related findings in regards to gross pathology were noted in Study D (HIV prime-boost and Ad5 alone) and are described below under Local Reactions. No treatment-related gross pathology was noted in Studies E (Ebola), F (Marburg), or G (Ad35). There was essentially no impact of delivery of adenovectors on Draize scores and the only significant findings were seen in relation to DNA plasmid priming in Studies D (HIV prime-boost) and F (Marburg), as described below under Local Reactions. There was no impact on body weights in Studies D (Ad5 HIV alone and prime-boost), E (Ebola), or F (Marburg), but some were noted in Study G (Ad35), as described below under Systemic Reactions.
Local Reactions (Draize Scores and Histopathology at the Injection Site)
In Study D (HIV Ad5 alone or prime-boost), local reactions were minimal in animals receiving adenovectors (alone or as a boost). Minimal erythema was seen at the injection sites in 2 treated males and 1 control female after the second adenovector injection when given alone. In contrast, in the prime-boost regimen, vaccination with the DNA prime resulted in Draize scores of minimal to moderate edema and erythema increasing in frequency and severity with repeated dosing. This was a result of the combination of injection with Biojector and the active vaccination, as these observations also occurred in the control animals but to a lower amount and lesser degree. These findings were consistent with studies with DNA vaccination alone (Sheets et al., 2006b).
Boost (adenovector delivered by needle and syringe) injections did not increase the frequency or severity (minimal erythema and/or edema in a few treated animals) of the Draize observations seen at earlier timepoints (after priming doses). Local reactions were evidenced however, in that clear treatment-related (adenovector alone and prime-boost) observations were seen in gross and histopathology at the injection sites and in histopathological findings of inflammation in the perineural tissue of the sciatic nerve (near the injection site). These latter lesions consisted of chronic inflammatory cells (small macrophages and lympho-cytes) in the connective tissue around the sciatic nerve and in adjacent lymphatics and blood capillaries. This inflammation was the result of draining toward proximal lymph nodes from the distal injection sites. The injection site reactions were less in frequency and severity in the recovery sacrifice animals than in the immediate sacrifice animals for both the adenovector alone and the prime-boost regimens, demonstrating the reversibility of the injection site reactions. No other treatment-related findings were observed grossly or histopathologically.
In Study E (Ebola), local reactions were minimal to moderate as assessed solely by histopathology. No gross pathology or Draize score differences were noted. Both treated and control animals had inflammation at the sites of inoculation with greater frequency in treated animals. Inflammation was noted at the sites of injection, adjacent muscle, and around blood vessels and lymphatics surrounding the proximate sciatic nerves. By the recovery sacrifice, inflammation was observed at a lower frequency and lesser intensity than at the immediate sacrifice, demonstrating reversibility.
In Study F (Marburg), minimal to moderate edema and minimal to mild erythema were noted in both control and treated animals with increased incidence and/or duration following several vaccinations in treated animals. Most reactions were associated with the DNA vaccinations delivered by Biojector. Only minimal edema and erythema were noted following adenovector delivery. By histopathology, at SD108, injection sites findings were observed more frequently in treated animals with mostly minimal to mild inflammation, though some moderate inflammation was noted at injection site #1 in two treated females. At SD120, only minimal inflammation was still noted at injection sites (more frequently in treated animals), demonstrating reversibility of the reactions. All histopathological findings outside the site of injection were considered incidental, as they occur frequently in this species and were seen in both control and treated animals.
In Study G (Ad35), minimal to moderate local reactions were noted by injection site histopathology at SD45, being slightly more severe and more frequent in treated animals versus controls. Reversibility was demonstrated in that at SD57 only a minority of animals had evidence of ongoing reactions, approximately equivalent between treated animals and controls. No other histopathological differences between groups were noted. There were no treatment-related Draize findings.
Systemic Reactions (Body Temperatures, Food Consumption, Body Weights and Changes)
Body Temperatures: In Study D (HIV Ad5 alone and prime-boost), systemic reactions to adenovector vaccination were noted in that mild fevers were seen in the 24 hr subsequent to the initial, but not second, adenovector vaccination (adenovector only arm). These reactions resolved by 48 hr. Likewise, fever was seen in treated males and females in the 24 hr subsequent to the initial, but only in the first 3 hr and in treated females after the second adenovector boost, in the prime-boost treated animals. These fevers resolved by 48 hr after the initial and 24 hr after the second (treated ♀ only) adenovector boost (Figure 2). Furthermore, systemic reactions to adenovector vaccination were noted in that mild fevers were seen by 24 hr following the first adenovector boost returning to normal by 48 hr. Fevers were not noted following the second adenovector boost, although the mean for the treated males was statistically significantly higher than controls at 3 hr post-dosing, remaining well within the normal temperature range for the species (Figure 2).
In Study E (Ebola), mild fevers were also seen, but after the first inoculation only. By 3 hr post-inoculation on SD1, both mut-treated and WT-treated females were beginning to show significantly increased body temperatures compared to control females. At 24 hr post-inoculation, all treated animals had elevated body temperatures, with group means approaching or slightly exceeding 40°C. These fevers were resolved by 48 hr post-inoculation. While there were statistically significantly increased body temperatures noted at a few other times, they remained at or below 39°C, well within the normal body temperature for rabbits (Lee, 1939) and were considered incidental.
Fevers were not observed following the second or third inoculations (Figure 2). In Study F (Marburg), mild fevers were seen by 24 hr following the first adenovector boost returning to normal by 48 hr. Fevers were not noted following the second adenovector boost, although the mean for the treated males was statistically significantly higher than controls at 3 hr post-dosing, remaining well within the normal temperature range for the species (Figure 2). In Study G (Ad35), there was no treatment-related effect seen in regards to body temperatures at the dosage tested, in contrast to the consistent finding of mild fevers following Ad5 delivery. This is the clearest difference in reactogenicity between the two vector platforms.
Food consumption and body weights and changes: In Study D (HIV Ad5 alone and prime-boost), systemic reactions were further noted in that food consumption was also less in treated animals in the 24 hr (adenovector alone and prime-boost) to 48 hr (prime-boost) following each adenovector vaccination, but resolved (Figure 3). These reversible decreases in food consumption did not result in differences in body weights or changes in males or females inoculated with adenovector alone or treated males in the prime-boost regimen. However, possible prime-boost treatment effects were seen with body weights and changes in treated females. Differences began to be noted as early as Study Day (SD) 36 (priming phase), but became statistically significantly different from control females on SD 71, 78, 92, 99, and 108 for body weights and SD 85-92 for body weight changes in prime-boost treated females. Animals continued to gain weight throughout the study, but gained less weight than the controls. Whether this was a reflection of biological variability among animals or an actual treatment-related effect is unclear.
In Study E (Ebola), food consumption was also less in treated animals compared to controls (Figure 3). Statistically significant decreases (28–36% ↓) were seen in all treated groups (mut-treated males, mut-treated females, WT-treated males, WT-treated females) in the first 24 hr after the first inoculation (SD1-2). Because of fasting for blood draws on SD3, food consumption was not measured on SD2-3. However, there remained statistically significantly decreased food consumption (14–32% ↓) in the treated groups (although the decrease − 14% ↓ – for the mut-treated ♂ did not achieve statistical significance) on SD3-4. Furthermore, WT-treated females continued to have a statistically significantly decrease (13% ↓) in food consumption from SD4-5. In addition, one control male and one WT-treated female were supplemented from SD1-14 or 9-14, respectively, with fluids and food due to low food consumption.
After the second inoculation, all treated animals had statistically significant mean decreases (30–52% ↓) compared to controls on SD22-23. After this inoculation, the treated animals recovered normal (based on comparison to controls) food consumption by SD24-25 (food consumption was not measured on SD23-24, due to fasting for blood draws on SD24). Finally, after the third inoculation, mut-treated males had a statistically significant decrease (22% ↓) on SD43-44. Other incidences of statistically significantly different food consumption were noted as follows: decreases of 12% on SD33-34 in mut-treated ♂, 14% and 22% on SD52-53 in mut-treated and WT-treated ♀, respectively, and 15% on SD55-56 in WT-treated ♀. The relationship to treatment of these additional incidences of decreased food consumption remotely in time to vaccination without consistent pattern between treatment groups/genders is less clear and might be incidental (although they were all in the same direction, i.e., decreases). It should be noted, however, that the differences on SD52-53 and 55-56 are based on 5 animals/group rather than 10 animals/group due to the sacrifice of half the animals at SD45. Individual animal variations could potentially have more impact on the means with the smaller group sizes.
There were no differences seen between treated and control animals in terms of body weights even though there were effects on body weight changes. Between SD1-8, all treated animals had decreased body weight changes compared to controls (24%–52% ↓ for those achieving statistical significance), although this decrease did not achieve statistical significance in the mut-treated females (23% ↓). Furthermore, between SD22-29, mut-treated females were statistically significantly decreased in body weight change (29% ↓). The decreased body weight changes were not weight losses, but only lesser body weight gains over the time periods and did not result in differences in mean body weights between groups. These decreases in body weight changes probably reflect the decreased food consumption occurring immediately post-inoculation, described above.
In Study F (Marburg), although there were some statistically significant differences in food consumption between treated and control animals during the DNA vaccination priming phase of the study, the magnitude of these differences was small and the occurrence random in time (i.e., not necessarily immediately following vaccination). In contrast, in the days following adenovector boosts, mean food consumption had clear marked treatment-related impacts as follows: treated ♂ following first adenovector boost − 87.7% ↓ on SD85-86, 61.8% ↓ on SD86-7, 21% ↓ on SD87-8, 11% ↓ on SD88-9, and 18.6% ↑ on SD90-91, 12.3% ↑ on SD99-100, 15.5% ↑ on SD102-3, and 13.1% ↑ on SD103-4; treated ♀ following first adenovector boost − 81.3% ↓ on SD85-6, 40.3% ↓ on SD86-7; treated ♂ following second adenovector boost - 44% ↓ on SD106-7, 17.6% ↓ on SD107-8 and 43.3% ↑ on SD112-3; treated ♂ following second adenovector boost − 36.3% ↓ on SD106-7. The marked impact on food consumption was most prolonged and severe following first adenovector boost taking 4 d for treated males to return to normal food consumption and 2-3 d for treated females (Figure 3).
Body weight changes were affected by treatment in males though not females, likely reflective of the effects on food consumption following treatment, described above. During the DNA priming phase, the only statistically significant differences noted in mean body weight changes were a decrease between SD29 and 36 in treated females and an increase between SD64 and 71 in treated males. These likely reflect biological variability rather than a treatment effect. In contrast, subsequent to the adenovector delivery, treated males had a statistically significant decrease in mean body weight changes between SD85 and 92 (weight loss of 32.70 g [± 44.44, SD] vs. weight gain of 23.80 g [± 27.22]) and a statistically significant increase in mean body weight changes between SD99 and 106 (57.40 g [± 45.96] vs. 9.30 g [± 35.21]). There were no statistically significant differences in female mean body weight changes during this timeframe (subsequent to adenovector vaccinations).
In StudyG (Ad35), mild systemic reactions were noted in that treated animals had slightly lower increases in body weights and concordant lower weight changes and food consumption than controls. With regard to food consumption, transient decreases in both genders were noted in the 24 hr following the second adenovector delivery, in females in the 24 hr following the third adenovector delivery, and in males in the 48 hr following the third adenovector delivery, suggesting increasing reactogenicity with repeated dosing (Figure 3). This too was a clear distinction from the Ad5 vector, which demonstrated decreasing severity in this parameter with repeated dosing.
Clinical Pathology Parameters
In each of the repeated dose toxicology studies, there were many differences noted between control and treated groups in clinical chemistries and hematology parameters. Most differences were unclear in their relationship to treatment because they either remained within the normal historical control range for the species and laboratory even though they were statistically significantly different from matched control animals on study or, if they were outside the normal range and different from the control animals on study, they were not consistent between genders or across timepoints. Those clinical pathology parameters that were consistently different from controls between genders or across timepoints or studies are reported in Table 5. None of these findings appeared correlated with clinical observations or gross or histopathological findings. Thus, their clinical relevance is uncertain and presumed to demonstrate inflammation reflective of immune responses to vaccination.
Serum chemistries that appear to be impacted by treatment with adenovector vaccines include cholesterol and triglycerides in the period following initial inoculation, and globulin and A/G ratios following each inoculation. Serum globulin levels and the commensurate A/G ratios may reflect the intended immune response to vaccination and in fact, in each case, immunogenicity, as measured by ELISA, was demonstrated by study endpoint. While cholesterol and triglycerides were elevated following initial adenovector inoculations in most cases (see description of Study F below for exception), this may simply reflect inflammation in response to the recognition of expressed or delivered adenovector antigens. Other liver enzymes, such as ALT, AST, and alkaline phosphatase at the same timepoints were either not statistically significantly different from concurrent gender-matched controls or the differences were of a direction that did not indicate liver toxicity (e.g., the treated animals had lower values than the controls). Furthermore, these parameters were only sporadically different from controls and did not provide any consistent pattern.
In contrast to studies D (Ad5 HIV-1) and E (Ebola) in which cholesterol and triglycerides were elevated after the first adenovector dose, in study F (Marburg), these parameters were unaffected by adenovector boosting. However, triglycerides (but not cholesterol) were elevated at SD4 and SD30 (post DNA dosing) only in treated males. At the same time (SD4), other liver function tests were unaffected. At SD30, however, males had elevated AST compared to concurrent controls, remaining within the lower half of the normal range. At SD90, post adenovector dosing, treated males had elevated mean ALT, but treated females had lower mean AST and at SD120, post-second adenovector dosing, treated males had an elevated mean AST. Given the inconsistency of these results and the lack of liver histopathology noted that was not also seen in the controls, there did not appear to be liver toxicity.
Hematology parameters that appear to be impacted by adenovector delivery include hemoglobin, hematocrit, platelets, and mean platelet volume (MPV). It is not surprising that hemoglobin and hematocrits may decrease over time on study given that the animals are having frequent blood-draws. However, there does appear to be a consistent pattern in comparison to concurrent gender-matched controls in animals that receive adenovectors and these effects are seen at multiple timepoints across any particular study. While the mean values do sometimes fall outside the historical reference range, the magnitude of differences between the lower bound of the reference range and the mean values observed are small and likely not clinically significant.
Regarding coagulation parameters, all appear to be impacted by intramuscular adenovector delivery, as follows: Prothrombin time was frequently shortened at various time-points post-vaccination. There is no clinical relevance to shortened times. Activated Partial Thromboplastin time (APTT) was frequently prolonged, and many times outside the historical reference range. Fibrinogen was also frequently elevated and sometimes outside the historical reference range. These effects appeared to be reversible, as they were not generally observed by the recovery sacrifice timepoint (see Table 5). These effects were interpreted to be a reflection of acute inflammation due to the immune response to vaccination and inflammation associated with intramuscular delivery.
Immunogenicity
In Study D (Ad5 HIV only and prime-boost), immunogenicity results demonstrated that all vaccinated animals seroconverted to the HIV-1 EnvA, EnvB, EnvC, and gag antigens, both in the adenovector alone and the prime-boost arms. Endpoint titers were not determined, but all vaccinated animals were seropositive at the 1:1000 dilution. No placebo-recipients sero-converted. These results demonstrate that active doses of vaccine were delivered to the test animals and responses were made to all the plasmid- and adenovector-expressed components of the vaccines.
In Study E (Ebola), immunogenicity results demonstrated that all vaccinated animals seroconverted to both Ebola antigens in each vaccine. Endpoint titers were not determined, but all vaccinated animals were seropositive at the 1:10,000 dilution. No placebo-recipients seroconverted. These results demonstrate that active doses of vaccine were delivered to the test animals and that they responded to both adenovector-expressed components of the vaccines.
In Study F (Marburg), immunogenicity results provided evidence that active doses were delivered to the treated animals, and not the placebo-recipient animals in this study. All treated animals seroconverted to the Marburg glycoprotein with titers exceeding 1:10,000 after prime-boost vaccinations. All placebo-recipients remained seronegative.
In Study G (Ad35), immunogenicity results demonstrated that all vaccinated animals seroconverted to the EnvA antigen. Endpoint titers were not determined, but testing was performed on sera at dilutions of 1:100, 1:1000, and 1:10,000. All vaccinated animals remained seropositive at the 1:10,000 dilution. No placebo-recipients seroconverted. These results demonstrate that active doses of vaccine were delivered to the test animals.
Compliance
In Study D (Ad5 HIV only and prime-boost), all aspects of the study were conducted according to GLP except the immunogenicity analyses. Deviations reported would not have impacted the integrity of the study nor the conclusions drawn. However, on SD43 and SD64, all of the prime-boost control animals received their DNA plasmid placebo inoculation by needle and syringe rather than Biojector, as specified. While this makes comparisons between the controls and treated animals of the injection site Draize findings at timepoints immediately subsequent to these inoculations less relevant, it does not invalidate the findings in the treated animals relevant to the safety of the vaccine by the intended delivery device. In Study E (Ebola), all aspects were conducted according to GLP, except the immunogenicity analyses and that the Certificate of Analysis (COA) and stability were performed per Good Research Practices. Deviations reported would not have impacted the integrity of the study nor the conclusions drawn. In Study F (Marburg), all aspects were conducted according to GLP, except that the COA and stability analyses met Good Manufacturing Practices (GMP) standards and the immunogenicity analyses were performed in a laboratory following GLP, but by a non-validated method that was comparable to other validated methods also performed in the laboratory. Deviations reported would not have impacted the integrity of the study nor the conclusions drawn. In Study G (Ad35), all aspects were conducted according to GLP, except that the immunogenicity analyses were performed in a research setting. Deviations reported should not have impacted the integrity of the study nor the conclusions drawn.
Discussion and Conclusions
Adenovectors based on serotype 5 (subgroup C) or 35 (subgroup B), despite differences in the expressed trans-gene inserts or manufacturer's construct, have a similar and consistent pattern of biodistribution and clearance when doses of up to 1011 particle units or viral particles (PU/VP) are delivered intramuscularly by needle-and-syringe (the difference in units in which the doses are described are due to differences in assay methodology of the manufacturers). The adenovectors remain largely at the site of injection and do not extensively traffic outside that site. Ad5 vectors biodistributed only to the spleen and liver, whereas an Ad35 vector biodistributed to the spleen and iliac lymph nodes. It should be noted that the cellular receptors utilized by these viruses differ, in that Ad5 predominately binds CAR (coxsackie and adenovirus receptor) whereas Ad35 binds CD46 (membrane cofactor protein). However, when given intramuscularly, the vectors do not biodistribute widely, e.g., they do not traffic to the gonads. Furthermore, they were seen to clear from the sites to which they do biodistribute over the course of our 3-month studies, with fewer animals with positive tissues, fewer positive tissues in positive animals, and only very low copy numbers (range, 63-1474) remaining in the few tissues that remained positive at study endpoints despite an initial delivery of up to 1011 PU/VP.
While the appropriate analyses have not been performed yet to determine this, rather than the adenovectors actually distributing to other tissues directly, it seems likely that the adenovectors when delivered into the muscle may have transduced antigen-presenting cells (APC) resident there. These APC have likely trafficked to the lymphoid organs and the highly perfused liver. So, we hypothesize that in fact, the adenovectors have not themselves biodistrib-uted throughout the body, but have transduced cells at the injection site, which then traffic to specific organs. This hypothesis is consistent with recent findings that a chimp adenovirus vector was found predominately in CD8+ T-cells in the spleen some time after inoculation (Tatsis et al., 2007). Nevertheless, these biodistribution studies suggested that potential target organs for toxicity might be the spleen, liver, and/or lymph nodes as well as the sites of injection.
Gross or histopathology that differed between controls and treated animals was not found in these organs in the repeated dose toxicology studies except at the sites of injection. Nonetheless, some clinical pathology parameters related to liver function appear to have been impacted by adenovector delivery. Because these parameters were impacted both by delivery of Ad5, which trafficked to the liver, and Ad35, which did not, it would appear that the liver function-related clinical pathology parameters were not a direct toxic effect of adenovector delivery, but more likely represent a secondary effect of inflammation and immune response to the adenovectors and/or the expressed gene inserts.
Further, repeated dose toxicology studies of up to 2 × 10¹¹ PU/VP demonstrated similar and consistent patterns of toxicity for adenovectors based on Ad5 or Ad35, despite differences in the expressed trans-gene inserts or manufacturer's construct and whether they were given as a boost to a DNA plasmid vaccine prime or alone. The adenovectors for which results are reported herein came from two different manufacturers and contain differing adenovirus gene deletions (deleted in E1; E1 and E3; or E1, partial E3, and E4), representing differing constructs. Additionally, the vectors were manufactured by growth on different cell substrates and purified following different production methods. Furthermore, the expressed trans-gene inserts were from different viruses, including the HIV-1 envelope glycoprotein, gag, and polymerase genes (the first being from differing clades of HIV-1); the Ebola glycoprotein, containing either a point mutation which abrogates cellular toxicity noted in vitro (Sullivan et al., 2005) or as a WT construct; and the Marburg glycoprotein. Nevertheless, the toxicology profiles were consistent despite differences in the expressed trans-gene inserts or the manufacturers' constructions and production methods. These patterns can allow prediction of expected clinical reactogenicity for similar viral vaccine products based on Ad5 or Ad35.
The identified toxicity profile of these adenovector vaccines given intramuscularly alone or as a boost to a DNA plasmid vaccine prime is of limited and reversible local (Draize scores, histopathology at the sites of inoculation) and systemic reactogenicity (fevers and decreased food consumption in the period immediately following vaccination). Furthermore, certain clinical pathology parameters are impacted suggesting inflammation in relationship to vaccination.
It should be noted that most effects were seen consistently between genders. While there were some apparent gender differences in clinical pathology parameters, most of these “differences” (between genders) were not consistent across studies or timepoints, suggesting incidental, rather than real gender-related differences. It must be kept in mind, when analyzing apparent differences, that despite the number of parameters compared and the multiplicity of timepoints, adjustments for multiplicity are not performed on statistical analyses as the most stringent means to identify potential safety signals. Importantly, treatment-related differences in parameters that were seen consistently across timepoints or studies were noted in both genders at one timepoint or another, if not at each timepoint.
Our data suggest that Ad35 may be slightly less reactogenic systemically, at similar doses, than Ad5, as the febrile reactions seen in the Ad5 vector studies reported herein were not seen with Ad35 until doses of 1012 VP were given (Cheng et al., 2007, unpublished results). Furthermore, impacts on food consumption, another marker of systemic reactogenicity, were not seen following the initial injection of Ad35, but only after repeated dosing, whereas with Ad5 vectors, this impact was noted following even the initial inoculations and was perhaps more marked after those initial inoculations. However, consistent patterns of toxicity were seen in clinical pathology parameters, another marker of systemic reactogenicity, and injection site (local) reactogenicity.
Given that Ad5 and Ad35 enter cells through differing cellular receptors, one might have predicted that the target organs or cells and therefore, the toxicity profiles would differ. In fact, we have found that the toxicity profiles are quite similar and consistent, although Ad35 may be slightly less reactogenic systemically at the doses tested. This is consistent with our recent report in which we demonstrated that even when the fiber shaft of Ad5 vectors are modified to eliminate binding to the primary CAR or the secondary integrin RGD receptor or are switched with the fiber shaft of Ad35 (which utilizes CD46 as a receptor), they retain their ability to transfect, through a heparin-sensitive receptor, several dendritic cell and mononuclear cell subtypes, and they retain their pyrogenicity (Cheng et al., 2007), inducing both adaptive immunity and toxicity (pyrogenicity).
Given that the liver was identified in the biodistribution study as a potential target organ for toxicity, it should be noted that there was no evidence of treatment-related liver pathology, either grossly or histopathologically. Thus, we conclude that liver toxicity is not occurring when adenovectors are delivered intramuscularly at doses up to 2 × 10¹¹ PU/VP and that the elevated cholesterol and triglycerides are simply a reflection of an inflammatory response to vaccination. Importantly, despite reports of liver toxicity when similar or higher doses of adenovectors have been delivered by routes other than the intramuscular route studied here (Harvey et al., 2002; Raper et al., 2002), we have not noted any particular or consistent impact of vaccination on the liver – either in liver function tests, such as ALT, AST, or alkaline phosphatase, or by gross or histopathology (as discussed above).
We were particularly concerned about whether there might be an impact on hematology parameters given that some of the expressed antigens (Ebola and Marburg glycoproteins) are from viruses that cause hemorrhagic diseases. However, the effects were also seen with the Ebola glycoproteins into which point mutations have been introduced that abrogate cellular cytotoxicity observed in vitro and with the HIV-1 antigens (envelopes from Clades A, B, C, Clade B gag, Clade B pol). Thus, we conclude that like the other affected parameters, these effects on hemoglobin and hematocrit are related to adenovector delivery and not to the expressed trans-gene antigens. Furthermore, with regards to platelets and MPV, although in Studies D (Ad5 HIV alone and prime-boost) and E (Ebola), extremely mild thrombocytopenia was noted after the initial adenovector inoculation, and in Study E (Ebola), these mean values fell slightly outside the historical reference range, the severity was so slight that it is not likely to be clinically meaningful.
While it was a consistent finding that adenovector delivery intramuscularly resulted in shortened prothrombin times, shortened times are not clinically meaningful and we conclude that these results do not reflect any coagulation abnormalities. Of particular note is the consistent observation of prolonged activated partial thromboplastin time (APTT). This has also been observed clinically in association with adenovirus infection or adenovector delivery (Beck et al., 1979; Jaeger et al., 1993; Malaeb et al., 2005; unpublished data). In most of those cases, rather than an in vivo coagulation abnormality, it was found that the in vitro assay was impacted by the development of a “lupus anti-coagulant” or anti-phospholipid antibodies in the infected or inoculated individuals. Whether this is also happening in the case of the rabbits and the rabbit APTT assay is uncertain, but it is possible that the prolonged APTT represents a clinically benign effect of transient inflammation-induced anti-phospholipid antibody in the in vitro assay. While, adenovectors delivered intravascularly may bind to various coagulation factors (Parker et al., 2006), there was no clinical evidence of coagulation abnormalities in our studies. Therefore, we suggest that the adenovector delivery intramuscularly is not inducing clinically-relevant coagulation abnormalities, but that the APTT assay is indirectly detecting a transient rise in anti-phospholipid antibodies that are a byproduct of the vaccine-induced inflammation and immune responses. Further, the elevated fibrinogen values that are likely a reflection of a vaccine-induced inflammatory response support this interpretation.
We believe that our data suggest that whether the adenovectors are given alone or in a DNA prime-adenovector boost regimen, the toxicity profiles are consistent and similar, suggesting that prior priming with a DNA vaccine neither abrogates nor enhances significantly the adenovector-associated toxicity. Since we conclude that the toxicity is primarily related to the adenovectors rather than the expressed trans-genes that would be shared by the prime and boost, this is understandable. Further, the toxicity that is noted is essentially mild and reversible. These data suggest that toxicology studies of the individual vectors alone should be adequate to predict expected patterns of toxicity to support future uses of the same or related products in prime-boost clinical protocols without the need to delay clinical development to undertake additional toxicology studies. This can accelerate clinical development by as much as 8 months, depending on the number of primes and boosts that would be given.
Taken together, these data suggest that the biodistribution and toxicology profiles of adenovector vaccines are determined largely by the platform (Ad5 or Ad35) and not the expressed gene-insert (genes from HIV-1, Ebola, or Marburg), the manufacturer's construct (vectors deleted in E1, E1 & E3, or E1, partial E3, and E4 manufactured by either Crucell or GenVec), or whether they are given alone or as a boost to an DNA plasmid vaccine prime. These data demonstrate that Ad5 and Ad35 vectors delivered intramuscularly as vaccine expression systems at doses up to 2×10¹¹ PU/VP are safe and suitable for human clinical trials in healthy volunteers. In fact, the results of some of these studies have already been submitted to FDA and other regulatory authorities around the globe to support conduct of Phase 1 and Phase 2 clinical trials.
Clinical data from ongoing or completed vaccine trials of these Ad5-based candidates validate that systemic toxicity seen in rabbits is mimicked in humans (fevers, malaise, myalgia, chills) given the same doses and that lower doses reduce the frequency and/or severity of such systemic reactions in humans (Catanzaro et al., 2006, unpublished data). At present, there are insufficient clinical data with Ad35 vectors to validate the rabbit model; however, these data are emerging and these preliminary data are so far consistent with the preclinical findings and we take the similarities between Ad5 and Ad35 vectors in the rabbit to suggest the rabbit model is also valid for Ad35, despite the fact that it uses a different cellular receptor.
Three of the goals that FDA expects preclinical toxicology studies to accomplish include the following: (1) to recommend an initial safe starting dose and dose regimen in human subjects; (2) to identify potential target organs for toxicity related to the product; and, (3) to help determine an acceptable risk/benefit ratio for human subjects. We feel that these goals have been accomplished for adenovector types 5 and 35 vaccines to be delivered intramuscularly at doses up to 2 × 10¹¹ VP/PU with the studies reported herein. This body of data can progress clinical development of future candidates with significant savings in time and resources if repetition of studies, including additional studies of prime-boost regimens, can be avoided and safety of new candidates can be supported by studies already performed with candidates based on similar platforms. Such accelerated development of vaccine candidates is crucial given the enormous public health burden of HIV/AIDS, the ever-present threat of bioterrorism with agents such as Ebola or Marburg viruses, and the urgency to address emerging infections such as Sudden Acute Respiratory Syndrome (SARS), West Nile Virus, and pandemic influenza.
Acknowledgments
This research was supported by the Intramural Research Program of the National Institutes of Health, Vaccine Research Center, NIAID. The Authors would like to acknowledge the staff of Bridge Laboratories for the conduct of the biodistribution and toxicology studies and the staff of Althea Technologies, Inc. for the conduct of the biodistribution analyses and providing the clinical grade vaccine candidate tested in one safety study. Further, acknowledgement should be given to the staff of Crucell (Maria Grazia-Pau, Marcel Brink, Isabella Versteege, Jaap Goudsmit) and the staff of GenVec (Bryan Butman, Jason Gall, Douglas Brough, Victoria Haque, Perry Newton, Mike Sowers, and Alena Lizonova) for providing the clinical grade vaccine candidates tested in these safety studies. Finally, we thank Jason Gall, Bryan Butman, and Maria Grazia-Pau for their critical review of the manuscript.
Contributor Information
Rebecca L. Sheets, Vaccine Research Center-NIH/NIAID, Bethesda, Maryland, USA
Judith Stein, Vaccine Research Center-NIH/NIAID, Bethesda, Maryland, USA.
Robert T. Bailer, Vaccine Research Center-NIH/NIAID, Bethesda, Maryland, USA
Richard A. Koup, Vaccine Research Center-NIH/NIAID, Bethesda, Maryland, USA
Charla Andrews, Vaccine Research Center-NIH/NIAID, Bethesda, Maryland, USA.
Martha Nason, Biostatistics Research Branch, NIH/NIAID, Bethesda, Maryland, USA.
Bin He, Bridge Laboratories, Gaithersburg, Maryland, USA.
Edward Koo, Bridge Laboratories, Gaithersburg, Maryland, USA.
Holly Trotter, Althea Technologies, Inc., San Diego, California, USA.
Chris Duffy, Althea Technologies, Inc., San Diego, California, USA.
T. Scott Manetz, MedImmune, Inc., Gaithersburg, Maryland, USA.
Phillip Gomez, PRTM, Washington, DC, USA.
References
- Beck DW, Strauss RG, Kisker T, Henriksen RA. An Intrinsic Coagulation Pathway Inhibitor in a 3-year-old Child. AJCP. 1979;71:470–472. doi: 10.1093/ajcp/71.4.470. [DOI] [PubMed] [Google Scholar]
- Catanzaro AT, Koup RA, Roederer M, Bailer RT, Enama ME, Moodie Z, Gu L, Martin JE, Novik L, Chakrabarti BK, Butman BT, Gall JG, King CR, Andrews CA, Sheets RL, Gomez PL, Mascola JR, Nabel GJ, Graham BS, VRC006 Study Team Phase 1 safety and immunogenicity evaluation of a multiclade HIV-1 candidate vaccine delivered by a replication-defective recombinant adenovirus vector. J Infect Dis. 2006;194:1638–1649. doi: 10.1086/509258. [DOI] [PMC free article] [PubMed] [Google Scholar]
- CBER. Guidance for Industry: Considerations for Developmental Toxicity Studies for Preventive and Therapeutic Vaccines for Infectious Disease Indications. 2006. http://www.fda.gov/cber/gdlns/reprotox.htm.
- Chang PY, Roelands J, Schindler-Horvat J, Sheets RL. Chapter 14. Toxicity Testing of Vaccines. In: Sietsema W, Schwen R, editors. Nonclinical Drug Safety Assessment: Practical Considerations for Successful Registration. Washington, DC: FDAnews; 2007. pp. 331–343. [Google Scholar]
- Cheng C, Gall JG, Kong WP, Sheets RL, Gomez PL, King CR, Nabel GJ. Mechanism of Ad5 vaccine immunity and toxicity: Fiber shaft targeting of dendritic cells. PLoS Pathog. 2007;3:e25. doi: 10.1371/journal.ppat.0030025. [DOI] [PMC free article] [PubMed] [Google Scholar]
- Crucell. Press release: Crucell and AERAS Announce Start of Tuberculosis Vaccine Clinical Trial. 2006. 2006a. October 25, 2006. http://investors.crucell.com/C/132631/PR/200610/1083063_5_5.html.
- Crucell. Press release: Crucell and NIH Gain Approval and Move to Recruitment for Malaria Vaccine Clinical Study (2006) 2006b. December 19, 2006. http://investors.crucell.com/C/132631/PR/200612/1094140_5_5.html.
- GenVec. Press release: First Ad35-Based HIV-1 Vaccine Enters Phase 1 Clinical Trial at NIH (2007) 2007. June 21, 2007. http://www.genvec.com/download/press/GNVC_Ad35CLINICALTRIAL%20Release%20_FINALOUT__0620071.pdf.
- Graham BS, Koup RA, Roederer M, Bailer RT, Enama ME, Moodie Z, Martin JE, McCluskey MM, Chakrabarti BK, Lamoreaux L, Andrews CA, Gomez PL, Mascola JR, Nabel GJ, VRC004Study Team Phase 1 Safety and immunogenicity evaluation of a multiclade HIV-1 DNA candidate vaccine. J Infect Dis. 2006;194:1650–1660. doi: 10.1086/509259. [DOI] [PMC free article] [PubMed] [Google Scholar]
- Harvey BG, Maroni J, O'Donoghue KA, Chu KW, Muscat JC, Pippo AL, Wright CE, Hollmann C, Wisnivesky JP, Kessler PD, Rasmussen HS, Rosengart TK, Crystal RG. Safety of local delivery of low- and intermediate-dose adenovirus gene transfer vectors to individuals with a spectrum of morbid conditions. Hum Gene Ther. 2002;13:15–63. doi: 10.1089/10430340152712638. [DOI] [PubMed] [Google Scholar]
- Jaeger U, Kapiotis S, Pabinger I, Puchhammer E, Kyrle PA, Lechner K. Transient lupus anticoagulant associated with hypoprothrombinemia and Factor XII deficiency following adenovirus infection. Ann Hematol. 1993;67:95–99. doi: 10.1007/BF01788133. [DOI] [PubMed] [Google Scholar]
- Lee RC. The rectal temperature of the normal rabbit. Am J Physiol. 1939;125:521–529. [Google Scholar]
- Malaeb BS, Gardner TA, Margulis V, Yang L, Gillenwater JY, Chung LW, Macik G, Koeneman KS. Elevated activated partial thromboplastin time during administration of first-generation adenoviral vectors for gene therapy for prostate cancer: Identification of lupus anticoagulants. Urology. 2005;66:830–834. doi: 10.1016/j.urology.2005.04.041. [DOI] [PubMed] [Google Scholar]
- Parker AL, Waddinton SN, Nicol CG, Shayakhmetov DM, Buckley SM, Denby L, Kemball-Cook G, Ni S, Lieber A, McVey JH, Nicklin SA, Baker AH. Multiple vitamin K-dependent coagulation zymogens promote adenovirus-mediated gene delivery to hepatocytes. Blood. 2006;108(8):2254–2261. doi: 10.1182/blood-2006-04-008532. [DOI] [PubMed] [Google Scholar]
- Raper SE, Yudkoff M, Chirmule N, Gao GP, Nunes F, Haskal ZJ, Furth EE, Propert KJ, Robinson MB, Magosin S, Simoes H, Speicher L, Hughes J, Tazelaar J, Wivel NA, Wilson JM, Batshaw ML. A pilot study of in vivo liver-directed gene transfer with an adenoviral vectorin partial ornithine transcarbamylase deficiency. Hum Gene Ther. 2002;13:163–175. doi: 10.1089/10430340152712719. [DOI] [PubMed] [Google Scholar]
- Sheets RL, Stein J, Manetz TS, Duffy C, Nason M, Andrews C, Kong WP, Nabel GJ, Gomez PL. Biodistribution of DNA plasmid vaccines against HIV-1, Ebola, Severe Acute Respiratory Syndrome, or West Nile Virus is similar, without integration, despite differing plasmid backbones or gene inserts. Toxicol Sci. 2006a;91:610–619. doi: 10.1093/toxsci/kfj169. [DOI] [PMC free article] [PubMed] [Google Scholar]
- Sheets RL, Stein J, Manetz TS, Andrews C, Bailer R, Rathmann J, Gomez PL. Toxicological safety evaluation of DNA plasmid vaccines against HIV-1, Ebola, Severe Acute Respiratory Syndrome, or West Nile Virus is similar despite differing plasmid backbones or gene-inserts. Toxicol Sci. 2006b;91:620–630. doi: 10.1093/toxsci/kfj170. [DOI] [PMC free article] [PubMed] [Google Scholar]
- Sullivan NJ, Sanchez A, Rollin PE, Yang ZY, Nabel GJ. Development of a preventive vaccine for Ebola virus infection in primates. Nature. 2000;408:605–609. doi: 10.1038/35046108. [DOI] [PubMed] [Google Scholar]
- Sullivan NJ, Peterson M, Yang ZY, Kong WP, Duckers H, Nabel E, Nabel GJ. Ebola virus glycoprotein toxicity is mediated by a dynamin-dependent protein-trafficking Pathway. J Virol. 2005;79:547–553. doi: 10.1128/JVI.79.1.547-553.2005. [DOI] [PMC free article] [PubMed] [Google Scholar]
- Sullivan NJ, Geisbert TW, Geisbert JB, Shedlock DJ, Xu L, Lamoreaux L, Custers JH, Popernack PM, Yang ZY, Pau MG, Roederer M, Koup RA, Goudsmit J, Jahrling PB, Nabel GJ. Immune protection of nonhuman primates against Ebola virus with single low-dose adenovirus vectors encoding modified GPs. PLoS Med. 2006;3(6):e177. doi: 10.1371/journal.pmed.0030177. [DOI] [PMC free article] [PubMed] [Google Scholar]
- Sun Y, Schmitz JE, Buzby AP, Barker BR, Rao SS, Xu L, Yang ZY, Mascola JR, Nabel GJ, Letvin NL. Virus-specific cellular immune correlates of survival in vaccinated monkeys after simian immunodeficiency virus challenge. J Virol. 2006;80:10950–10956. doi: 10.1128/JVI.01458-06. [DOI] [PMC free article] [PubMed] [Google Scholar]
- Tatsis N, Fitzgerald JC, Reyes-Sandoval A, Harris-McCoy KC, Hensley SE, Zhou D, Lin SW, Bian A, Xiang ZQ, Iparragquirre A, Lopez-Camacho C, Wherry EJ, Ertl HCJ. Adenoviral vectors persist in vivo and maintain activated CD8+ T cells: Implications for their use as vaccines. Blood. 2007;110:1916–1923. doi: 10.1182/blood-2007-02-062117. [DOI] [PMC free article] [PubMed] [Google Scholar]
- Thorner AR, Lemckert AAC, Goudsmit J, Lynch DM, Ewald BA, Denholtz M, Havenga MJE, Barouch DH. Immunogenicity of heterologous recombinant adenovirus prime-boost vaccine regimens is enhanced by circumventing vector cross-reactivity. J Virol. 2006;80:12009–12016. doi: 10.1128/JVI.01749-06. [DOI] [PMC free article] [PubMed] [Google Scholar]