

Abstract
The paper describes droplet-to-bubble transition in block copolymer stabilized perfluoropentane nanoemulsions. Three physical factors that trigger droplet-to-bubble transition in liquid emulsions and gels were evaluated, namely heat, ultrasound, and injections through fine-gauge needles. Among those listed, ultrasound irradiation was found the most efficient factor. Possible mechanisms of bubble generation and growth discussed in the paper include liquid-to-gas transition inside the individual bubble; bubble coalescence; and diffusion of dissolved air and/or perfluoropentane from small bubbles into larger bubbles (i.e., Oswald ripening). The last two factors result in irreversibility of the droplet-to-bubble transition. In gel matrices, ultrasound-induced droplet-to-bubble transition was substantially inhibited but was catalyzed by large (hundred micron) pre-existing bubbles irradiated by low frequency (hundred kilohertz) ultrasound. The dependence of the droplet-to-bubble transition on initial bubble size is theoretically treated and the role of increase of surface area in promoting bubble coalescence is discussed. Therapeutic implications of observed effects are discussed.
Keywords: Nanoemulsions, Microbubbles, Vaporization, Thermal effects, Acoustic droplet vaporization, Ultrasound imaging, Ultrasound therapy
1. Introduction
For many decades, microbubbles have been used as contrast agents in ultrasound imaging. During the last decade, microbubbles have attracted attention as potential drug carriers and enhancers of drug and gene delivery and are now being widely investigated for this application [1-12]. The use of microbubbles as drug carriers allows for combined cost-effective ultrasound imaging and ultrasound-mediated therapy. Ultrasound has a number of attractive features as a drug delivery modality. Directing tumor sonication to a specific region of the target tissue is feasible [13]; ultrasound may be directed toward deeply located body sites. Sonication may be performed non-invasively or minimally invasively. For extracorporeal sonication, the transducer is placed in contact with a water-based gel or a water layer on the skin, and no insertion or surgery is required.
The ideal tumor-targeted microbubble-based drug carrier should satisfy the following criteria: (i) stability in circulation; (ii) prolonged circulation time to allow for effective accumulation in the targeted tissue; (iii) size that allows extravasation through tumor microvasculature (hundred nanometres); and (iv) efficient release of drug locally in tumor tissue in response to an external stimulus such as tumor-directed ultrasound.
It would be attractive to adapt FDA-approved ultrasound contrast agents as drug carriers. Several research groups have concentrated their efforts on developing microbubble-based drug delivery systems [14-18]. However, microbubble systems as tumor-targeted carriers present inherent problems. It is known that malignant tumors are characterized by defective vascular system with enhanced permeability; however inter-endothelial gaps in tumor capillaries rarely exceed 780 nm [19,20]. Contrast agent bubbles are several microns in size, which, in the absence of ultrasound, is much too large for extravasation. Ultrasound may increase vascular permeability, especially in the presence of microbubbles, as was demonstrated in rat muscle [21-23], brain [24], and other tissues. It was shown that increased vascular permeability may be achieved without excessive hemorrhage or endothelial cell death [24,25]. Bekeredjian et al. have achieved a highly specific plasmid delivery to the heart by attaching plasmid DNA to a microbubble shell; ultrasound-triggered microbubble destruction significantly enhanced transfection efficiency [26]. Recently, Caskey et al. showed that in small blood vessels, under the action of ultrasound, microbubbles experienced coalescence into bubbles larger than 4 μm; the latter underwent asymmetrical collapse and repeated expansion beyond blood vessel boundaries, which could result in increased vascular permeability [12]. However the clinical significance of increased vascular permeability for extravasation of micron-scale bubbles remains to be demonstrated. In addition to large size, lipid-coated microbubbles do not satisfy the need for stability in circulation and prolonged (hours) circulation time.
There is a trade off between size requirements for effective extravasation into tumor tissue and creation of effective ultrasound contrast. For effective extravasation, particle size should not exceed 750 nm while effective ultrasound contrast requires microbubbles of micron sizes. The best solution to this problem would be developing nano-scale microbubble precursors that would convert into microbubbles upon accumulation in tumor tissue. With this in mind, we have recently developed new drug carrier systems that are composed of drug-loaded, phase-shift nanoemulsions that convert into microbubbles in situ upon tumor accumulation.
The cores of nanoemulsion droplets are formed by organic perfluorocompound, perfluoropentane (PFP), which has a boiling temperature of 29 °C at atmospheric pressure. In nanodroplets, the PFP is encased by walls of biodegradable amphiphilic block copolymers, poly(ethylene oxide)-co-poly(L-lactade) (PEG-PLLA) or poly(ethylene oxide-co-polycaprolactone (PEG-PCL). Due to Laplace pressure, actual PFP vaporization temperature inside nanodroplets is much higher than 29 °C.
Due to high mismatch in acoustic impedances of perfluorocarbons and water (or tissue), both PFP droplets and bubbles are echogenic; however bubbles manifest much higher echogenicity than droplets. In addition, only bubbles undergo cavitation (oscillation, growth, and collapse in the ultrasound field), which concentrates ultrasound energy and dramatically enhances the intracellular drug uptake [7-11,27]. Therefore droplet vaporization with generation of block copolymer stabilized bubbles is expected to be highly desirable for both ultrasonography and drug delivery. Using drug-loaded nanodroplets as drug carriers and ultrasound as a triggering agent, we have achieved successful ultrasound-mediated chemotherapy of breast, ovarian, and pancreatic tumors in murine models [7-11].
Physical factors that trigger droplet-to-bubble transitions are discussed below.
2. Materials and Methods
2.1. Block copolymers
The block copolymers used in this study were obtained from Polymer Source Inc. (Montreal, Quebec, Canada). The PEG-PLLA copolymer had a total molecular weight of 9,700; the molecular weights of a hydrophilic PEG block and a hydrophobic PLLA block were 5,000 D and 4,700 D respectively. The numbers of monomer units in the corresponding blocks were 113.6 and 54.7. The PEG-PCL copolymer had a total molecular weight of 4,600 D; the molecular weights of a PEG block and PCL block were 2000 D and 2600 D respectively. The numbers of monomer units in the corresponding blocks were 45.5 and 22.8.
2.2. Micellar solutions
Micellar solutions of the block copolymers were prepared by a solvent exchange technique as described in detail previously [7].
2.3. Nanoemulsions
Nanoemulsions were prepared as follows: for optical measurements, 2% vol. PFP was added to 0.5% PEG-PLLA; for other measurements, 1% PFP was added to 0.25% PEG-PLLA or 0.25% PEG-PCL micelles. These samples were sonicated in ice-cold water by 20-kHz ultrasound until all PFP was transferred into emulsion.
2.4. Particle size distribution
Size distribution of nanoparticles was measured by dynamic light scattering at a scattering angle of 165° using Delsa Nano S instrument (Beckman Coulter, Osaka, Japan) equipped with a 658-nm laser and a temperature controller. Particle size distribution was analyzed using non-negative least squares (NNLS) method.
All the measurements were performed at 25 °C. Standard deviation was equal or below 20% of the measured peak size. The instrument allows for measurement of particle size distribution in the range of 0.6 nm to 7 μm; microparticles larger than 7 μm escape exact measurement. However, optical monitoring of the samples using an inverted microscope and hemocytometer (model 3200, Hauser Scientific, Horsham, PA) indicated the absence of microdroplets larger than 7 μm. The hemocytometer was used for measuring mean concentration of microdroplets.
2.5. Optical and fluorescence imaging
For visual monitoring of nanodroplet and microbubble behavior, the formulations consisting of 0.5% PEG-PLLA/2% PFP were placed in closed plastic capillary tubes (internal diameter of 340 μm) of snake mixer slides (XXS, Zweibrucken, Germany) and examined under the 100× magnification using a Nikon Fluophot fluorescence microscope (Nikon USA, Melville, NY) equipped with a sample heating stage TCS-100 (AmScope, Chino, CA) that provided for sample heating up to 50 °C. In the experiments involving the cells, cell suspension was first pre-mixed with a desired DOX-containing PBS solution or nanodroplet formulation and then placed in the capillary tube of the mixer slide.
2.6. Nanodroplet introduction into gels
To introduce nanoemulsion into plasma clots, equal volumes (200 μL each) of a nanodroplet emulsion and bovine plasma (Innovative Research, Novi, MI) were gently mixed. The clotting was initiated by adding 10 μL of 20 IU/mL bovine thrombin (Sigma-Aldrich, St. Louis, MO) and 0.5 mol/L calcium chloride. The mixture was drawn into a Samco transfer pipette (Fisher Scientific, Pittsburg, PA) and stored in the refrigerator (4 °C). For nanodroplet introduction into agarose gel, 0.2% agarose in phosphate buffered saline (PBS) was used.
2.7. Sound phase velocity and attenuation
Sound phase velocity was measured by a sample substitution technique. The sample was injected into the Samco transfer pipette of 12.5-mm internal diameter and placed on the way of the ultrasound beam that was generated by a transmitting transducer having a central frequency of 500 kHz (V318, Panametrics, Waltham, MA) or 1.0 MHz (V314, Panametrics, Waltham, MA). The transducers were broadband and were driven by a 5 cycle burst at frequencies around their fundamental frequency and third harmonic. Thus data were obtained at 300 kHz, 600 kHz, 1.0 MHz, 2.5 MHz, and 3.0 MHz. On the other side of the sample the beam was detected by hydrophone (TNU 100A, NTR Systems, Seattle, WA) with a 40-dB preamplifier (Model 5678, Panametrics, Waltham, MA). A time-domain signal of the received pressure waveform was stored for further analysis. The data were analyzed using MATLAB software (The MathWorks, Natick, MA). At each given ultrasound frequency, the relative phase velocity and attenuation coefficient of the sample were calculated by comparing its waveform with the waveform from phosphate buffered saline (PBS) measured in the same test tube. Attenuation was calculated using the following equation (written by DAC):
| (1) |
where n is the number of data points in each waveform, p and pPBS are the pressures of the sound wave from the sample and PBS respectively, and L is the thickness of the sample through which the beam travels. The phase velocity of the sample was obtained by comparing the arrival time of the sample waveform with the PBS reference waveform, and utilizing the known speed of sound in PBS. Because both sample and PBS were measured in the same test tube, no correction for reflection from the test tube wall was needed.
2.8. Sonication
Unfocused 1- or 3-MHz continuous wave ultrasound was generated by an Omnisound 3000 instrument (Accelerated Care Plus Inc, Sparks, NV) equipped with a 5-cm2 transducer head. The maximal nominal output intensities used in this study were 3.4 W/cm2 (1 MHz) and 2 W/cm2 (3 MHz). The actual measured peak-to-peak pressures at 5 mm from the radiating surface (i.e. at the site of the sample location) were 1.2 MPa and 1.7 MPa respectively. To generate 90-kHz ultrasound, a box type sonicator (SC-100, Sonicor Instrument Co., Copiague, NY) was used at a peak-to-peak pressure of approximately 0.7 MPa.
For the optical and fluorescence imaging experiments, unfocused ultrasound was applied through Aquasonic coupling gel to the region of the slide outside of the visual field. Note that in these experiments, sonication proceeded in the near field of the ultrasound transducer, and therefore the ultrasound energy experienced by the sample could be different from the nominal output energy indicated by the ultrasound-generating instrument.
3. Results and Discussion
3.1. Size distributions
The size distribution parameters for PEG-PLLA micelles and nanodroplets at room temperature are presented in Figure 1. The size distribution of micelles is bimodal, with smaller particles corresponding presumably to individual spherical micelles while larger particles represent either worm-like micelles or micellar aggregates. After the PFP introduction into the solution of empty micelles, the formation of nanoemulsion results in a disappearance of small micelles (22.2 nm) and generation of nanodroplets (592.6 nm, 73%); some fraction of larger micelles (117.5 nm, 27%) remain in emulsion.
Figure 1.
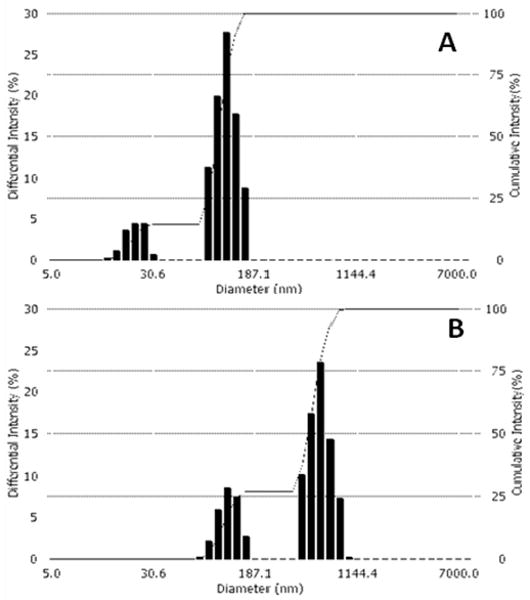
Particle size distribution for 0.25% PEG-PLLA micelles (A) and 1% PFP/0.25% PEG-PLLA nanoemulsion (B). The dashed lines indicate cumulative intensity.
3.2. Droplet-to-bubble transitions
We have identified several factors that trigger droplet-to-bubble transition: heat (thermal factor), ultrasound (mechanical and/or thermal factor), and injection through a fine-gauge needle (mechanical factor). These factors are discussed below.
3.2.1. Heat-induced droplet-to-bubble transition
Heat-induced droplet vaporization was visualized by heating nanodroplet samples using the microscope heating plate; the samples were injected at room temperature into closed plastic capillary tubes (internal diameter of 320 μm). A small number of bubbles were already observed at room temperature. These bubbles were formed during sample injection into the capillary (see below, section 3.2.3); these bubbles floated in a ‘sea’ of small nanodroplets that could not be resolved optically at magnifications used. The pre-existing bubbles grew upon heating as shown in Figure 2. There are at least three different mechanisms of bubble growth: (1) transition of the preserved liquid into the gaseous phase inside a confined particle space; (2) droplet/bubble coalescence or bubble coalescence; and (3) diffusion of dissolved air and/or PFP from small bubbles into larger bubbles (i.e., Oswald ripening) [28].
Figure 2.
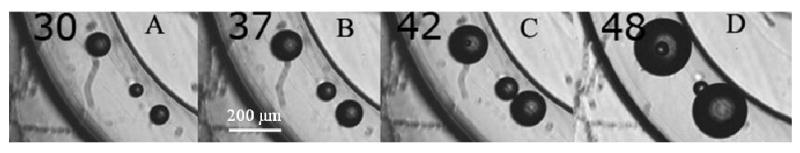
Heat-induced growth of pre-existing 2% PFP/0.5% PEG-PLLA bubbles in closed plastic capillaries. The formation of gas nuclei, small bubble uptake and coalescence with large bubbles are seen at 42 °C and 48 °C.
The liquid-to-gas transition inside a bubble appears to proceed by nucleation mechanism, as manifested by the generation of a small bubble inside the pre-existing bubble visualized in Figs. 2C and 2D at 42 °C and 48 °C. The small new bubble presumably formed in the liquid phase that was preserved inside the large bubble at 42 °C. The small internal bubble grew with increasing temperature (compare photographs for 42 °C and 48 °C) and eventually popped inside the host bubble.
At each temperature below critical temperature, relative fractions of liquid and gaseous phases inside a bubble are controlled by the Maxwell equal-area rule applied to the Van-der-Vaals equation of state described in statistical physics textbooks (e.g. [29]). Data presented in Figure 2 show that heat-induced droplet-to-bubble transition is not efficient; it mainly results in growth of pre-existing bubbles. Below we discuss possible mechanisms of this phenomenon.
The PFP has a boiling temperature of 29 °C at atmospheric pressure. However when the PFP is localized inside nanodroplets stabilized by block copolymer walls, the Laplace pressure that is created inside nanodroplets (see eq. 2) results in an increase of PFP boiling temperature.
| (2) |
where Pinside is the pressure inside a droplet, Poutside is the pressure outside a droplet, σ is the surface tension, and r is droplet radius.
According to eq. 2, droplets manifest distribution of boiling temperatures corresponding to their size distribution. Vaporization temperature of droplets with different sizes may be estimated using the Antoine equation for temperature dependence of vapor pressure, with the coefficients for PFP given in ref. [30]:
| (3) |
where T is absolute temperature and A, B, and C are constants.
In what follows, we estimate boiling temperatures for the PFP localized in droplets of various sizes. In these calculations, we neglect an elastic component of the total pressure that could be created by the two-dimensional stretching deformation of a polymer coating that is expected to accompany the increase of the particle surface area. For rigid and crystallyzable hydrophobic blocks such as PLLA, the elastic deformation contribution may be significant; therefore using surface tension alone for calculating internal pressures may result in underestimation of actual vaporization temperatures. To the best of our knowledge, the data on elastic properties of PEG-PLLA or PEG-PCL block copolymers at stretching deformation have not been reported in the literature; Young's modulus values for the homopolymers of hydrophobic blocks (345 MPa for PCL and 4,140 MPa for PLLA in a block material) may, however, provide some guidance and explain differences observed in the ultrasound response of PEG-PLLA and PEG-PCL stabilized PFP nanodroplets reported in refs.[8,10].
At this time, we do not have data on the surface tension for PFP droplets stabilized by PEG-PLLA or PEG-PCL copolymers at the PFP/water or PFP/PBS interface. For the calculations presented here, we analyzed literature data. The published values of surface tension for poly(ethylene oxide) at the air/water interface vary between 41 mN/m and 44 mN/m (www.medicinescomplete.com/mc/excipients/current/1000304950.htm).
Comprehensive information on surface tensions for a family of the poly(ethylene oxide)-co-poly(propylene oxide)-co-poly(ethylene oxide) triblock copolymers (PEO-PPO-PEO, Pluronics) was presented in the review by Alexandridis and Hatton [31]. Surface tension depended on the hydrophobic/hydrophilic balance of copolymer molecules and varied from 33 mN/m (for copolymers with a large fraction of a hydrophobic PPO block) to 52 mN/m (for copolymers with a large fraction of a hydrophilic PEO block. For the same PEO fraction of 80% wt, surface tension dropped from 52 mN/m to 41 mN/m with increasing length of PEO block. For most Pluronic copolymers, the surface tensions varied between 42 mN/m and 48 mN/m; among twenty five copolymers of a Pluronic family, only six manifested surface tension value below 40 mN/m. For the copolymers with poly(ethylene oxide) block lengths close to those used in this study (but with a lower hydrophobic fraction), surface tension was in the range of 48 mN/m to 50 mN/m.
The estimates of vaporization temperatures for various sized PFP droplets presented below are for illustration purposes only. To illustrate the role of droplet size and surface tension, the vaporization temperatures were calculated using surface tension values of 30 mN/m and 50 mN/m. As an example, for a droplet of 500-nm size (r = 250 nm, σ = 50 mN/m), this estimation gave a boiling temperature of 81.3 °C, which is much above physiological temperatures. Even for a 2-μm diameter droplet (r = 1000 nm, σ = 50 mN/m), vaporization temperature of 49.4 °C was still substantially above physiological temperatures. At 37 °C, the vaporization will start and equilibrium between liquid and gaseous phases will be maintained in droplets of about 6.4 μm diameter for σ = 50 mN/m and in droplets of 4 μm diameter for σ = 30 mN/m. Larger droplets will vaporize. However, droplets of these sizes are not present in initial nanoemulsions. This means that at physiological temperatures, upon systemic injections, droplets of initial nanoemulsions are expected to remain in the circulation in a liquid state and therefore retain their nanoscale size, which is important for nanodroplet extravasation into tumor tissue. The exceptions from this situation are discussed in Section 3.2.3.
The heat-induced vaporization process is expected to be reversible. However, this has been observed only for a very short cooling-heating cycle, with upper heating temperature of 42 °C [7]. As explained in ref. [7], the lack of reversibility was mostly associated with very strong coalescence of small primary microbubbles (one to two micron size) into much larger secondary microbubbles (tens or hundreds micron size) [7]. Besides bubble coalescence, diffusion of dissolved air or diffusion of PFP from small bubble to larger bubbles (i.e., Oswald ripening [28]) may cause bubbles to grow and disrupt reversible vaporization.
Increasing bubble size through coalescence decreases vaporization temperature. For droplets smaller than about 4 μm at σ = 30 mN/m, the vaporization temperatures will be above physiological temperatures and their steady state in physiological conditions will be as emulsion droplets. However for droplets larger than 4 μm, vaporization temperatures will be below physiological temperatures; these particles, if formed in vivo, will remain as bubbles. Note that the indicated borderline bubble size is an estimate neglecting the elastic properties of the bubble coatings; as explained above, if the coating elasticity plays an important role, the particle size corresponding to the liquid/gas equilibrium at physiological temperature will be higher.
Bubble coalescence is driven by an increase of particle surface during droplet-to-bubble transition. Calculations show that due to density differences between the liquid and gaseous phase of PFP, complete droplet vaporization results in a 125-fold increase of particle volume. This corresponds to a 5-fold increase of particle radius, a 25-fold increase of surface area, and a corresponding decrease in droplet wall thickness. Increased surface area results in decreased surface density of surface active copolymer molecules, which in turn causes an increase of the surface tension, thus promoting bubble coalescence. Upon coalescence, the particles' surface-to-volume ratios drop. As an example, after coalescence of eight bubbles of equal sizes, total volume of the new bubble increases 8-fold while the surface area increases only 4-fold. For coalescence of 27 equal bubbles, the total volume increases 27-fold while the surface area increases 9-fold. Reducing surface-to-volume ratio is the main driving force of bubble coalescence.
Another possible source of reducing the surface tension upon droplet-to-bubble transition is diffusion and adsorption of copolymer molecules if they are present in excess in an initial nanodroplet formulation and preserved in the form of micelles. By occupying empty surface sites, the copolymer molecules reduce the surface tension and therefore decrease the propensity to bubble coalescence. This may present a strategy for regulating bubble sizes after droplet-to-bubble transition.
We have hypothesized that droplet-to-bubble conversion is an important factor responsible for release of nanodroplet-encapsulated drug [11]. The initial thickness of the droplet wall was estimated based on the concentrations of the PFP (1% vol.), copolymer (0.25 % wt), droplet size, and droplet concentration. For a 500-nm diameter droplet, this estimation gave a value of 30 nm. Complete PFP vaporization inside this droplet would result in a decrease of the wall thickness to 1.2 nm, which may significantly facilitate drug release, especially under the action of ultrasound. Therefore droplet-to-bubble transition in the tumor tissue is likely to be a highly desirable event.
As shown above, nanodroplet vaporization via heating is inefficient and requires temperatures that are well above the physiological range. In what follows, we explore ultrasound as the vaporization triggering factor.
3.2.2. Ultrasound-induced droplet-to-bubble transition
This effect has been discussed in detail by others in refs. [32-34]. Ultrasound-induced droplet-to-bubble transition is called acoustic droplet vaporization (ADV). For our nanodroplet systems, we have described the ADV in liquid nanoemulsions and gels in ref. [10]. Droplet-to-bubble transition occurs when ultrasound pressure increases above a certain threshold. In our systems, the ADV threshold depended on the type of the droplet-stabilizing copolymer and was lower for PEG-PCL stabilized droplets compared with PEG-PLLA stabilized droplets. At the same delivered ultrasound energy, the ADV threshold was higher for pulsed ultrasound than for CW ultrasound. Vaporization thresholds were significantly lower at 37 °C than at room temperature.
Droplet-to-bubble transition in gels is substantially hampered in comparison to liquid emulsions, most probably due to higher resistance to the expansion of the droplet wall. The important finding is related to the ADV catalysis by pre-existing bubbles in gel matrices (Figure 3). This effect is much stronger for low-frequency (hundred kilohertz range) ultrasound than for megahertz range ultrasound. While 1-MHz or 3–MHz ultrasound induces droplet-to-bubble transition only in the immediate vicinity of the preexisting bubbles [10], low-frequency ultrasound, even at lower energies, manifests a long-range ADV effect. The pre-existing bubbles show a clear catalytic effect on the droplet vaporization. When newly formed bubbles grow by coalescence to form bubbles of a resonance size, these bubbles nucleate droplet-to-bubble transition in their vicinity. This way droplet-to-bubble transitions initiated by pre-existing bubbles propagates through the sample volume. The “explosive” droplet-to-bubble transition was observed during 90-kHz sonication of gel within a half-submerged test tube (Figure 4).
Figure 3.
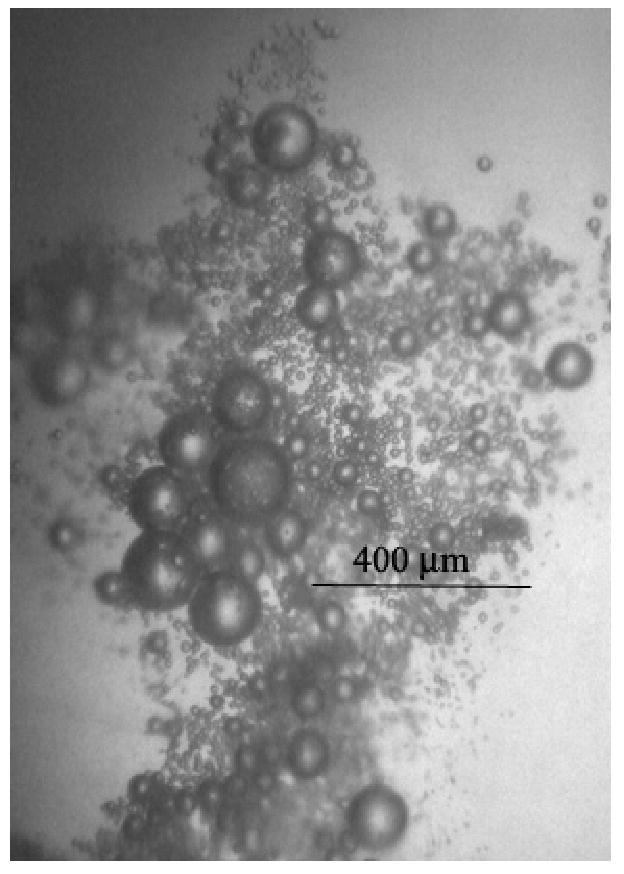
Droplet-to-bubble transitions induced by a pre-existing (large) bubble and 90-kHz (right) ultrasound at room temperature in the 1% PFP/0.25% PEG-PCL nanodroplets inserted in plasma clot. Only one (the largest) bubble was located at this spot before sonication. The ADV effect of the pre-existing bubbles is autocatalytic because when newly formed bubbles grow by coalescence to form bubbles of a resonance size, these bubbles nucleate droplet-to-bubble transition in their vicinity. This way droplet-to-bubble transitions initiated by pre-existing bubbles propagates through the sample volume as illustrated in Figure 4.
Figure 4.
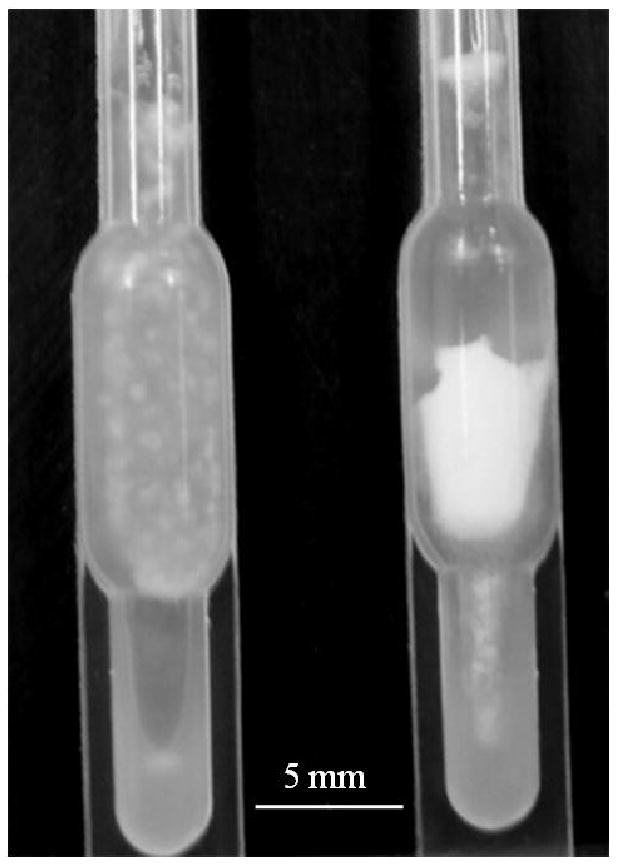
An “explosive” droplet-to-bubble transition triggered by 90-kHz ultrasound in the plasma clot that contained preexisting 1% PFP/0.25% PEG-PCL microbubbles; left – before, right – after sample sonication with 90-kHz in the ultrasound bath.
The exact mechanism of the ADV effect requires further explanation. The vaporization is presumably induced by decrease of Poutside during the rarefactional phase of ultrasound (eq. 2), which at sufficiently low Poutside may decrease PFP boiling temperature below room temperature. When non-linear effects are absent, this effect is expected to be reversible, with PFP condensation proceeding at the compression phase. However, the situation is not that simple. As shown in ref. [33], the vaporization does not proceed during one ultrasound cycle; vaporization requires formation of a nucleus or nuclei which form and grow in the course of sonication, eventually leading to massive vaporization. Gas condensation may also require formation of liquid nuclei inside the bubbles that are formed; if a hysteresis exists between formations of gaseous nucleus in a droplet volume and liquid nucleus in a bubble volume, the net effect would be droplet vaporization. In addition, bubble coalescence and diffusion of ambient gases into bubbles formed would result in irreversibility of vaporization, as explained in the previous section. Though the condensation of small bubbles is actually observed between ultrasound pulses or when ultrasound is turned off, for larger bubbles the net effect of sonication is efficient droplet vaporization (Figures 3 and 4). Simulations of bubble coalescence and gas diffusion in gel matrices are required to validate or reject proposed hypotheses.
The frequency effect on vaporization may be qualitatively explained by a longer rarefactional phase of ultrasound at lower frequencies, which is 10-fold longer for 100-kHz ultrasound (5 μs) than for 1-MHz ultrasound (0.5 μs). Longer rarefactional phase provides more chances for coalescence and/or diffusion.
The effect of a type of wall-stabilizing copolymer is most probably associated with differences in wall rigidity. As discussed earlier, droplet vaporization is associated with increase of a particle surface area. This requires motion of polymeric molecules over the bubble surface. The motion is more restricted for rigid polymer blocks like those of PLLA (glass transition temperature of about 60 °C) than for soft blocks like those of PCL (glass transition temperature of - 60°C), which is consistent with a lower vaporization threshold for PEG-PCL – stabilized bubbles [10].
3.2.3. Injection-induced droplet-to-bubble transition
Some droplet-to-bubble transition occurs during nanoemulsion injection through fine-gauge needles [11]. This effect was observed earlier for Echogen perfluoropentane droplets; its clinical implications were discussed in ref. [35]. This droplet-to-bubble transition was studied here with ultrasound imaging as bubbles are of higher echogenicity than droplets.
The generation of bubbles upon nanoemulsion injection into agarose gel is illustrated in Figure 5. The figure shows that injection through a fine-gauge needle (26 G) is much more efficient in inducing droplet-to-bubble transition than through a thicker needle (18 G) (compare Figure 5a and 5B). Injection through the thin needle results in immediate formation of very bright bubbles, the size and brightness of which increase with time, suggesting growth; the brightness of the residual droplets also increases with time, suggesting a post-injection droplet-to-bubble transition (compare Figures 5B and 5C).
Figure 5.
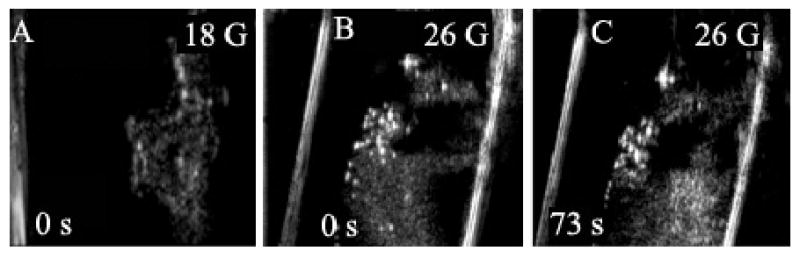
Ultrasound images of 1% PFP/0.25% PEG-PCL nanodroplets injected into agarose gel through an 18-G (A) or 26-G (B, C) needle. Injection through a thin needle results in immediate formation of very bright bubbles whose size and brightness increases with time; the brightness of the residual droplets also increases with time suggesting a post-injection droplet-to-bubble transition in a gel matrix (compare 5B and 5C).
This may have important implications for therapeutic application of the perfluoropentane nanoemulsions. Upon nanoemulsion injection, generation of microbubbles in the vascular bed may be beneficial. As discussed in the Introduction, local sonication of tumor blood vessels in the presence of microbubbles may result in increased vascular permeability. However massive transition of drug-loaded PFP nanodroplets into microbubbles inside blood vessels should be prevented because only nanodroplets not microbubbles extravasate into tumor tissue. To prevent excessive droplet-to-bubble transition, systemic injection of PFP nanoemulsions should be performed either by infusion or injection through large-gauge needles.
Droplet-to-bubble transition upon injection may be related to a hydrodynamic cavitation that could potentially nucleate the transition; shear stresses causing droplet deformation could also lead to shell rupture or non-uniform Laplace pressure [33]. Experimental observations have shown that phase transitions may occur when a sphere touching a wall is pulled away [33]. Similar situations can occur during droplet collisions or when a droplet interacts with a wall; this may explain the observation of preferential bubble initiation on test tube walls [10]. This may also be one of the mechanisms involved in the ADV catalysis by pre-existing bubbles.
Direct injection of nanoemulsion into tumors in vivo generates stable microbubbles that survive for more than a month in tumor tissue (Figure 6). These bubbles can be used as ADV catalysts to trigger droplet-to-bubble transitions in extravasated nanodroplets.
Figure 6.
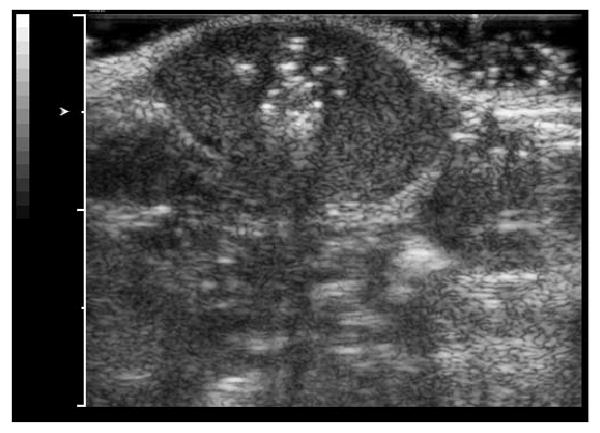
Ultrasound image of a MDA MB231 breast cancer tumor grown subcutaneously in a nu/nu mouse; the image was taken a month after a direct intratumoral injection of a 100 μl of a 1% PFP/0.25% PEG-PCL nanoemulsion.
3.2.4. Sound speed and attenuation
Droplet-to-bubble transition upon injection was also monitored by measuring ultrasound phase velocity and attenuation. This provided information on some acoustic parameters of the developed systems. Precise measurements of acoustic parameters in the phase-shift systems are complicated by the fact that system properties change during the measurement: large bubbles rise to the sample surface due to buoyancy while heavy droplets precipitate thus going out of the range of a measuring hydrophone. When comparing various samples, the conditions of sample preparation for measurements and the time between sample placement and start of the measurement have been strictly maintained throughout the study. Still, the parameters presented for aqueous suspensions should be considered as manifesting trends rather than precise values.
The data for the PEG-PLLA or PEG-PCL systems at room temperature and 37 °C (Tables 1 and 2) are presented for samples injected into the measurement cuvette through a thin plastic tube (internal diameter 0.7 mm) attached to a syringe needle (20 G, internal diameter 0.534 mm). During the first several minutes, the acoustic properties of the samples changed dramatically. Immediately after sample injection, very high attenuation that often exceeded the instrument's measurement capacity was observed at low frequencies (300 kHz to 500 kHz) but not at higher frequencies (1 MHz, 3 MHz). This effect was observed independent of the measurement direction (from low to high frequency or in reverse order). After seven minutes of equilibration, sound attenuation at low frequencies decreased to relatively stable values. The data presented in Tables 1 and 2 are for the samples equilibrated for seven minutes after injection.
Table 1.
Acoustic parameters of the PEG-PLLA stabilized PFP nanodroplets suspended in PBS.
| Sample | Sound speed at 2.5 MHz, m/s | ||
|---|---|---|---|
| PEG-PLLA micelles | PFP/PEG-PLLA nanodroplets, RT 7-min time point | PFP/PEG-PLLA nanodroplets 37 °C 7-min time point | |
| 1497 | 1491 | 1459 | |
| Sound frequency, MHz | Attenuation, dB/cm | ||
| 0.6 | <0.25 | <0.25 | 3.35 |
| 1.0 | <0.25 | <0.25 | 1.92 |
| 3.0 | <0.25 | 0.26 | 1.25 |
Table 2.
Acoustic parameters of the PEG-PCL stabilized PFP nanodroplets suspended in PBS.
| Sample | Sound speed at 2.5 MHz, m/s | ||
|---|---|---|---|
| PEG-PCL micelles | PFP/PEG-PCL nanodroplets, RT 7-min time point | PFP/PEG-PCL nanodroplets 37 °C 7-min time point | |
| 1501 | 1468 | 1458 | |
| Sound frequency, MHz | Attenuation, dB/cm | ||
| 0.3 | <0.25 | 0.6 | 1.82 |
| 0.6 | <0.25 | <0.25 | 0.81 |
| 1.0 | <0.25 | <0.25 | 0.6 |
| 3.0 | <0.25 | 0.43 | 3.7 |
The first period of very high attenuation and instability was associated with generation of large bubbles with high buoyancy upon sample injection. These bubbles rose to the sample surface out of the hydrophone's sensitive volume. The time course of the sample equilibration manifested a clear induction period (Figure 7). This suggests that the formation of large bubbles accelerated after sample injection. This is attributed to coalescence of smaller bubbles generated during and after sample injection, as confirmed by ultrasound imaging (Figure 5).
Figure 7.

Time course of the magnitude of the pressure transmitted through the sample and recorded by the hydrophone in the course of sound attenuation measurements. The hydrophone signal increases because large bubbles that cause sound attenuation raise to the sample surface out of the hydrophone's sensitive volume. The time course of the sample equilibration manifests a clear induction period. This suggests that the formation of large bubbles accelerates after sample injection, which is attributed to coalescence of smaller bubbles generated during and after sample injection, as confirmed by ultrasound imaging of Figure 5.
The speed of sound did not depend on frequency in the range of 0.6 MHz to 3 MHz. The data of Tables 1 and 2 show that neither PEG-PLLA nor PEG-PCL micelles change the sound speed characteristic of PBS (1495 ± 7 m/s). Formation of nanodroplets did not change the sound speed for the PFP/PEG-PLLA nanoemulsions (1497 ± 2 m/s) but resulted in some decrease of the sound speed (1467 ± 1 m/s) in PFP/PEG-PCL nanoemulsions.
Heating the nanoemulsions to 37 °C results in a slight decrease of sound speed and an increase of sound attenuation. This suggests a partial formation of small bubbles that persist in the measurement region.
In bubbly liquids, based on theoretical considerations, the sound speed is sensitive to the resonance frequency and the damping losses of the bubbles as well as sound absorption by a substrate without bubbles (the latter is related to the substrate's attenuation coefficient) [36,37]. The sound speed could depend on the type of the bubble wall copolymer because it introduces an additional damping mechanism that affects both the resonance frequency of the bubbles and the total losses in the bubbles [38,39]. The introduction of 1% PFP bubbles decreases the system density by only about 1%, which would cause a negligible change of the sound speed. Therefore the decrease of the sound speed observed upon nanodroplet heating to 37 °C is most probably caused by factors other than density changes (e.g., increased compressibility upon microbubble formation, damping losses, etc). Evaluation of these factors goes beyond the scope of the present paper.
The attenuation measured in this work included both ultrasound absorption and scattering. Because the scattering increases with increasing frequency, the observed decrease of the attenuation with increasing frequency (Tables 1 and 2) suggests that high attenuation at lower frequencies is caused by sound absorption corresponding to close-to-resonance conditions of large microbubbles in the hundred-kilohertz frequency range.
4. Conclusions
Droplet-to-bubble transition in block copolymer stabilized nanoemulsions may be induced by heating, sonication, or injection through fine-gauge needles. Thermal effects are generally not efficient; heating the nanoemulsion to physiological temperatures upon injection is not expected to cause droplet-to-bubble transition in the nanoscale droplets. Some droplet-to-bubble transition may result from injection through fine-gauge needles due to shear stresses or pressure gradients. Droplet-to-bubble transition in gel matrices may be triggered by low-frequency ultrasound in the presence of pre-existing microbubbles. The pre-existing microbubbles in tumor tissue may be generated by direct intratumoral injections of nanoemulsions through fine-gauge needles. Ultrasound imaging shows that microbubbles formed in tumor tissue survive for at least a month. This may be used for catalyzing efficient tumor-localized drug release from systemically injected drug-loaded phase-shift nanoemulsions.
Acknowledgments
The project described was supported by Grant Number R56EB001033 and R01EB001033 to NR from the National Institute Of Biomedical Imaging And Bioengineering. The content is solely the responsibility of the authors and does not necessarily represent the official views of the National Institute Of Biomedical Imaging And Bioengineering or the National Institutes of Health. The authors are grateful to Dr. M. Skliar for the permission to use the fluorescence microscope and accessories in his lab and to Praveena Mohan for help in taking microphotographs of Figure 2.
References
- 1.Greenleaf WJ, Bolander ME, Sarkar G, Goldring MB, Greenleaf JF. Ultrasound Med Biol. 1998;24:587–595. doi: 10.1016/s0301-5629(98)00003-9. [DOI] [PubMed] [Google Scholar]
- 2.Kost J, Mitragotri S, Gabbay RA, Pishko M, Langer R. Nat Med. 2000;6:347–350. doi: 10.1038/73213. [DOI] [PubMed] [Google Scholar]
- 3.Unger EC, Hersh E, Vannan M, McCreery T. Echocardiography. 2003;18:355–361. doi: 10.1046/j.1540-8175.2001.00355.x. [DOI] [PubMed] [Google Scholar]
- 4.Taniyama Y, Tachibana K, Hiraoka K, Namba T, Yamasaki K, Hashiya N, Aoki M, Ogihara T, Yasufumi K, Morishita R. Circulation. 2002;105:1233–1239. doi: 10.1161/hc1002.105228. [DOI] [PubMed] [Google Scholar]
- 5.Prausnitz MR, Mitragotri S, Langer R. Nat Rev Drug Discov. 2004;3:115–124. doi: 10.1038/nrd1304. [DOI] [PubMed] [Google Scholar]
- 6.Mitrgotri S. Nat Rev Drug Discov. 2005;4:255–260. doi: 10.1038/nrd1662. [DOI] [PubMed] [Google Scholar]
- 7.Rapoport N, Gao Z, Kennedy A. J Natl Cancer Inst. 2007;99:1095–1106. doi: 10.1093/jnci/djm043. [DOI] [PubMed] [Google Scholar]
- 8.Gao Z, Kennedy AM, Christensen DA, Rapoport N. Ultrasonics. 2008;48:260–270. doi: 10.1016/j.ultras.2007.11.002. [DOI] [PMC free article] [PubMed] [Google Scholar]
- 9.Nam KH, Christensen DA, Kennedy AM, Rapoport N. Am Inst Phys Conf Proc. 2009 accepted. [Google Scholar]
- 10.Rapoport N, Christensen DA, Kennedy AM, Nam KH. Ultrasound Med Biol. 2009 doi: 10.1016/j.ultrasmedbio.2009.11.009. submitted. [DOI] [PMC free article] [PubMed] [Google Scholar]
- 11.Rapoport N, Kennedy AM, Shea JE, Scaife CL, Nam KH. J Control Release. 2009 doi: 10.1016/j.jconrel.2009.05.026. submitted. [DOI] [PMC free article] [PubMed] [Google Scholar]
- 12.Caskey CF, Stieger SM, Qin S, Dayton PA, Ferrara KW. J Acoust Soc Am. 2007;122:1191–1200. doi: 10.1121/1.2747204. [DOI] [PubMed] [Google Scholar]
- 13.Kennedy JE, Ter Haar GR, Cranston D. Br J Radiol. 2003;76:590–599. doi: 10.1259/bjr/17150274. [DOI] [PubMed] [Google Scholar]
- 14.Unger EC, Porter T, Culp W, Labell R, Matsunaga T, Zutshi R. Adv Drug Deliv Rev. 2004;56:1291–1314. doi: 10.1016/j.addr.2003.12.006. [DOI] [PubMed] [Google Scholar]
- 15.Wheatley MA, Forsberg F, Oum K, Ro R, El-Sherif D. Ultrasonics. 2006;44:360–367. doi: 10.1016/j.ultras.2006.04.003. [DOI] [PubMed] [Google Scholar]
- 16.Ferrara K, Pollard R, Borden M. Annu Rev Biomed Eng. 2007;9:415–447. doi: 10.1146/annurev.bioeng.8.061505.095852. [DOI] [PubMed] [Google Scholar]
- 17.Ferrara K. Adv Drug Deliv Rev. 2008;60:1097–1102. doi: 10.1016/j.addr.2008.03.002. [DOI] [PMC free article] [PubMed] [Google Scholar]
- 18.Hernot S, Klibanov AL. Adv Drug Deliv Rev. 2008;60:1153–1166. doi: 10.1016/j.addr.2008.03.005. [DOI] [PMC free article] [PubMed] [Google Scholar]
- 19.Hobbs SK, Minsky WL, Yuan F, Roberts WG, Griffith L, Torchilin VP, Jain RK. Proc Natl Acad Sci USA. 1998;95:4607–4612. doi: 10.1073/pnas.95.8.4607. [DOI] [PMC free article] [PubMed] [Google Scholar]
- 20.Campbell R. Anticancer Agents Med Chem. 2006;6:503–512. doi: 10.2174/187152006778699077. [DOI] [PubMed] [Google Scholar]
- 21.Miller DL, Gies RA. Ultasound Med Biol. 1998;24:123–128. doi: 10.1016/s0301-5629(97)00209-3. [DOI] [PubMed] [Google Scholar]
- 22.Skyba DM, Price RJ, Linka AZ, Skalak TC, Kaul S. Circulation. 1998;98:290–293. doi: 10.1161/01.cir.98.4.290. [DOI] [PubMed] [Google Scholar]
- 23.Chappell JC, Klibanov AL, Price RJ. Ultrasound Med Biol. 2005;31:1411–1422. doi: 10.1016/j.ultrasmedbio.2005.06.010. [DOI] [PubMed] [Google Scholar]
- 24.Kinoshita M, McDannold N, Jolesz FA, Hynynen K. Proc Natl Acad Sci USA. 2006;103:11719–11723. doi: 10.1073/pnas.0604318103. [DOI] [PMC free article] [PubMed] [Google Scholar]
- 25.Stieger SM, Caskey CF, Adamson RH, Qin S, Curry FR, Wisner ER, Ferrara KW. Radiology. 2007;243:112–121. doi: 10.1148/radiol.2431060167. [DOI] [PubMed] [Google Scholar]
- 26.Bekeredjian R, Chen S, Frenkel PA, Grayburn PA, Shohet RV. Circulation. 2003;108:1022–1026. doi: 10.1161/01.CIR.0000084535.35435.AE. [DOI] [PubMed] [Google Scholar]
- 27.Datta S, Coussios CC, McAdory LE, Tan J, Porter T, De Courten-Myers G, Holland CK. Ultrasound Med Biol. 2006;32:1257–1267. doi: 10.1016/j.ultrasmedbio.2006.04.008. [DOI] [PMC free article] [PubMed] [Google Scholar]
- 28.Kabalnov AS, Makarov KN, Shcherbakova OV. J Fluor Chem. 1990;50:271–284. [Google Scholar]
- 29.Landau LD, Lifshitz EM. Statistical Physics Part 1. 3rd. chapters VII,VIII. Oxford: Butterworth-Heinemann; 1980. [Google Scholar]
- 30.Barber EJ, Cady GH. J Phys Chem. 1956;60:504–505. [Google Scholar]
- 31.Alexandridis P, Hatton TA. Colloids and Surfaces A: Physicochemocal and Engineering aspects. 1994;95:1–46. [Google Scholar]
- 32.Kripfgans OD, Fowlkes JB, Miller DL, Eldevik OP, Carson PL. Ultrasound Med Biol. 2000;26:1177–1189. doi: 10.1016/s0301-5629(00)00262-3. [DOI] [PubMed] [Google Scholar]
- 33.Kripfgans OD, Fabiilli ML, Carson PL, Fowlkes JB. J Acoust Soc Am. 2004;116:272–281. doi: 10.1121/1.1755236. [DOI] [PubMed] [Google Scholar]
- 34.Lo AH, Kripfgans OD, Carson PL, Rothman ED, Fowlkes JB. IEEE Trans Ultrason Ferroelectr Freq Control. 2007;54:933–946. doi: 10.1109/tuffc.2007.339. [DOI] [PubMed] [Google Scholar]
- 35.Becher H, Burns PN. Handbook for Contrast Echocardiography. Springer Verlag; Frankfurt and New York: 2000. pp. 11–12. [Google Scholar]
- 36.Commander K, Prosperetti A. J Acoust Soc Am. 1989;85:732–746. [Google Scholar]
- 37.Karpov S, Prosperetti A, Ostrovsky L. J Acoust Soc Am. 2003;113:1304–1316. doi: 10.1121/1.1539519. [DOI] [PubMed] [Google Scholar]
- 38.Hoff L, Sontum PC, Hovem JM. J Acoust Soc Am. 2000;107:2272–2280. doi: 10.1121/1.428557. [DOI] [PubMed] [Google Scholar]
- 39.Church CC. J Acoust Soc Am. 1995;97:1510–1521. [Google Scholar]