

Abstract
The remarkable fossil record of whales and dolphins (Cetacea) has made them an exemplar of macroevolution. Although their overall adaptive transition from terrestrial to fully aquatic organisms is well known, this is not true for the radiation of modern whales. Here, we explore the diversification of extant cetaceans by constructing a robust molecular phylogeny that includes 87 of 89 extant species. The phylogeny and divergence times are derived from nuclear and mitochondrial markers, calibrated with fossils. We find that the toothed whales are monophyletic, suggesting that echolocation evolved only once early in that lineage some 36–34 Ma. The rorqual family (Balaenopteridae) is restored with the exclusion of the gray whale, suggesting that gulp feeding evolved 18–16 Ma. Delphinida, comprising all living dolphins and porpoises other than the Ganges/Indus dolphins, originated about 26 Ma; it contains the taxonomically rich delphinids, which began diversifying less than 11 Ma. We tested 2 hypothesized drivers of the extant cetacean radiation by assessing the tempo of lineage accumulation through time. We find no support for a rapid burst of speciation early in the history of extant whales, contrasting with expectations of an adaptive radiation model. However, we do find support for increased diversification rates during periods of pronounced physical restructuring of the oceans. The results imply that paleogeographic and paleoceanographic changes, such as closure of major seaways, have influenced the dynamics of radiation in extant cetaceans.
Keywords: Cetacea, evolution, molecular phylogeny, palaeo-ocean restructuring, speciation
Whales and dolphins form a taxonomically diverse clade, the Cetacea, which encompasses the raptorial echolocating Odontoceti and filter-feeding Mysticeti (Rice 1998; Perrin and Brownell 2001). Because cetaceans differ dramatically from other mammals in terms of morphology and ecology, their relationships and evolution have been enigmatic since before the days of Linnaeus. In the past 25 years, however, developments in molecular phylogeny and discoveries of key fossils have dramatically clarified relationships with other mammals and within the Cetacea. Fossils reveal that Cetacea originated 56–53 Ma from terrestrial artiodactyl ancestors (Thewissen et al. 2007). Early archaeocetes or “ancient whales” (stem Cetacea) diversified through amphibious stages to become fully pelagic by 40–38 Ma (Uhen 2008; Gingerich et al. 2009). This radiation of stem Cetacea has been thoroughly researched and is widely recognized as an exceptional example of a group radiating into an open adaptive zone (Simpson 1953), from terrestrial to riverine and shallow marine settings and finally to open oceans. Extant cetaceans which form the clade Neoceti (crown Cetacea) evolved from archaeocetes about 36 Ma, dispersing across the world's oceans, and into estuaries and even rivers (Fordyce and Muizon 2001). The Neoceti evolved from among the later and most crown-ward basilosaurid archaeocetes (e.g., Luo and Gingerich 1999; Fordyce 2002a; Uhen 2008); no archaeocete-like fossils have been found to belong in the clade Neoceti. Accordingly, the radiation of the extant whales can be assessed independently of the Archaeoceti.
It has proved difficult to elucidate the evolutionary driving forces of the crown cetacean radiation. Compared with terrestrial biomes, drivers of marine speciation are rarely obvious, both because distributions of marine organisms may be uncertain and because oceans are 3-dimensionally more continuous and have fewer obvious geographical barriers than terrestrial environments (e.g., Norris 2000). Additionally, species in many marine groups can disperse quickly and widely, and it is generally assumed that, even for short-lived drifting organisms, ocean currents and gateways allow constant mixing of gene pools, inhibiting evolutionary change. Thus, the requirement of isolation during allopatric speciation appears harder to satisfy in the oceans, creating what is known as the “marine speciation paradox” (Bierne et al. 2003). Accordingly, we have little understanding of the nature and mechanisms of reproductive barriers in marine speciation. Furthermore, strongly divergent views exist on the relative roles of physical–chemical and biological phenomena in structuring modern cetacean ecosystems, as reflected in debates on bottom-up versus top-down ecological–evolutionary drivers (e.g., Ainley et al. 2007; Nicol et al. 2007).
Two hypotheses regarding cetacean evolution relate to the roles of biological and physical drivers. One hypothesis holds that modern cetacean diversity is in part attributable to a rapid adaptive radiation following a transition into an open adaptive zone (sensu Simpson 1953), which occurred early in the history of crown Cetacea as the 2 sister clades, the toothed and baleen whales, acquired their respective echolocation and filter-feeding abilities. Such transitions into unoccupied regions of ecological niche space are frequently associated with rapid phenotypic change—often leading to increased structural disparity—and with species diversification, owing to a relaxation of ecological constraints and exploitation of unsaturated ecological niche space during the early phase of the radiations (Schluter 2000; Rabosky and Lovette 2008a). Such ecological opportunities arise when resources are abundant with few competitor lineages present and they are widely believed to trigger the explosive diversification involved in species-level radiations (Weir 2006; Phillimore and Price 2008). Previous studies indicate that both toothed and baleen whales showed a rapid increase in ecological and morphological disparity in the early Oligocene (Fordyce 2003), as well as rapid speciation early in the evolution of extant taxa (Nikaido et al. 2001), consistent with the adaptive-radiation hypothesis.
A second hypothesis holds that speciation since late Eocene times was determined by the tectonically-driven rearrangement of physical barriers, features of the thermohaline circulation, and water temperature, all of which interact today to define cetacean habitat and food distribution (e.g., Pastene et al. 2007). Cenozoic ocean history is characterized by numerous changes in physical geography, circulation, sea level, and climate, with 2 intervals noteworthy for major events that could have influenced cetacean diversification. First, the tectonic opening of the Drake Passage between South America and Antarctica, and of the Australian–Antarctic Tasman seaway, created the Southern Ocean with a free-flowing Antarctic Circumpolar Current (Scher and Martin 2006; Livermore et al. 2007; Fig. 1). This event was coincident with the late Eocene to early Oligocene climatic change from greenhouse to icehouse world (Coxall and Pearson 2008; Lear et al. 2008). Atmospheric CO2 levels decreased, and Antarctic ice sheets of the Oi-1 glaciation expanded rapidly, associated with changes in calcite compensation depth, Southern Ocean upwelling, and increasing primary productivity (Coxall et al. 2005; Scher and Martin 2006; Livermore et al. 2007; Lear et al. 2008). Second, a cascade of tectonic, paleoceanic, and climatic changes occurred during the late Miocene to early Pliocene. Global warmth was followed by Antarctic ice growth at the middle Miocene climate transition ∼14 Ma (Shevenell et al. 2008), and since the late Miocene there has been a general cooling and/or ice growth trend (positive δ18O shift) and increased productivity (negative δ13C shift) (Zachos et al. 2001). Significant changes occurred with the closure of the eastern Tethys link between the Mediterranean and Indian oceans ∼13–10 Ma (Harzhauser and Piller 2007), restriction of the deep Indo-Pacific seaway ∼12–5 Ma (Kuhnt et al. 2004), and restriction then closure of the Central American seaway ∼14–4.2 Ma (Jain and Collins 2007; Fig. 1). Cooling and geographic changes affected thermohaline circulation (Thomas and Via 2007), including North Atlantic deep water circulation following the closure of the Central American seaway (Lear et al. 2003). Enhanced biogenic phosphatic sedimentation has been linked to upwelling (Diester-Haass et al. 2005) and to a marked negative δ13C shift reflecting enhanced global marine productivity about 7.6–6.3 Ma (Zachos et al. 2001).
FIGURE 1.
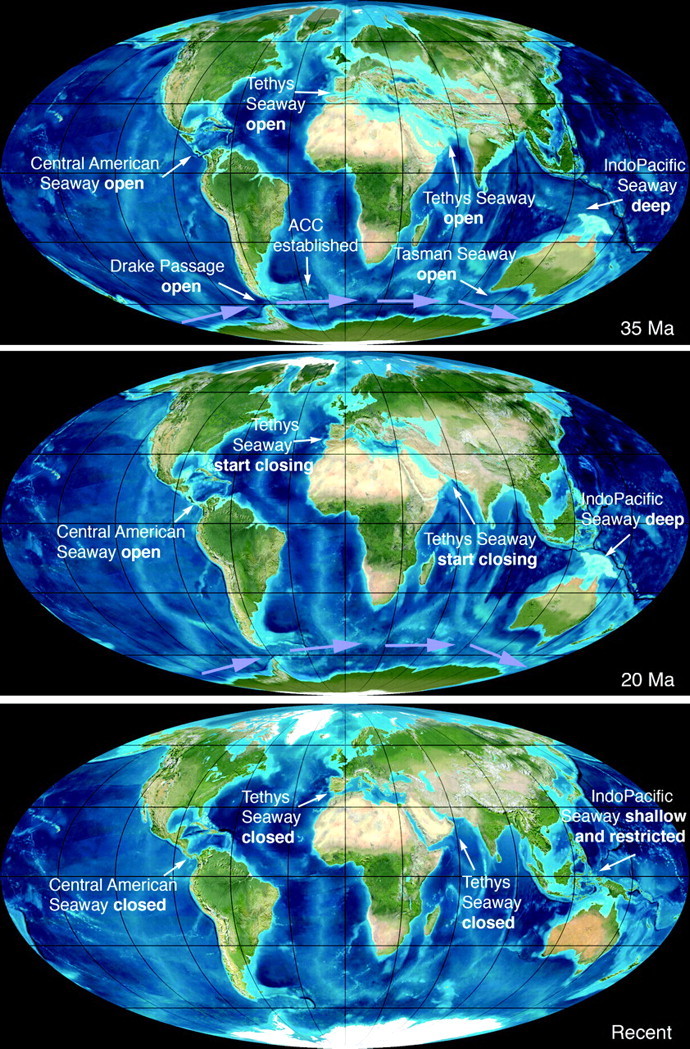
Coastline maps indicating the timing of opening and closure of oceanic gateways. By 30 Ma, the Drake Passage and the Tasmanian Seaway had opened enough for the Antarctic Circumpolar Current to be established. At 12 Ma, the 3 major equatorial oceanic gateways, the Tethys Seaway, the IndoPacific Seaway, and the Central American Seaway, were still open. Between then and the present, these 3 equatorial gateways have been closed or restricted, inhibiting significant equatorial exchange between the Pacific, Atlantic, and Indian oceans. Maps are available from http://jan.ucc.nau.edu/ ∼ rcb7/ with permission.
Here, we elucidate the evolution of extant cetaceans by constructing a molecular phylogenetic tree containing almost all the extant cetacean species. Our multipartitioned data set includes a sequence alignment of 15 mitochondrial and nuclear genes and incorporates multiple fossil calibration points in a relaxed clock framework. By reading the signatures of species diversification processes in the time-calibrated molecular phylogeny, we can test hypotheses concerning the radiation of recent Cetacea. We assess the role of adaptation in driving cladogenesis early in the evolution of extant whales as well as the effects of large-scale ocean-restructuring events on cetacean diversification.
METHODS
Nucleotide sequences of 6 mitochondrial and 9 nuclear genes were obtained from GenBank for 87 of 89 extant cetacean species and 3 outgroup taxa (Hippopotamus amphibious, Sus scrofa, and Bos taurus). Sequences were manually aligned to form a data set of 16,175 characters (6,666 mitochondrial and 9,509 nuclear). GenBank accession numbers are listed in Appendix S1 (available from http://www.sysbio.oxfordjournals.org/). The data supermatrix (matrix combining several types of data, in this case different gene sequences, available from various groups of included taxa) is available at TreeBase, accession number S2467. Taxonomic and vernacular names follow Rice (1998) unless specified (see Table 1).
TABLE 1.
Formal and vernacular names of cetacean taxa with representative species and included families where applicable (follows Rice 1998; Fordyce and Muizon 2001)
| Formal name | Vernacular names | Representative species | Included families |
| Balaenidae | Right whales, balaenids | Balaena mysticetus, bowhead whale | |
| Neobalaenidae | Pygmy right whale | Caperea marginata, pygmy right whale, only | |
| Balaenopteridae | Rorquals, balaenopterids | Balaenoptera acutorostrata, minke whale | |
| Eschrichtiidae | Gray whale | Eschrichtius robustus, gray whale, only | |
| Physeteroidea | Sperm whales | Physeteridae, Kogiidae | |
| Physeteridae | [Giant] sperm whale | Physeter macrocephalus, sperm whale, only | |
| Kogiidae | Pygmy sperm whales | Kogia breviceps, pygmy sperm whale | |
| Platanistidae | Ganges and Indus River dolphins | Platanista gangetica, Ganges river dolphin | |
| Ziphiidae | Beaked whales, ziphiids | Ziphius cavirostris, Cuvier's beaked whale | |
| Delphinida | Lipotidae, Iniidae, Pontoporiidae, Phocoenidae, Monodontidae, Delphinidae | ||
| Inioidea | Lipotidae, Iniidae, Pontoporiidae | ||
| Lipotidae | Baiji, Yangtze dolphin | Lipotes vexillifer, baiji | |
| Iniidae | Boto, Amazon-Orinoco dolphin | Inia geoffrensis, boto | |
| Pontoporiidae | Franciscana, La Plata dolphin | Pontoporia blainvillei | |
| Delphinoidea | Delphinoids | Phocoenidae, Monodontidae, Delphinidae | |
| Phocoenidae | Porpoises, phocoenids | Phocoena phocoena, harbor porpoise | |
| Monodontidae | White whales; narwhal, beluga; monodontids | Monodon monoceros, narwhale | |
| Delphinidae | Dolphins, delphinids | Delphinus delphis, common dolphin |
The sequence alignment was partitioned so that separate substitution models could be applied to different parts of the data set. The 2 mitochondrial ribosomal RNA genes, 12S and 16S, were concatenated to form a single partition. All noncoding sequences (actin intron, alb intron, and sry flanking regions) were combined into a single data partition. The 13 protein-coding genes were partitioned by gene and were further divided into first + second versus third codon sites following Shapiro et al. (2006). Estimation of the phylogeny and divergence times was performed in 2 steps. First, Bayesian phylogenetic inference was conducted using MrBayes 3.1.2 (Ronquist and Huelsenbeck 2003), with each data partition being assigned a separate substitution model, selected using Bayesian information criterion scores determined by Modelgenerator (Keane et al. 2006). Posterior probability distributions of parameters, including the tree topology, were approximated using Markov chain Monte Carlo simulation. One cold and 3 heated Markov chains were run for 90,000,000 steps. Following a discarded burn-in of 30,000,000 steps, samples from the Markov chain were taken every 1000 steps. Parameters were checked for acceptable mixing and convergence to the stationary distribution with the program Tracer 1.4 (Rambaut and Drummond 2007). The posterior sample of trees was analyzed using the diagnostic software AWTY (Nylander et al. 2008), and convergence of topological split frequencies was found to be satisfactory. A maximum clade-credibility tree was obtained from the set of trees sampled from the posterior.
Second, divergence time estimation was carried out using a relaxed molecular clock approach, as implemented in r8s 1.7 (Sanderson 2002). Date estimates were obtained using penalized likelihood with an additive penalty, with 7 paleontological age constraints used for calibration (Table 2; details and justifications are given in Appendix S2). The smoothing parameter was optimized using the cross-validation procedure implemented in r8s.
TABLE 2.
Fossils used for calibration of the molecular clock analysis
| Group name | Minimum constraint | Maximum constraint | Defining taxon | Age (Ma) |
| Cetacea versus outgroup | 53.6 | 56 | Himalayacetus subathuensis | 53.5 |
| Crown group Cetacea | 35.0 | Llanocetus denticrenatus | 34.2 | |
| Crown group Mysticeti | 28.0 | Un-named archaic right whale | 28 | |
| Crown group Balaenopteridae | 7.3 | “Megaptera” miocaena | 8.2–7.3 | |
| Inioidea–Delphinoidea | 23.5 | Kentriodon ? sp. | 23.5 | |
| Crown group Inioidea | 12.0 | Brachydelphis mazeasi | 15–12 | |
| Crown group Delphinoidea | 10.0 | Salumiphocaena stocktoni | 11–10 |
To obtain estimates of the uncertainty in the calculated divergence dates, which cannot be obtained directly in the penalized-likelihood method, we repeated the phylogenetic analysis in MrBayes using the same data settings as described above. This time, the tree topology was fixed to match that of the maximum clade-credibility tree obtained above, but branch lengths were allowed to vary. Following a discarded burn-in of 1,000,000 steps, samples from the Markov chain were drawn every 10,000 steps over a total of 10,000,000 steps. The penalized-likelihood dating analysis was repeated, using the settings described above, for each of the 1000 sampled trees. In this manner, we obtained a set of 1000 divergence date estimates for each node in the cetacean phylogeny, enabling us to calculate the standard deviation of the date estimates. Note that the uncertainty on date estimates does not explicitly incorporate errors in topology or calibration, the contributions of which can be difficult to quantify (Ho and Phillips 2009).
To identify nodes in the tree experiencing changes in diversification rate, shift statistics were computed using the program Symmetree (Chan and Moore 2005). The 3 outgroup taxa were excluded. Shift statistics returning P values less than 0.05 were interpreted as being significant evidence of a change in diversification rate.
To test for early rapid cetacean diversification, as predicted under the adaptive-radiation model (Nee et al. 1992; Rabosky and Lovette 2008a), we computed the γ statistic, which quantifies the extent to which the pattern of lineage accumulation in a reconstructed molecular phylogeny departs from a constant-rate diversification process (Pybus and Harvey 2000). Being a summary statistic, γ is influenced by rate changes occurring anywhere in the tree; accordingly, we repeated our analysis after excluding the most recent 10 Ma of evolutionary history to control for the possibility that recent changes in diversification rates obscured our ability to detect a rapid diversification during the early phase of the radiation. We used a likelihood approach based on the birth–death process to contrast the fit of density-dependent and constant-rate models of diversification (Rabosky and Lovette 2008a).
To test for shifts in diversification rates during the putative episodes of abiotic forcing (35–31 Ma; 13–4 Ma), we implemented an extension of the discrete-shift method used in several previous studies (Barraclough and Vogler 2002; Rabosky 2006b). We computed the likelihoods of the phylogenetic data under models with constant speciation (pure birth) or constant speciation/extinction (birth–death) and compared these with the likelihood under models in which the speciation rate during the restructuring period was treated as a free parameter. Significance was assessed using a likelihood-ratio test. Additional details can be found in Rabosky (2006b). All analyses were conducted using extensions of the LASER package for the R programming/statistical environment (Rabosky 2006a). We did not include extinction in the final model because 1) estimates under a constant rate birth–death model tended toward 0 and 2) it is difficult to obtain meaningful estimates of separate extinction and speciation parameters under discrete-shift models similar to those considered here because confidence intervals on extinction rates are very large.
We also conducted a profile likelihood analysis to investigate the likelihood of diversification-rate shifts through time. We assumed a model whereby a baseline speciation rate λ1 shifts to a new rate λ2 during a temporal window with a fixed width of 6 Ma; a window centered at x = 20 Ma would thus define a model with speciation rate λ1 on the interval 35–23 and 17–0 Ma and rate λ2 on 23–17 Ma). We computed the likelihood of this model across 2500 equally spaced points between 33 and 2 Ma and plotted both the estimated rates and the model likelihood to visualize time intervals with exceptionally high (or low) diversification rates.
RESULTS AND DISCUSSION
Cetacean Phylogeny and Speciation
Our phylogenetic analysis strongly supports the mutual monophyly of the 2 extant (crown) clades, Mysticeti (baleen whales) and Odontoceti (toothed whales and dolphins), with a posterior probability of 1.00 (Fig. 2). This fundamental division among the living Cetacea has been recognized since the mid-nineteenth century. Under a relaxed clock model, the timing of the Mysticeti–Odontoceti divergence is estimated at 36 Ma (Fig. 3). Significantly, these results, from a larger data set than previous studies, are consistent with most previous estimates of the phylogeny and divergence times.
FIGURE 2.
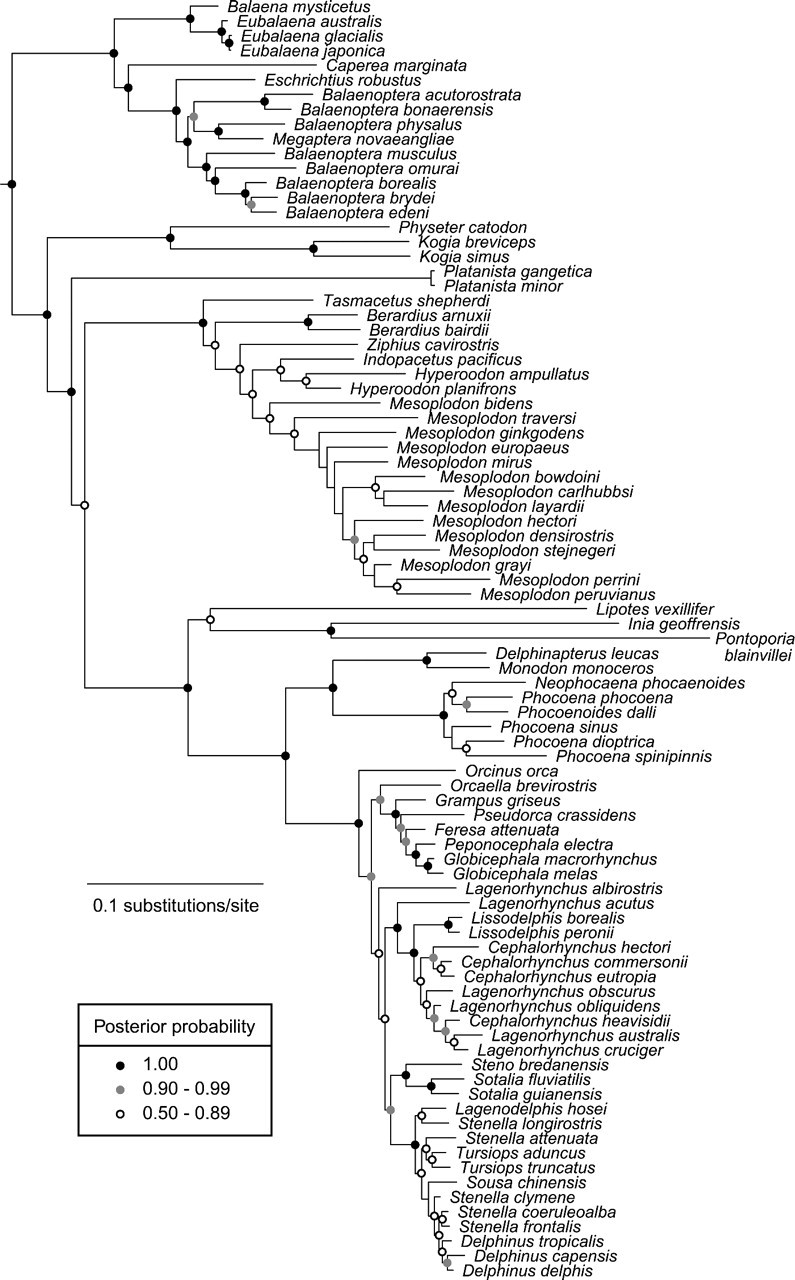
Phylogeny of Cetacea, inferred using a Bayesian approach from a supermatrix of 15 mitochondrial and nuclear genes. A list of taxa and GenBank accession numbers is given in Appendix S1. Nodes are coded to indicate 3 levels of posterior probability as shown in the inset.
FIGURE 3.
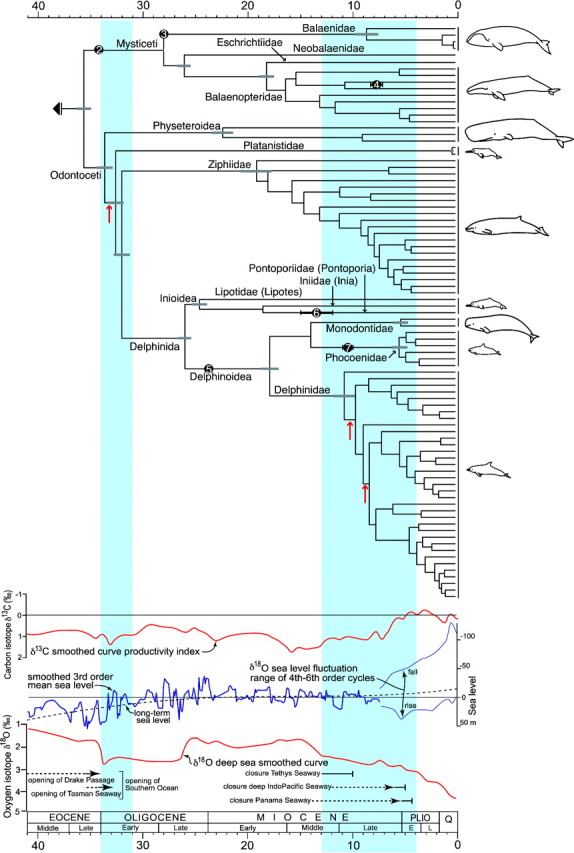
Molecular phylogeny of 87 recent cetacean species correlated with major global environmental changes. Chronogram obtained from a relaxed clock applied to the topology and branch lengths shown in Fig. 2. Estimated standard deviations are indicated on selected nodes with gray error bars. Clades undergoing increases in diversification rates (likelihood ratio-based shift statistics: P < 0.05) are marked with a red arrow. The black dots represent fossil calibration points: 2, Llanocetus denticrenatus; 3, stem balaenid; 4, “Megaptera” miocena (phylogenetic position within crown Balaenopteridae uncertain); 5, Kentriodon ? sp.; 6, Brachydelphis mazeasi; and 7, Salumiphocaena stocktoni (see Appendix S2 for references). Blue areas represent periods of major oceanic restructuring (35–31 and 13-4 Ma) where the phylogeny was tested for changes in the diversification rate. Smoothed curves represent global ocean productivity (Zachos et al. 2001), sea-level fluctuations (Miller et al. 2005), and temperature (Zachos et al. 2001) across time, with times of opening and closure of major oceanic gateways (Kuhnt et al. 2004; Scher and Martin 2006; Harzhauser and Piller 2007; Jain and Collins 2007) given below.
Some molecular studies have radically proposed a paraphyletic origin of odontocetes. For example, Milinkovitch et al. (1993) argued that the sperm whale (Physeteridae) plus the pygmy sperm whales (Kogiidae) are more closely related to mysticetes than to other odontocetes. Verma et al. (2004) suggested that the Ganges/Indus River dolphins Platanista are more closely related to mysticetes than to any other odontocete. These evolutionary scenarios would imply that echolocation in odontocetes evolved twice, or alternatively evolved once in archaeocetes, to become secondarily lost in early mysticetes, as proposed by Milinkovitch (1997). Such changes would suggest either parallel evolution or complete loss of point-by-point similarities in the complex acoustic apparatus. However, echolocation is ubiquitous among living odontocetes and is thus predicted to have been present in the most recent common ancestor of the crown-group species. The presence of echolocation has been inferred for the oldest described fossil odontocete, Simocetus rayi dated at ∼ 32 Ma (Fordyce 2002b). Living mysticetes are not known to echolocate in the manner of odontocetes, and extinct baleen whales lack skull features such as the expanded facial fossa and ascending process of maxilla which, in odontocetes, are linked to echolocation (Cranford 2000). We suggest that echolocation evolved with the origin of the crown Odontoceti about 36–34 Ma and agree with other molecular and morphological studies that have rejected the hypothesis of paraphyly for odontocetes (Heyning 1997; Messenger and McGuire 1998; Gatesy et al. 2002; Geisler and Sanders 2003; Price et al. 2005).
The estimated origin of Neoceti at around 36 Ma concurs with several previous estimates (Nikaido et al. 2001; Sasaki et al. 2005). The date is close to the minimum age constraint set for the split, which is based on the oldest fossil member of Neoceti, the archaic mysticete Llanocetus denticrenatus (Table 2). A 36 Ma origin, however, contrasts dramatically with the early Eocene split around 50 Ma proposed by Cassens et al. (2000) on the basis of a single delphinid calibration. There is no fossil evidence to support such an early origin of the neocete groups, whereas strong support exists for a late Eocene split. An origin of Neoceti around 50 Ma (Cassens et al. 2000) implies a long ghost lineage of stem Neoceti spanning 14 Ma, a time interval that has yielded a well-sampled and phylogenetically well-analyzed sequence of archaeocetes (e.g., Thewissen 1998; Gingerich 2005).
The data also corroborate fossil evidence that among the toothed whales, 4 high-level clades were established about 30 Ma: sperm whales (Physeteroidea); the highly disparate Platanista river dolphins (Platanistidae); the deep-diving, suction-feeding beaked whales (Ziphiidae); and the Delphinida—dolphins of family Delphinidae and relatives (Fig. 3). A position of the Ganges/Indus river dolphins (Platanista) more basal than the beaked whales is controversial (Muizon 1988; Heyning 1997; Arnason et al. 2004; May-Collado and Agnarsson 2006; Agnarsson and May-Collado 2008) but supports a previous phylogenetic analysis based on short interspersed nuclear elements (SINEs) (Nikaido et al. 2001). The recent ziphiid lineage diversified gradually 20–10 Ma, with a more rapid speciation since 9–10 Ma. For the Delphinida, our results show little diversification before 11 Ma but porpoises (Phocoenidae) and especially delphinids (Delphinidae) subsequently speciated dramatically. As a result of a rapid radiation since 11 Ma, the delphinid clade is now the most speciose living group of Cetacea (Rice 1998) (35 of 89 known species: discussed below), and the most ecologically versatile, occupying tropical to polar latitudes, neritic and oceanic waters, estuaries, and sometimes rivers.
The filter-feeding baleen whales also show deep, early (29–26 Ma) divergences for the right whale (Balaenidae), pygmy right whale (Neobalaenidae), and the gray whale and rorqual clade. Our analyses suggest that baleen-assisted filter-feeding evolved sometime between the origin of the Mysticeti about 35 Ma and the divergence of recent lineages by 28 Ma. The topology of our mysticete phylogeny is consistent with recent studies on SINEs and complete mitochondrial data (Sasaki et al. 2005; Nikaido et al. 2006). Contrary to most other molecular studies (Arnason and Gullberg 1994; Rychel et al. 2004; Agnarsson and May-Collado 2008), we find strong evidence (posterior probability of 1.00) that the gray whale, which is a benthic feeder, is phylogenetically distinct from the gulp-feeding rorquals. Our findings thus support morphological studies (Deméré et al., 2005; Bisconti, 2007; Steeman, 2007; Deméré et al., 2008) and indicate that the evolution of gulp feeding and the specialized structures related to this feeding technique was a single event unique to the rorqual lineage (see Appendix S3). Among extant baleen whales, only the rorquals show substantial modern diversity. We estimate that the major rorqual lineages evolved 18–10 Ma, whereas evidence for this radiation is equivocal in the fossil record prior to ca. 10 Ma (Deméré et al. 2005). Further discussion of the phylogeny and fossil range of family-level lineages is provided in Appendix S3.
Testing Hypotheses on Evolutionary Drivers
We investigated 2 general hypotheses for large-scale patterns in the diversification of modern cetaceans: 1) that extant cetacean diversity was driven by rapid changes into an open adaptive zone like the initial radiation in stem Cetacea (the adaptive radiation hypothesis) (Nikaido et al. 2001) and 2) that abiotic drivers, including physical restructuring of the oceans, played a major role in the radiation of extant cetaceans (the abiotic hypothesis) (Fordyce 1980, 2003).
We predicted that if extant cetacean lineages experienced early adaptive radiation, then they should show an early burst of diversification, followed by a subsequent slowdown in rates through time. We tested this hypothesis (Nee et al. 1992; Rabosky and Lovette 2008a) by computing the γ statistic for our time-calibrated phylogeny of extant whales. We found no evidence for a temporal slowdown in the rate of speciation for the complete cetacean phylogeny or for the 2 major cetacean suborders, and our results are virtually identical for the complete tree and for the suborders considered separately (Table 3). This suggests that diversification rates in extant lineages have not decreased through time. Although high background extinction rates could obscure the signal (Rabosky and Lovette 2008b), likelihood analyses using constant diversification models with and without extinction provide no evidence in favor of a model that includes extinction (Table 4). Furthermore, there is no evidence for density dependence of diversification rates through time (Table 4), as predicted under adaptive radiation models (Nee et al. 1992; Rabosky and Lovette 2008a). In combination, these results do not support a scenario in which early crown cetacean diversification was driven by ecological opportunity. It is possible that diversification patterns consistent with the adaptive-radiation model occurred primarily among lineages (noted below) that subsequently went extinct, as for major mammalian clades during the Paleocene (Bininda-Emonds et al. 2007). If this is so, the process has not left a signature in the distribution of speciation times of extant cetacean lineages.
TABLE 3.
Test for declining speciation rates through time using the γ statistic (Pybus and Harvey 2000), a measure of the constancy of clade growth through time
| γ Full tree | P Full tree | γ – 10 Ma | P – 10 Ma | |
| Cetacea | − 0.62 | 0.26 | − 0.27 | 0.39 |
| Odontoceti | − 0.57 | 0.28 | − 0.33 | 0.36 |
| Mysticeti | − 0.64 | 0.26 | 0.57 | 0.71 |
Notes: Significant declines in the rate of speciation through time are inferred when γ < – 1.64.
TABLE 4.
Maximum-likelihood analysis of diversification in cetaceans assuming a lag time for species recognition of 2 Ma (e.g., analysis from Table 3 was repeated, but most recent 2 Ma of phylogeny were excluded)
| Model | Parameters | LogL | AIC | p |
| Pure birth | 1 | 14.38 | − 26.76 | — |
| Birth–death | 2 | 14.62 | − 25.25 | — |
| Restructure | 2 | 16.39 | − 28.78 | 0.05 |
| 35–31 Ma only | 2 | 14.86 | − 25.72 | 0.97 |
| 13–4 Ma only | 2 | 15.78 | − 27.56 | 0.09 |
Notes: The ocean restructuring models provide the best fit to the data. Models and parameters are as described in Table 3.
We then investigated the abiotic hypothesis of cetacean diversification by testing for associations between lineage-diversification rates and geologically established paleoceanic changes. To test whether ocean restructuring was associated with increased diversification rates, we compared the likelihood of the cetacean phylogeny under 2 models: constant-rate diversification and time-varying diversification rate (Rabosky 2006b). Specifically, we predicted that a baseline speciation rate λ1 would shift to a new rate λ2 during putative ocean-restructuring periods of 35–31 and 13–4 Ma. We found a significantly better fit for the time-varying model (“ocean restructuring” in Table 5) over the 2 constant-rate null models (“pure birth” and “birth–death” in Table 5) (likelihood ratio test = 5.878, P = 0.015, df = 1; Table 5). Parameters estimated under this model suggest that there was a rise in the speciation rate during these time periods (“background” versus “elevated” rates in Table 5). Separate analysis of each temporal interval (35–31 Ma; 13-4 Ma) supports these results (Table 5). Compared with the 13- to 4-Ma period, however, evidence for elevated rates during the early restructuring period is weak: although it is possible that there might have been some increase in rates during the formation of the Drake Passage at 35–31 Ma, this left only a slight signature in the lineage-accumulation curve for the crown taxa.
TABLE 5.
Maximum likelihood analysis of diversification rates in the complete cetacean phylogeny
| Model | Parameters | LogL | AIC | pa | Backgroundb | Elevatedc |
| Pure birth | 1 | 22.53 | − 43.05 | — | 0.1 | — |
| Birth–death (constant rate) | 2 | 22.53 | − 41.05 | — | 0.1 | — |
| Density dependent, lineard | 2 | 22.53 | − 41.04 | 0.990 | — | — |
| Density dependent, exponentiale | 2 | 22.59 | − 41.18 | 0.740 | — | — |
| Ocean restructuringf | 2 | 25.47 | − 46.93 | 0.02 | 0.09 | 0.14 |
| 35–31 Ma onlyg | 2 | 23.11 | − 42.23 | 0.28 | 0.1 | 0.21 |
| 13–4 Ma onlyh | 2 | 24.75 | − 45.50 | 0.04 | 0.09 | 0.13 |
Notes: Pure birth and birth–death models assume constant diversification through time; all other models assume time-varying diversification rates. There is no evidence for density-dependent decline in diversification through time, and the ocean restructuring model has the best overall fit.
P value from likelihood ratio test that the hypothesis model fits the data better than the best-fit constant rate model (pure birth or birth–death).
Estimated background net diversification rate, in lineages/million years.
Estimated net diversification on the hypothesized “high rate” intervals.
Assumes density-dependent exponential decline in speciation rate through time, such that the Speciation rate l is modeled as λ(t) = λ0N–xt, where l0 is the initial speciation rate, Nt is the number of lineages alive at time t, and x is a rate decrease parameter. Details are given in Rabosky and Lovette (2008).
Assumes density-dependent linear decline in the speciation rate through time, such that the speciation rate is modeled as λ(t) = λ0(1 – Nt/K), where K is a parameter analogous to the carrying capacity in a logistic population growth model.
The ocean restructuring model assumes 2 net diversification rates: one on the proposed ocean restructuring intervals of 35–31 and 13–4 Ma and a second rate at all other times.
One net diversification rate on 35–31 Ma and another at all other times.
One net diversification rate on 13–4 Ma and another at all other times.
A profile analysis of the likelihood of any elevated rate periods during the Cenozoic supports an approximate doubling of the speciation rate between about 9–3 Ma (Fig. 4; see Methods). It is possible that the apparent recent increase in diversification of cetaceans is an artifact of high background extinction rates (Rabosky 2006b), but several lines of evidence argue against this: 1) The comparison of likelihoods, estimated speciation rate, and lineages-through-time plot all show that the high-rate period ends approximately 4–3 Ma rather than showing a continuous increase through to the present as would be expected if the pattern were an artifact of extinction and 2) likelihood analysis of the lineage-accumulation curve (Fig. 5) provides no evidence in favor of a model with extinction (e.g., birth–death) over a model without extinction (e.g., pure birth) (Table 5). It is, however, possible that there is a “lag time” for the recognition of incipient species, which might contribute to an artifactual drop in diversification during the most recent 3 Ma. We find no evidence to suggest that such a lag effect could persist for several million years; many species pairs show divergence times since 1.5 Ma (Fig. 3) and the fossil record suggests cetacean species durations of 1–2 Ma (Fordyce and Muizon 2001). Nonetheless, we conducted a simple analysis to control for this possibility by repeating our analyses after eliminating the most recent 2 Ma from the whale phylogeny, which effectively assumes that there is a lag of up to 2 Ma before incipient species can be recognized as such. Even with this assumption, the ocean-restructuring model fits the data better than the constant-rate diversification models (Table 5).
FIGURE 4.
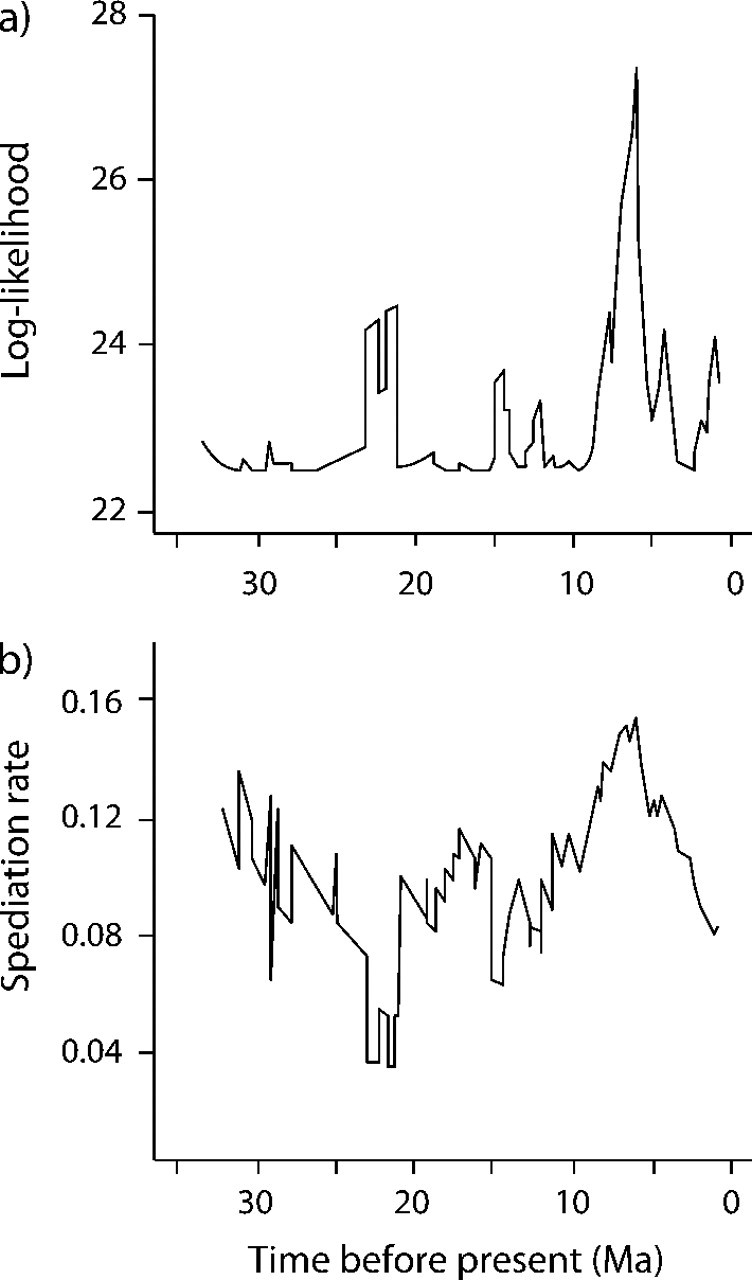
Profile analysis of diversification rates in the Cetacea across the Cenozoic. a) Log likelihood of temporal change in diversification rates during the radiation of extant cetaceans. Results are based on a sliding window analysis with a fixed width of 6 Ma and suggest a shift in baseline diversification rates from 9–3 Ma. b) Speciation-through-time curve for extant Cetacea inferred using 6-Ma window. Results suggest elevated rates of speciation during the late Miocene–early Pliocene (9–4 Ma).
FIGURE 5.

Log lineages-through-time plot for the cetacean radiation and generic diversity of genera through time. Palaeontological data are extracted from the Paleobiology Database (Uhen and Pyenson 2005).
The fossil record of crown Cetacea also shows a marked increase in the number of extinct genera at 12.5 Ma (Fig. 5). This suggests that a rapid diversification in extinct lineages occurred in the period of paleoceanic restructuring as well. There are, however, several biases connected to the fossil data set (Uhen and Pyenson 2007). Noticeably, the most recent records are probably overrepresented because of better preservation opportunity, sediment availability, and increased taxonomic recognition (Uhen and Pyenson 2007). Also, the drop in numbers of genera at 32.5 Ma is likely due to a scarcity of early Oligocene marine sediments (Fordyce 1980; Uhen and Pyenson 2007).
Cetacean Radiation Pattern and the Abiotic Hypothesis
From the age of the earliest crown cetacean fossil (the mysticete Llanocetus, 34.2 Ma), we know that the baleen and toothed whales diverged during the later Eocene cooling shortly before the Eocene/Oligocene boundary (Fig. 3). Our analysis thus seems to support the previously suggested hypothesis (Fordyce 1980) that the opening of the Drake Passage and the initiation of the Antarctic Circumpolar Current spurred the early radiation of toothed whales, 34–31 Ma. No concurrent molecular deep divergences are apparent among the extant baleen whale lineages, but their fossil record (Fordyce 1980; Deméré et al. 2008) is consistent with the hypothesis that baleen-assisted filter feeding evolved concurrent with the development of the Antarctic Circumpolar Current and, plausibly, silicate upwelling (Berger 2007).
There are few branching events on the molecular tree in the late Oligocene to middle Miocene (Fig. 3). The early middle Miocene was warm (Zachos et al. 2001), and the oceans were linked globally by major low-latitude ocean gateways (Tethys, Indonesian, and Central American seaways) (Fig. 1). Archaic clades of cetaceans that are now extinct and beyond the reach of molecular analysis were diverse and ecologically significant in Oligocene and earlier Miocene times (Fordyce and Muizon 2001). Extinct baleen whale families include toothed clades (Aetiocetidae and Mammalodontidae) and the edentulous, baleen-bearing whales Eomysticetidae, Cetotheriidae sensu stricto, and various stem rorquals. During the Oligocene, several now extinct families of small odontocetes evolved: the long-beaked Eurhinodelphinidae, archaic Platanista relatives (Squalodontidae, Squalodelphinidae, Waipatiidae, and Dalpiazinidae), the stem delphinoid group Kentriodontidae, and Simocetidae (Fordyce 2003). Some of these clades were short ranged, some were Oligocene only, whereas most of the others went extinct in the late middle Miocene to early late Miocene, ∼ 10–8 Ma (Fordyce and Muizon 2001). This decline coincides with a significant increase (likelihood ratio-based shift statistics: P < 0.05) in the diversification rate of Delphinidae (Fig. 3).
The phylogeny reveals an increased speciation rate for delphinids in the second time period (13–4 Ma) during which porpoises and beaked whales also diversify. These radiations occurred as connecting seaways were closed (Tethys, Central American) or restricted (loss of Paratethys, restriction of Indo-Pacific; for significance, see Williams et al. 2002; Kanda et al. 2007), as productivity increased (including the 7.6–6.3 Ma productivity spike) and ocean circulation intensified (Fig. 3). The fossil record also shows an increase in described genera in the late middle to early late Miocene (13.6–7.2 Ma) (Uhen and Pyenson 2007). We attribute the speciation of delphinids to a mix of tectonically-driven vicariant events (above) and to adaptation to geographically-concentrated food sources which perhaps resulted from later Miocene changes in broad patterns of circulation and from intensification of oceanic circulation especially in the Plio-Pleistocene (e.g., Lawrence et al. 2006). Simultaneously, global sea level increased in range, further affecting the water- and gene flow between oceans. Of note are increasingly large sea-level changes since 9 Ma (Miller et al. 2005). The Pliocene was warm initially, but from the middle Pliocene ∼ 3 Ma (Zachos et al. 2001; Miller et al. 2005), major cooling and enhanced thermohaline ocean circulation led to the establishment of continental northern-hemisphere glaciation. The latter, amplified by orbital cycles, drove the Pleistocene ice age climate including rapid short-term fourth- to sixth-order global sea-level fluctuations of 60–120 m (Fig. 3), which were most intense from the mid-Pleistocene (∼ 1–0.8 Ma) to the present (Miller et al. 2005). These cyclic sea-level changes would have increased the opportunities for allopatric speciation through phases of basin isolation caused by sea-level fall. In addition, geologically recent fluctuations in tropical water temperatures, long debated (Cipriano 1997) but only recently established (Lawrence et al. 2006), could explain the evolution of north-south antitropical population pairs and species pairs (Kanda et al. 2007) through allopatric or peripatric speciation.
Compared with delphinids, other extant cetacean groups experienced modestly or minimally accelerated radiation in the second period of ocean restructuring tested in the abiotic hypothesis. Baleen whales show only modest increase in diversity. Most species feed in pelagic high-latitude oceans where the changes following the closure of shallow equatorial gateways were probably not dramatic, particularly in the southern hemisphere. An increase in speciation rate occurred in the beaked whales since 10 Ma. The oceanic feeding grounds of the deep diving, mainly squid-eating beaked whales and sperm whales, may have been less affected compared with ocean delphinid habitats and food resources. For the Mesoplodon beaked whales, the stepped phylogeny perhaps reflects successive invasions of increasingly deeper and trophically distinct water masses within the developing global thermohaline circulation. Furthermore, the beaked whale genera Berardius and Hyperoodon each contain 2 antitropical (north-south) sister species which arose allopatrically, separated by tropical waters. Although the timing of the invasions into the riverine habitat by various river dolphin lineages is uncertain (Hamilton et al. 2001), this realm was probably not affected by oceanic restructuring either. Interestingly, extant porpoises, which occupy habitats likely to have been affected by oceanic restructuring (Boran et al. 2002), also show a recent relatively rapid diversification. The diversification pattern of cetaceans is thus consistent with the hypothesis that abiotic factors were important in their evolution.
SUPPLEMENTARY MATERIAL
Supplementary material can be found at http://www.sysbio.oxfordjournals.org/.
FUNDING
Funding was provided by the Danish Natural Science Research Council, Technology and Innovation, The Carlsberg Foundation, and the Australian Research Council.
Supplementary Material
Acknowledgments
We thank G. Bernardi at the University of California, S. L. Pereira at the Royal Ontario Museum, University of Toronto, U. Arnason at the University of Lund, K. R. Miller at Brown University, and J. Browning at Boise State University for providing data. We thank Daniel Thomas, Charles Marshal, Mark Uhen, and Fedor A. Steeman for assistance regarding the data from the Paleobiology Database and Ronald C. Blakey at Northern Arizona University for permission to use his paleogeographical maps. We thank 2 anonymous reviewers for valuable comments on an earlier version of this manuscript, as well as Jack Sullivan, Susanne Renner, and an anonymous reviewer for constructive comments.
References
- Agnarsson I, May-Collado LJ. The phylogeny of Cetartiodactyla: the importance of dense taxon sampling, missing data, and the remarkable promise of cytochrome b to provide reliable species-level phylogenies. Mol. Phylogenet. Evol. 2008;48:964–985. doi: 10.1016/j.ympev.2008.05.046. [DOI] [PubMed] [Google Scholar]
- Ainley D, Ballard G, Ackley S, Blight LK, Eastman JT, Emslie SD, Lescroel A, Olmastron S, Townsend SE, Tynan CT, Wilson P, Woehler E. Paradigm lost, or is top-down forcing no longer significant in the Antarctic marine ecosystem? Antarct. Sci. 2007;19:283–290. [Google Scholar]
- Arnason U, Gullberg A. Relationship of baleen whales established by cytochrome b gene sequence comparison. Nature. 1994;367:726–728. doi: 10.1038/367726a0. [DOI] [PubMed] [Google Scholar]
- Arnason U, Gullberg A, Janke A. Mitogenomic analyses provide new insights into cetacean origin and evolution. Gene. 2004;333:27–34. doi: 10.1016/j.gene.2004.02.010. [DOI] [PubMed] [Google Scholar]
- Barraclough TG, Vogler AP. Recent diversification rates in North American tiger beetles estimated from a dated mtDNA phylogenetic tree. Mol. Biol. Evol. 2002;19:1706–1716. doi: 10.1093/oxfordjournals.molbev.a003993. [DOI] [PubMed] [Google Scholar]
- Berger WH. Cenozoic cooling, Antarctic nutrient pump, and the evolution of whales. Deep Sea Res. II. 2007;54:2399–2421. [Google Scholar]
- Bierne N, Bonhomme F, David P. Habitat preference and the marine-speciation paradox. Proc. R. Soc. Lond. Ser. B Biol. Sci. 2003;270:1399–1406. doi: 10.1098/rspb.2003.2404. [DOI] [PMC free article] [PubMed] [Google Scholar]
- Bininda-Emonds OR, Cardillo M, Jones KE, MacPhee RD, Beck RM, Grenyer R, Price SA, Vos RA, Gittleman JL, Purvis A. The delayed rise of present-day mammals. Nature. 2007;446:507–512. doi: 10.1038/nature05634. [DOI] [PubMed] [Google Scholar]
- Bisconti M. A new basal balaenopterid whale from the Pliocene of northern Italy. Palaeontology. 2007;50:1103–1122. [Google Scholar]
- Boran JR, Evans PGH, Rosen MJ. Behavioural ecology of cetaceans. In: Evans PGH, Raga JA, editors. Marine mammals: biology and conservation. New York: Kluwer Academic/Plenum Publishers; 2002. pp. 197–242. [Google Scholar]
- Cassens I, Vicario S, Waddell VG, Balchowsky H, Van Belle D, Ding W, Fan C, Mohan RS, Simões-Lopes PC, Bastida R, Meyer A, Stanhope MJ, Milinkovitch MC. Independent adaptation to riverine habitats allowed survival of ancient cetacean lineages. Proc. Natl. Acad. Sci. USA. 2000;97:11343–11347. doi: 10.1073/pnas.97.21.11343. [DOI] [PMC free article] [PubMed] [Google Scholar]
- Chan KM, Moore BR. SYMMETREE: whole-tree analysis of differential diversification rates. Bioinformatics. 2005;21:1709–1710. doi: 10.1093/bioinformatics/bti175. [DOI] [PubMed] [Google Scholar]
- Cipriano F. Antitropical distributions and speciation in dolphins of the genus Lagenorhynchus: a preliminary analysis. Soc. Mar. Mamm. (Spec. Publ.) 1997;3:305–316. [Google Scholar]
- Coxall HK, Pearson PN. The Eocene-Oligocene transition. In: Williams M, Haywood AM, Gregory FJ, Schmidt DN, editors. Deep time perspectives on climate change: marrying the signal from computer models and biological processes. London (UK): Geological Society London; 2008. pp. 351–387. [Google Scholar]
- Coxall HK, Wilson PA, Palike H, Lear CH, Backman J. Rapid stepwise onset of Antarctic glaciation and deeper calcite compensation in the Pacific Ocean. Nature. 2005;433:53–57. doi: 10.1038/nature03135. [DOI] [PubMed] [Google Scholar]
- Cranford TW. In search for impulse sound sources in odontocetes. In: Au WWL, Popper AN, Fay RR, editors. Hearing by whales and dolphins. New York: Springer; 2000. pp. 109–155. [Google Scholar]
- Deméré TA, Berta A, McGowen M. The taxonomic and evolutionary history of fossil and modern balaenopteroid mysticetes. J. Mammal. Evol. 2005;12:99–143. [Google Scholar]
- Deméré TA, McGowen MR, Berta A, Gatesy J. Morphological and molecular evidence for a stepwise evolutionary transition from teeth to baleen in mysticete whales. Syst. Biol. 2008;57:15–37. doi: 10.1080/10635150701884632. [DOI] [PubMed] [Google Scholar]
- Diester-Haass L, Billups K, Emeis KC. In search of the late Miocene-early Pliocene “biogenic bloom” in the Atlantic Ocean (Ocean Drilling Program Sites 982, 925, and 1088) Paleoceanography. 2005;20:1–13. [Google Scholar]
- Fordyce RE. Whale evolution and Oligocene southern ocean environments. Palaeogeogr. Palaeoclimatol. Palaeoecol. 1980;31:319–336. [Google Scholar]
- Fordyce RE. Neoceti. In: Perrin WF, Würsig B, Thewissen JG, editors. Encyclopedia of marine mammals. San Diego (CA): Academic Press; 2002. pp. 787–791. [Google Scholar]
- Fordyce RE. Simocetus rayi (Odontoceti: Simocetidae) (new species, new genus, new family), a bizarre new archaic Oligocene dolphin from the eastern North Pacific. Smithson. Contrib. Paleobiol. 2002;93:185–222. [Google Scholar]
- Fordyce RE. Cetacea evolution and Eocene-Oligocene oceans revisited. In: Prothero DR, Ivany LC, Nesbitt E, editors. From greenhouse to icehouse. The marine Eocene-Oligocene transition. New York: Columbia University Press; 2003. pp. 154–170. [Google Scholar]
- Fordyce RE, de Muizon C. Evolutionary history of cetaceans: a review. In: Mazin J-M, de Buffrénil V, editors. Secondary adaptations of tetrapods to life in water. München (Germany) Friedrich Pfeil: Verlag Dr; 2001. [Google Scholar]
- Gatesy J, Matthee C, DeSalle R, Hayashi C. Resolution of a supertree/supermatrix paradox. Syst. Biol. 2002;51:652–664. doi: 10.1080/10635150290102311. [DOI] [PubMed] [Google Scholar]
- Geisler JH, Sanders AE. Morphological evidence for the phylogeny of Cetacea. J. Mammal. Evol. 2003;10:23–129. [Google Scholar]
- Gingerich PD. Placental mammals: origin, timing. In: Rose KD, Archibald JD, editors. relationships of the major extant clades. Baltimore (MD): Johns Hopkins University Press; 2005. pp. 234–252. Cetacea. [Google Scholar]
- Gingerich PD, ul-Haq M, von Koenigswald W, Sanders WJ, Smith BH, Zalmout IS. New protocetid whale from the middle eocene of Pakistan: birth on land, precocial development, and sexual dimorphism. PloS One. 2009 doi: 10.1371/journal.pone.0004366. 4:e4366. [DOI] [PMC free article] [PubMed] [Google Scholar]
- Hamilton H, Caballero S, Collins AG, Brownell RL. Evolution of river dolphins. Proc. R. Soc. Lond. Ser. B Biol. Sci. 2001;268:549–556. doi: 10.1098/rspb.2000.1385. [DOI] [PMC free article] [PubMed] [Google Scholar]
- Harzhauser M, Piller WE. Benchmark data of a changing sea—palaeogeography, palaeobiogeography and events in the Central Paratethys during the Miocene. Palaeogeogr. Palaeoclimatol. Palaeoecol. 2007;253:8–31. [Google Scholar]
- Heyning JE. Sperm whale phylogeny revisited: analysis of the morphological evidence. Mar. Mamm. Sci. 1997;13:596–613. [Google Scholar]
- Ho SYW, Phillips MJ. Accounting for calibration uncertainty in phylogenetic estimation of evolutionary divergence times. Syst. Biol. 2009;58:367–380. doi: 10.1093/sysbio/syp035. [DOI] [PubMed] [Google Scholar]
- Jain S, Collins LS. Trends in Caribbean paleoproductivity related to the Neogene closure of the Central American Seaway. Mar. Micropaleontol. 2007;63:57–74. [Google Scholar]
- Kanda N, Goto M, Kato H, Mcphee MV, Pastene LA. Population genetic structure of Bryde's whales (Balaenoptera brydei) at the inter-oceanic and trans-equatorial levels. Conserv. Genet. 2007;8:853–864. [Google Scholar]
- Keane TM, Creevey CJ, Pentony MM, Naughton TJ, McLnerney JO. Assessment of methods for amino acid matrix selection and their use on empirical data shows that ad hoc assumptions for choice of matrix are not justified. BMC Evol. Biol. 2006;6:29. doi: 10.1186/1471-2148-6-29. [DOI] [PMC free article] [PubMed] [Google Scholar]
- Kuhnt W, Holbourn A, Hall R, Zuvela M, Käse R. Neogene history of the Indonesian throughflow. In: Cliff PD, editor. Continent-ocean interactions within East Asian marginal seas. Washington (DC): American Geophysical Union; 2004. pp. 1–22. [Google Scholar]
- Lawrence KT, Liu ZH, Herbert TD. Evolution of the eastern tropical Pacific through Plio-Pleistocene glaciation. Science. 2006;312:79–83. doi: 10.1126/science.1120395. [DOI] [PubMed] [Google Scholar]
- Lear CH, Bailey TR, Pearson PN, Coxall HK, Rosenthal Y. Cooling and ice growth across the Eocene-Oligocene transition. Geology. 2008;36:251–254. [Google Scholar]
- Lear CH, Rosenthal Y, Wright JD. The closing of a seaway: ocean water masses and global climate change. Earth Planet. Sci. Lett. 2003;210:425–436. [Google Scholar]
- Livermore R, Hillenbrand CD, Meredith M, Eagles G. Drake Passage and Cenozoic climate: an open and shut case? Geochem. Geophys. Geosyst. 2007;8:1–11. [Google Scholar]
- Luo Z, Gingerich PD. Terrestrial Mesonychia to aquatic Cetacea: transformation of the basicranium and evolution of hearing in whales. University of Michigan Papers on Paleontol. 1999;31:1–98. [Google Scholar]
- May-Collado L, Agnarsson I. Cytochrome b and Bayesian inference of whale phylogeny. Mol. Phylogenet. Evol. 2006;38:344–354. doi: 10.1016/j.ympev.2005.09.019. [DOI] [PubMed] [Google Scholar]
- Messenger SL, McGuire JA. Morphology, molecules, and the phylogenetics of cetaceans. Syst. Biol. 1998;47:90–124. doi: 10.1080/106351598261058. [DOI] [PubMed] [Google Scholar]
- Milinkovitch MC. The phylogeny of whales: a molecular approach. Soc. Mar. Mamm. (Spec. Publ.) 1997;3:317–338. [Google Scholar]
- Milinkovitch MC, Ortí G, Meyer A. Revised phylogeny of whales suggested by mitochondrial ribosomal DNA sequences. Nature. 1993;361:346–348. doi: 10.1038/361346a0. [DOI] [PubMed] [Google Scholar]
- Miller KG, Kominz MA, Browning JV, Wright JD, Mountain GS, Katz ME, Sugarman PJ, Cramer BS, Christie-Blick N, Pekar SF. The Phanerozoic record of global sea-level change. Science. 2005;310:1293–1298. doi: 10.1126/science.1116412. [DOI] [PubMed] [Google Scholar]
- Muizon C, de Les relations phylogenetiques des Delphinida (Cetacea: Mammalia) Ann. Paleont. 1988;74:159–227. [Google Scholar]
- Nee S, Mooers AO, Harvey PH. Tempo and mode of evolution revealed from molecular phylogenies. Proc. Natl. Acad. Sci. USA. 1992;89:8322–8326. doi: 10.1073/pnas.89.17.8322. [DOI] [PMC free article] [PubMed] [Google Scholar]
- Nicol S, Croxall J, Trathan P, Gales N, Murphy E. Paradigm misplaced? Antarctic marine ecosystems are affected by climate change as well as biological processes and harvesting. Antarct. Sci. 2007;19:291–295. [Google Scholar]
- Nikaido M, Hamilton H, Makino H, Sasaki T, Takahashi K, Goto M, Kanda N, Pastene LA, Okada N. Proceedings of the SMBE Tri-National Young Investigators’ Workshop 2005. Baleen whale phylogeny and a past extensive radiation event revealed by SINE insertion analysis. Mol. Biol. Evol. 2006;23:866–873. doi: 10.1093/molbev/msj071. [DOI] [PubMed] [Google Scholar]
- Nikaido M, Matsuno F, Hamilton H, Brownell RL, Cao Y, Ding W, Zuoyan Z, Shedlock AM, Fordyce RE, Hasegawa M, Okada N. Retroposon analysis of major cetacean lineages: the monophyly of toothed whales and the paraphyly of river dolphins. Proc. Natl. Acad. Sci. USA. 2001;98:7384–7389. doi: 10.1073/pnas.121139198. [DOI] [PMC free article] [PubMed] [Google Scholar]
- Norris RD. Pelagic species diversity, biogeography, and evolution. Paleobiology. 2000;26:236–258. [Google Scholar]
- Nylander JAA, Wilgenbush JC, Warren DL, Swofford DL. AWTY (Are We There Yet?): A system for graphical exploration of MCMC convergence in Bayesian phylogenetics. Bioinformatics. 2008;24:581–583. doi: 10.1093/bioinformatics/btm388. [DOI] [PubMed] [Google Scholar]
- Pastene LA, Goto M, Kanda N, Zerbini AN, Kerem DAN, Watanabe KB, Y, Hasegawa M, Nielsen R, Larsen F, Palsboll PJ. Radiation and speciation of pelagic organisms during periods of global warming: the case of the common minke whale, Balaenoptera acutorostrata. Mol. Ecol. 2007;16:1481–1495. doi: 10.1111/j.1365-294X.2007.03244.x. [DOI] [PubMed] [Google Scholar]
- Perrin WF, Brownell RL. Update of the list of recognised species of cetaceans. J. Cetacean Res. Manag. 2001;3:364–367. [Google Scholar]
- Phillimore AB, Price TD. Density-dependent cladogenesis in birds. PLoS Biol. 2008;6:483–489. doi: 10.1371/journal.pbio.0060071. [DOI] [PMC free article] [PubMed] [Google Scholar]
- Price SA, Bininda-Emonds OR, Gittleman JL. A complete phylogeny of the whales, dolphins and even-toed hoofed mammals (Cetartiodactyla) Biol. Rev. 2005;80:445–473. doi: 10.1017/s1464793105006743. [DOI] [PubMed] [Google Scholar]
- Pybus OG, Harvey PH. Testing macro-evolutionary models using incomplete molecular phylogenies. Proc. R. Soc. Lond. Ser. B Biol. Sci. 2000;267:2267–2272. doi: 10.1098/rspb.2000.1278. [DOI] [PMC free article] [PubMed] [Google Scholar]
- Rabosky DL. LASER: a maximum likelihood toolkit for detecting temporal shifts in diversification rates from molecular phylogenies [Online] Evol. Bioinform. 2006;2:257–260. [PMC free article] [PubMed] [Google Scholar]
- Rabosky DL. Likelihood methods for detecting temporal shifts in diversification rates. Evol. Int. J. Org. Evol. 2006;60:1152–1164. [PubMed] [Google Scholar]
- Rabosky DL, Lovette IJ. Density-dependent diversification in North American wood warblers. Proc. R. Soc. Lond. Ser. B Biol. Sci. 2008;275:2363–2371. doi: 10.1098/rspb.2008.0630. [DOI] [PMC free article] [PubMed] [Google Scholar]
- Rabosky DL, Lovette IJ. Explosive evolutionary radiations: decreasing speciation or increasing extinction through time? Evol. Int. J. Org. Evol. 2008;62:1866–1875. doi: 10.1111/j.1558-5646.2008.00409.x. [DOI] [PubMed] [Google Scholar]
- Rambaut A, Drummond AJ. 2007. Tracer v1.4. Available from: http://beast.bio.ed.ac.uk/Tracer. [Google Scholar]
- Rice DW. Marine mammals of the world: systematics and distribution. Lawrence (KS): The Society for Marine Mammalogy; 1998. [Google Scholar]
- Ronquist F, Huelsenbeck JP. MrBayes 3: Bayesian phylogenetic inference under mixed models. Bioinformatics. 2003;19:1572–1574. doi: 10.1093/bioinformatics/btg180. [DOI] [PubMed] [Google Scholar]
- Rychel AL, Reeder TW, Berta A. Phylogeny of mysticete whales based on mitochondrial and nuclear data. Mol. Phylogenet. Evol. 2004;32:892–901. doi: 10.1016/j.ympev.2004.02.020. [DOI] [PubMed] [Google Scholar]
- Sanderson MJ. Estimating absolute rates of molecular evolution and divergence times: a penalized likelihood approach. Mol. Biol. Evol. 2002;19:101–109. doi: 10.1093/oxfordjournals.molbev.a003974. [DOI] [PubMed] [Google Scholar]
- Sasaki T, Nikaido M, Hamilton H, Goto M, Kato H, Kanda N, Pastene LA, Cao Y, Fordyce RE, Hasegawa M, Okada N. Mitochondrial phylogenetics and evolution of mysticete whales. Syst. Biol. 2005;54:77–90. doi: 10.1080/10635150590905939. [DOI] [PubMed] [Google Scholar]
- Scher HD, Martin EE. Timing and climatic consequences of the opening of Drake Passage. Science. 2006;312:428–430. doi: 10.1126/science.1120044. [DOI] [PubMed] [Google Scholar]
- Schluter D. The ecology of adaptive radiation. New York: Oxford University Press; 2000. [Google Scholar]
- Shapiro B, Rambaut A, Drummond AJ. Choosing appropriate substitution models for the phylogenetic analysis of protein-coding sequences. Mol. Biol. Evol. 2006;23:7–9. doi: 10.1093/molbev/msj021. [DOI] [PubMed] [Google Scholar]
- Shevenell AE, Kennett JP, Lea DW. Middle Miocene ice sheet dynamics, deep-sea temperatures, and carbon cycling: a Southern Ocean perspective. Geochem. Geophys. Geosyst. 2008 9:Article Q02006. [Google Scholar]
- Simpson GG. The major features of evolution. New York: Columbia University Press; 1953. [Google Scholar]
- Steeman ME. Cladistic analysis and a revised classification of fossil and recent mysticetes. Zool. J. Linn. Soc. Lond. 2007;150:875–894. [Google Scholar]
- Thewissen JG, editor. The emergence of whales: evolutionary patterns in the origin of Cetacea. New York: Plenum; 1998. [Google Scholar]
- Thewissen JG, Cooper LN, Clementz MT, Bajpai S, Tiwari BN. Whales originated from aquatic artiodactyls in the Eocene epoch of India. Nature. 2007;450:1190–1194. doi: 10.1038/nature06343. [DOI] [PubMed] [Google Scholar]
- Thomas DJ, Via RK. Neogene evolution of Atlantic thermohaline circulation: perspective from Walvis Ridge, southeastern Atlantic Ocean. Paleoceanography. 2007 22:Article PA2212. [Google Scholar]
- Uhen MD. New protocetid whales from Alabama and Mississippi, and a new cetacean clade, Pelagiceti. J. Vertebr. Paleontol. 2008;28:589–593. [Google Scholar]
- Uhen MD, Pyenson ND. 2005. Online Systematic Archive, Cetacea, The Paleobiology Database. Available from: http://paleodb.org/cgi-bin/bridge.pl?user=Guest&action=displayPage&page=OSA_9_Cetacea. [Google Scholar]
- Uhen MD, Pyenson ND. Diversity estimates, biases, and historiographic effects: resolving cetacean diversity in the Tertiary. Palaeontol. Electronica. 2007;10(11A):22. [Google Scholar]
- Verma SK, Sinha RK, Singh L. Phylogenetic position of Platanista gangetica: insights from the mitochondrial cytocrome b and nuclear interphotoreceptor retinoid-binding protein gene sequence. Mol. Phylogenet. Evol. 2004;33:280–288. doi: 10.1016/j.ympev.2004.06.018. [DOI] [PubMed] [Google Scholar]
- Weir JT. Divergent timing and patterns of species accumulation in lowland and highland Neotropical birds. Evol. Int. J. Org. Evol. 2006;60:842–855. [PubMed] [Google Scholar]
- Williams ST, Jara J, Gomez E, Knowlton N. The marine Indo-West Pacific break: contrasting the resolving power of mitochondrial and nuclear genes. Integr. Comp. Biol. 2002;42:941–952. doi: 10.1093/icb/42.5.941. [DOI] [PubMed] [Google Scholar]
- Zachos J, Pagani M, Sloan L, Thomas E, Billups K. Trends, rhythms, and aberrations in global climate 65 Ma to present. Science. 2001;292:686–693. doi: 10.1126/science.1059412. [DOI] [PubMed] [Google Scholar]
Associated Data
This section collects any data citations, data availability statements, or supplementary materials included in this article.