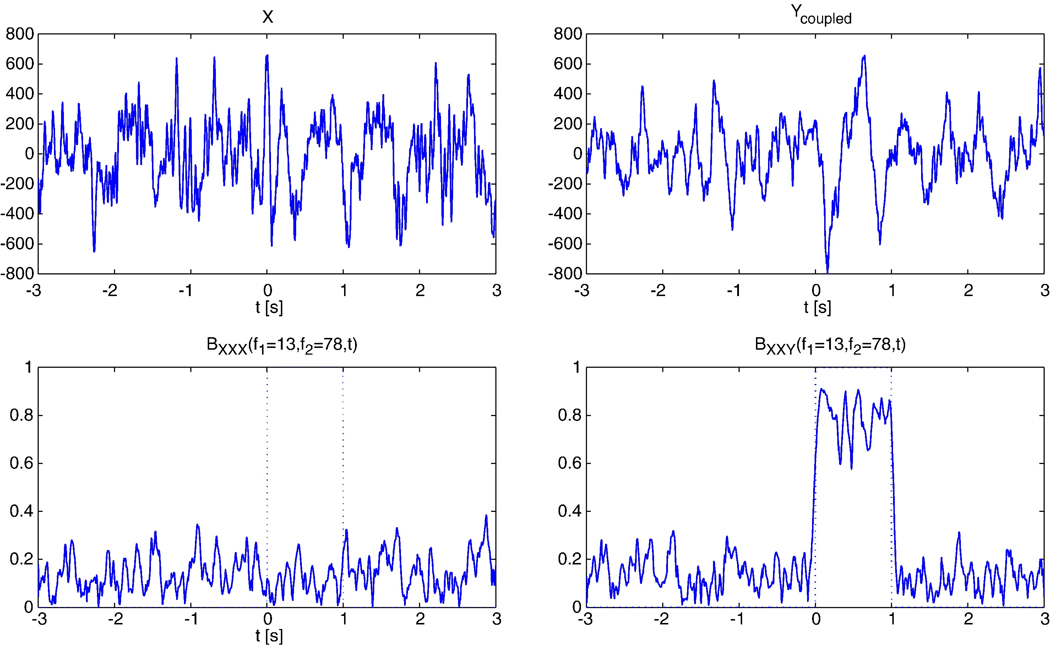
Fig. 2.
bPLV between simulated signals. Top row: The signals X and Y, sampled at 250 Hz over a 6 s period. Bottom row, left: Coupling of X to itself at frequencies (f1,f2) = (13,79) Hz to f3 = 91 Hz. The dotted line shows the interval, where X and Y are bi-phase coupled. Bottom row, right: Coupling of X to Y at the same frequencies.

