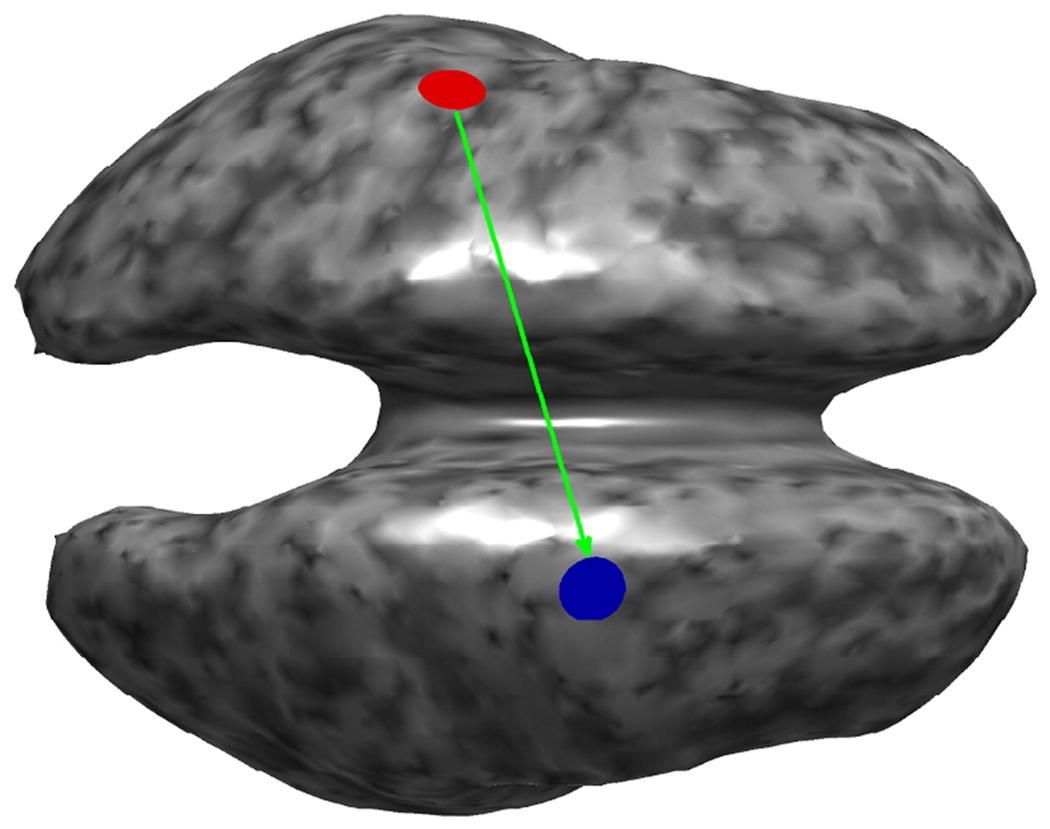
Fig. 5.
Simulation setup. The white matter/cerebral cortex interface was used as source space and two synchronized sources (red, blue disks) were used, one in each hemisphere. In case of the bPLV the direction of interaction (green arrow) was from red to blue. Note that the surface has been inflated for better visibility. The grey color scale was used to indicate the cortical curvature.

