

Abstract
Investigation of the transcription factor (TF) proteome presents challenges including the large number of low abundance and post-translationally modified proteins involved. Specialized purification and analysis methods have been developed over the last decades which facilitate the study of the TF proteome and these are reviewed here. Generally applicable proteomics methods that have been successfully applied are also discussed. TFs are selectively purified by affinity techniques using the DNA response element (RE) as the basis for highly specific binding, and several agents have been discovered that either enhance binding or diminish non-specific binding. One such affinity method called “trapping” enables purification of TFs bound to nM concentrations and recovery of TF complexes in a highly purified state. The electrophoretic mobility shift assay (EMSA) is the most important assay of TFs because it provides both measures of the affinity and amount of the TF present. Southwestern (SW) blotting and DNA-protein crosslinking (DPC) allow in vitro estimates of DNA-binding-protein mass, while chromatin immunoprecipitation (ChIP) allows confirmation of promoter binding in vivo. Two-dimensional gel electrophoresis methods (2-DE), and 3-DE methods which combines EMSA with 2-DE, allow further resolution of TFs. The synergy of highly selective purification and analytical strategies has led to an explosion of knowledge about the TF proteome and the proteomes of other DNA- and RNA-binding proteins.
Keywords: transcription factor, purification, proteomic analysis
1.0 Introduction
Venter, et al [1] estimated that approximately 10% of all human genes are enzymes making this the largest group of human genes. The second largest group, comprising 6% or approximately1500 genes, is transcription factors (TFs). What is most remarkable about these statistics is that less than 5% of the TFs have ever been purified and characterized [2]. It is this gap in current knowledge that emphasizes the importance of further investigation of the TF proteome. The very low abundance of TFs makes their purification challenging but new techniques have become available to make purification and analysis much less challenging and more rational; these will be discussed in this review.
To determine how genes are regulated, we must ultimately understand their promoter structure. DNA response elements (REs), the binding sites for TFs which activate or inhibit transcription of that gene’s mRNA, exist within the promoter. Some TF/REs are common to most promoters. Examples include the ATATAA (“tata”) consensus element, TFIIB recognition element (BRE) and the downstream promoter element (DPE) common to most genes transcribed by RNA polymerase II of eukaryotes. Others are common, but somewhat less universal, such as the Sp1 TF family, which binds the GC-box element found in many promoters. Finally, there are tissue specific (e.g., MyoD), hormone specific (e.g., the estrogen receptor is a TF), and developmentally specific TFs (e.g., the B3 TF of Xenopus oocytes). To understand how the same genetic information gives rise to so many different types of cells and tissues, we will need to understand how the many TFs encoded in the human genome are regulated by ligand binding, post-translational modification (PTM), etc. This understanding is crucial to the development of treatments for cancers and other non-infectious diseases. Currently, few promoters are characterized in any detail. To characterize these, each DNA element must be identified and its binding protein purified. DNA affinity chromatography has been used for the purification of nearly every TF known.
A significant advance in this area has been systematic oligonucleotide trapping [3,4]. TFs bind to their cognate DNA RE typically with nM-pM affinity. They also bind essentially any DNA sequence “non-specifically” with near µM affinity. This probably has a great deal to do with how they function in vivo. Von Hippel and colleagues originated the sliding model of TF-DNA binding [5–7]. This model predicts that TFs diffuse 3-dimensionally, binding euchromatin anywhere along its length, and then slide one-dimensionally along the DNA to locate their RE. This one-dimensional diffusion is much more rapid than the three-dimensional alternative and accounts for why some TFs bind RE DNA with on-rates more rapid than 3-dimensional diffusion would allow. Thus, this “non-specific binding” may be an essential component of their mechanism, for binding to DNA from solution, while their higher affinity RE-binding positions them correctly. This concept has a profound effect on purification. Even columns containing as little as 1 nmol of DNA per mL of column bed contain µM DNA and as such can probably bind any TF “non-specifically”. To circumvent this problem, we developed methods for purifying TFs using DNA at nM concentrations in solution. To do so, we used the electrophoretic mobility shift assay (EMSA) to measure the affinity of a TF for its RE and added different modifiers (heparin, poly (dI,dC), T18, detergents, salt) to optimize specific, high affinity binding and lessen non-specific binding. Using these optimized conditions, nuclear extract can be diluted such that the concentration of the TF equals the Kd for the RE (typically nM or less), RE oligonucleotide is added to 10 × Kd to ensure high yield, modifiers are added at their optimal concentration to minimize non-specific interactions and the specific complex is allowed to form in solution. The RE oligonucleotide is designed to contain a single-stranded tail which is annealed to its complement on a column to recover the complex which is then specifically eluted [3,4,8–10]. We have now purified and characterized six TFs by this method. The only problem encountered so far has been that the tail and ends of the RE oligonucleotide are also binding some abundant DNA repair proteins. This problem is now being solved by replacing the tail region with other moieties, such as thiol groups [11], which can provide the basis for column recovery of the TF-RE complex during trapping.
Since we will also discuss promoters here, some background information is necessary. At the promoter, there are two types of TFs we need to distinguish: 1) the general TFs (for RNA polymerase II, these are the TFII complex components including the TATA-binding protein) and 2) the specific TFs, such as Sp1, C/EBP, AP1, etc. How well these bind to a given promoter determines the transcription level and thus expression of a gene. Two other components, RNA polymerase II (RNApol-II) and the mediator complex are recruited to form a “pre-initiation complex” (PIC). According to current models of transcription [12,13], the specific TFs bind to the promoter and help recruit the general TFs which assemble over a DNA sequence region of 40–60 bp upstream and downstream of the transcription initiation site where transcription of the RNA will begin. This complex binds RNApol-II with associated mediator. All together, approximately sixty proteins or subunits are involved in PIC formation. ATP is then bound and the C-terminal domain of RNApol-II is hyperphosphorylated by protein kinases incorporated in the PIC. Mediator partially dissociates from RNApol-II along with most other components of the PIC yielding what is termed the “Open Complex” (OC). Then, rNTPs bind RNApol-II and transcription begins [12,13]. Remaining at the promoter are the specific TFs, Mediator and the TFII complex except for TFIIB and TFIIF. This is referred to as the “Scaffold Complex” (SC). This SC can then recruit more RNApol-II, TFIIB and TFIIF and re-initiate transcription. The RNA polymerase II transcription machinery is the subject of a recent review [12]. The regulation of this process is also of considerable interest. Many TFs are phosphorylated or post-transcriptionally modified in various ways, and this also regulates transcription. For example, c-jun, a subunit of the AP1 TF, has five different phosphorylation sites, some of which increase or decrease transcription [14].
1.1 Significance
The purification of TFs is necessary to understanding genetic regulation and the origin of cell and tissue types at a molecular level. As gene therapy becomes more practical, we must understand promoter structure and function if we are to more successfully target the expression of introduced genes. Furthermore, many TFs (e.g., c-jun, c-myc) were first identified as oncogenes. Understanding the TF proteome is one of the most important challenges in biology.
The current way in which a promoter region is characterized is tedious. First, a reporter gene construct is prepared and the promoter sequence is progressively shortened until the smallest functional unit is identified. Then, using various techniques from bioinformatics to DNA foot-printing, each element bound by a TF is tentatively identified. Each element is then synthesized as a duplex oligonucleotide and EMSA is used to detect binding in a nuclear extract. If sufficient information is available to make a reasonable prediction about which TF binds that element and specific antibodies are available, they can be used in a EMSA supershift assay [8] to positively identify the TF bound. Otherwise, each unidentified TF must be purified and characterized. This process, literally, consumes the careers of scientists. How much simpler it would be if the entire promoter could be used to directly purify those TFs which bind and these could then be identified by capillary liquid chromatography-tandem mass spectrometry (LC/MS/MS) or other proteomic approaches. If further purification were necessary, this promoter bound fraction would provide an initial purification step for other techniques, such as systematic oligonucleotide trapping [4]. We have now developed a method, called "promoter trapping", which has great promise. We showed that an entire promoter could be used to trap an intact transcription initiation complex and that this complex contains TFs known to bind that promoter and not un-related proteins [15]. If we can successfully interface this method to capillary LC/MS/MS-based proteomic methods, then all of the TFs binding a promoter can be identified and characterized as a group, rather than having to purify each TF individually. Since purifying a single TF occupies years of scientists’ time, speeding this process would be a significant accomplishment.
Finally, as fine as the purification methods may be, additional purification is often needed. In proteomics, two-dimensional gel electrophoresis (2-DE) is frequently used to provide such additional purification. As applied to TFs though, 2-DE has been much less frequently used. The reason for this that these low abundance proteins are difficult to detect. Specific detection of TFs by Southwestern (SW) blotting is well known for one-dimensional denaturing sodium dodecyl sulfate-polyacrylamide gel electrophoresis (SDS-PAGE) but has not been widely applied to 2-DE or in a way that could be directly interfaced to capillary LC/MS/MS proteomic techniques. To do so, we have developed methods for blocking and renaturing blots, probing the blots with radiolabeled oligonucleotide for specific detection (i.e., SW blotting), stripping away the isotope and on-blot trypsin digestion. These methods will allow partially purified TFs to be further enriched prior to identification via capillary LC/MS/MS. Additionally, we have recently used EMSA to separate TF-RE complexes, cut the complex band from the gel, and applied the complex to SDS-PAGE as an alternative kind of 2-DE. Most recently, EMSA separation has been merged with isoelectric focusing-SDS-PAGE to provide a 3-DE. EMSA is a kind of affinity electrophoresis that has been used to assay most TFs and has been shown to be highly specific for a particular TF. Thus, 3-DE should provide quite high selection via specific DNA-binding, isoelectric pH, and molecular weight (MW), and may provide the highest resolution electrophoresis possible for TFs.
This is not to say that the trapping techniques so far developed cannot be improved. The systematic oligonucleotide trapping technique works well and is now widely used for TF purification. However, as we have purified very low abundance TFs, we have found that the single-stranded tail method of trapping results in some contamination from DNA-repair related proteins (e.g., PARP-1) and single strand binding proteins such as the hnRNP proteins [8]. We have begun to develop two alternative ways of trapping, using thiol and immobilized metal affinity chromatography (IMAC), which should avoid these difficulties.
We discussed problems we encountered during purification of “low abundance” TFs. However, the problem is not actually the low abundance of TFs per se, but rather the relatively high abundance of contaminants (i.e., a problem of dynamic range). For example, we were unable to use capillary LC/MS/MS methods to analyze c-jun [8]. This is not because c-jun is below the limit of detection of LC/MS/MS; we can always purify a greater amount of c-jun if this were the problem. Instead, it is the fact that c-jun has a molecular weight of 39 kDa and a common contaminant we encountered was hnRNPA with a MW of 37 kDa. This contaminant is much more abundant in some of our fractions than c-jun; it co-migrates with c-jun on SDS-PAGE. We can readily show c-jun is present by western blotting. However, hnRNPA masks c-jun identification by capillary LC/MS/MS. This problem has been observed by others when analyzing c-jun by MS [16] and we have discussed this problem thoroughly [8]. By developing multi-dimensional separation techniques and improving trapping, we should solve this “abundant contaminant” problem.
Most protein purification, including that used for TFs, has always been empirical. Only in a few cases (e.g., antibody purification using protein A-Sepharose affinity chromatography or dehydrogenase purification on Procion dye-Sepharose) are there well-known and widely applicable ways of purifying a new protein of interest. As chromatography is improved, that situation should improve. As these methods improve, investigators can make rational choices, choosing those purification steps most likely to succeed. To accomplish this, most current experiments are, of necessity, comparative and focus on improving purification techniques. Most investigators spend their time purifying and characterizing a single protein of interest. Seldom is the purification itself investigated to determine what method works best. Are concatemers preferable to discrete DNA sequence columns [17], is there an alternative to salt elution of DNA-columns [18], are columns prepared by chemical coupling inferior to those produced enzymatically [19], etc.? A large part of the significance of the latest studies is that we are not likely to ever learn the answer to "what works best?" as a consequence of other studies. This is a separate area of investigation.
Here, we discuss recent improvements in TF assay and purification and TF sample preparation and analysis which will likely have an important impact on our understanding of the TF proteome. Three resources on the internet deserve mention since they are particularly useful in analyzing the TF proteome, provide extensive tools for analyzing TFs and extensive databases of these proteins: DBD TF prediction database (http://dbd.mrc-lmb.cam.ac.uk/DBD/index.cgi?Home); TrDB (http://bioinf.uab.es/cgi-bin/trsdb/trsdb.pl); and TransFac (http://www.gene-regulation.com/pub/databases.html#transfac). These databases allow analysis by RE sequence, TF name or sequence, and provide links to relevant papers and other database entries.
2.0 TF Analysis
The first step is usually to identify specific response elements (REs) important to a promoter function. Normally, promoter assays, where the promoter under study is fused with a reporter enzyme (e.g., luciferase, β-galactosidase, chloramphenicol acetyl transferase, etc.) are first performed. The sequence is truncated until a minimal promoter is determined, and then individual TF-binding sites (REs) are located by enzymatic or chemical footprinting methods [20], and confirmed by mutation analysis. The determined RE sequences on the promoter will be useful for designing oligonucleotides for EMSA, which confirm the specific binding of TFs with these DNA sequences in vitro. SW blotting and/or DNA-protein crosslinking analysis using the same probe is then performed to determine the MW of the TF binding to the RE. On the basis of such studies, databases associated with TFs such as TransFac can be searched with the ‘molwSearch’ utility and the RE sequence can be searched with other utilities to determine if an associating TF is already known. In addition, EMSA antibody supershifts and ChIP assay should then be performed to confirm the in vitro and in vivo interactions, respectively, of the protein with the DNA motif using specific antibodies [21]. Some of the techniques used to assay TFs will be discussed below.
2.1 EMSA (electrophoretic mobility shift, gel shift or gel retardation)
EMSA is used to monitor the ability of a protein binding to a segment of DNA, typically a double-stranded oligonucleotide of 20–25 bp containing a RE, and the quantity of that protein activity in vitro. The concept of EMSA was first put forward by Fried and Crothers [22] and Garner and Revzin [23] and is deceptively simple. A specific oligonucleotide containing the RE sequence is radio-, fluoro-, or hapten-labeled. When mixed with a protein fraction such as a nuclear extract, it will form a complex with specific TFs. The TF-RE complex will migrate more slowly than free DNA molecules by nondenaturing PAGE [24]. The mobility of TF-RE complexes on the gel is determined by both size and charge. An image of the gel reveals the positions of the free and bound labeled DNA.
The target DNA used in EMSA is always a linear duplex DNA fragment containing the binding sequence(s) of interest, which can be synthesized, and purified by gel electrophoresis or high performance liquid chromatography. DNA is radiolabeled with [α-32P]dNTP during a 3´ filling reaction using Klenow fragment or by 5´ end labeling with T4 polynucleotide kinase using [γ-32P]ATP. Alternatively, DNA can be synthesized with a biotin or other hapten- or fluoro-labeled dNTP.
The labeled DNA is mixed with nuclear extract or some other protein fraction and the TF-RE complex is allowed to form. This will then be resolved by non-denaturing PAGE. In order to determine the specific complexes formed, excess amounts of unlabeled DNA, i.e. specific competitor that is identical to labeled probe DNA, or nonspecific competitors, such as mutant or unrelated sequence, is often added in some EMSA reactions for comparison. The presence of excess amounts of specific competitor will inhibit or reduce the specific TF-RE complex formation, while nonspecific competitor will not affect the complex greatly, thus will define the complexes which form with DNA of any sequence [25].
Many attributes of EMSA are illustrated in Fig. 1A. This experiment uses a radiolabeled duplex WT oligonucleotide containing a RE found in the c-jun promoter. Only the free DNA band is observed with no added protein (NP). However, the TF-RE complex band (C) is observed when nuclear proteins are added without any competition (NC). When unlabeled wild-type RE (WT) is added in excess over the labeled probe, the complex is clearly diminished by competition. Mutation of the RE (MUT) prevents competition. Finally, a non-specific complex (U) that is not relevant to this RE, which is competed by neither WT nor MUT, is also observed.
Fig.1.
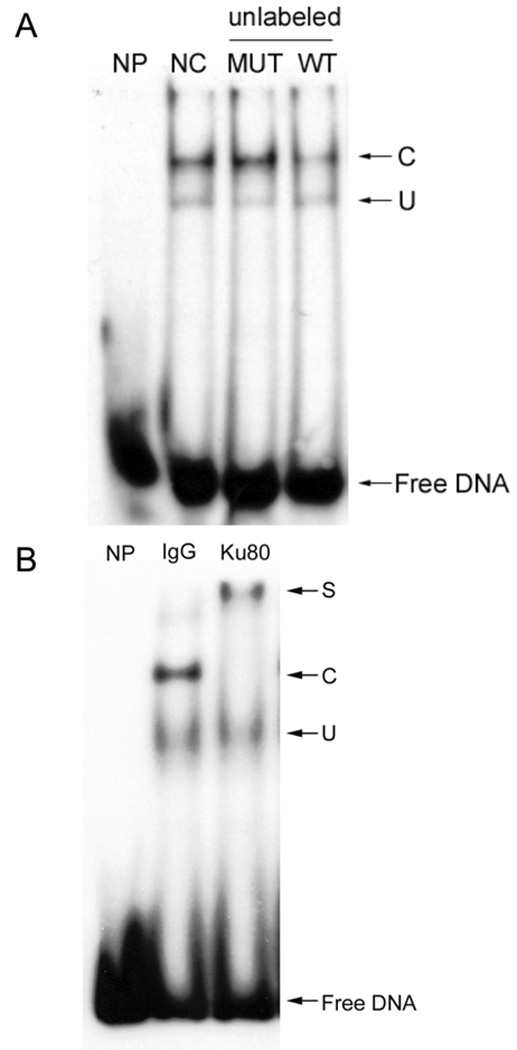
(A) EMSA cold competition assay. 20-fold of unlabeled c-jun element DNA including wild type (WT, 5’- CCGTGAGCCTCCGCGGG -3’, annealed to its complement) and mutant (MUT, 5’-TCTGGGCCCGCGACGTGCAACGGGATGAGGT-3’ annealed with its complement) is added to EMSA reaction with radiolabeled WT duplex oigonucleotide for cold competition assay. NP, no protein; NC, no cold DNA; C, specific complex; U, non-specific complex. (B) EMSA antibody supershift assay. 40 ng of Ku80 antibody (Ku80) or control IgG (IgG) is incubated with HEK293 nuclear extract before EMSA reaction with radiolabeled WT duplex oigonucleotide for antibody supershift assay. NP, no protein; S, supershift band; C, specific complex; U, non-specific complex.
Significantly, an EMSA supershift assay [26] can be used to study higher-order complexes containing several proteins. If a specific antibody is available for a TF believed to bind the RE, then adding the antibody to the EMSA reaction will generate a DNA-TF-antibody complex that will migrate even slower than the TF-RE complex and is thus ‘supershifted’. Alternatively, the antibody may block DNA-binding and diminish the amount of TF-RE complex that is observed. In either case, the identity of the TF is confirmed.
Such an experiment is shown in Fig. 1B using an element on c-jun promoter which binds a complex containing the Ku80 protein [8]. In this case, adding an irrelevant IgG does not shift the complex band. In contrast, an antibody specific for Ku80 shifts essentially the entire antibody-Ku80-DNA complex to a slower migrating form.
EMSA can also be used to determine the relative affinities of a TF for one or more DNA sites or to compare the affinities of different TFs for the same site [27]. The affinity of the TF binding to the DNA can be calculated by the ratio of bound to unbound (free) DNA at different DNA concentrations by Scatchard analysis. This is shown for the c-jun complex in Fig. 2 where a larger gel is employed to observe all major and minor complexes. The upper panel shows the autoradiogram, the position of the complex (C) containing bound DNA, and the position of free DNA as different total concentrations of the DNA probe is used. The lower panel gives the results of densitometry as a Scatchard plot. The apparent binding affinity, Kd, is 3 nM, while the maximum amount bound for this dilution of nuclear extract is 1.6 nM. Since the nuclear extract is diluted 10-fold, it contains 16 nM of the TF which specifically binds this RE.
Fig.2.
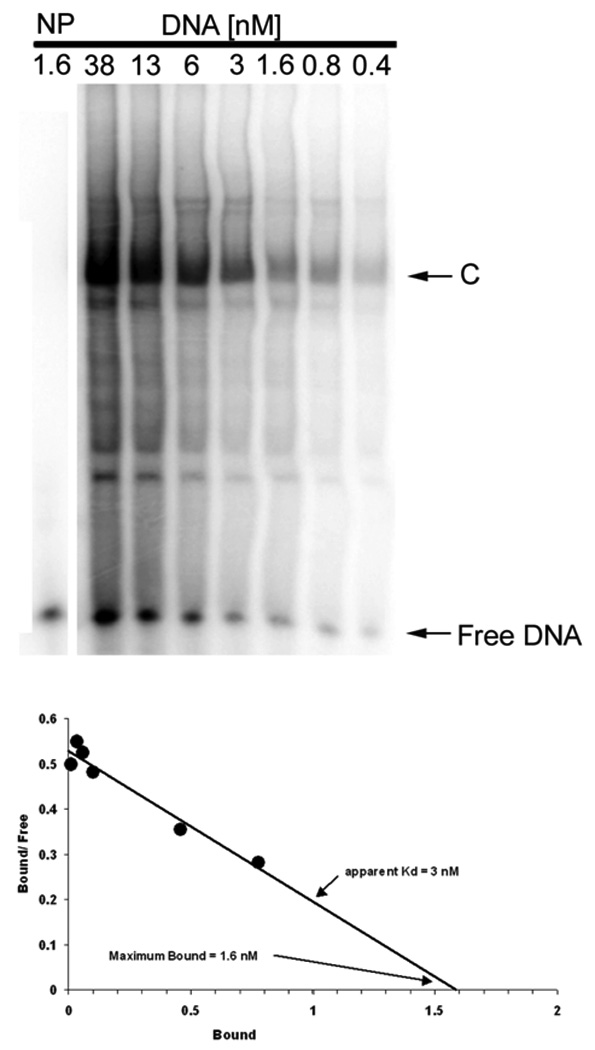
EMSA determination of the DNA binding affinity. Nuclear extract, 10 fold diluted, was mixed with 2-fold serial dilutions of radiolabeled c-jun WT element for EMSA. The density of the specifically shifted band (C), the Free DNA band, and the total density for each lane (T) are used to calculate the concentration of bound and free DNA for each nuclear extract dilution. Scatchard analysis (lower panel) yields the apparent DNA-binding affinity and concentration of the transcription factor in HEK293 nuclear extract, which shows an estimate of Kd = 3 nM in this experiment for this TF-RE complex (C). The plot also shows the maximum binding (Bmax) of 1.6 nM for a 10-fold dilution nuclear extract, which provides an estimate of 16 nM binding activity in the undiluted nuclear extract. NP, no protein.
The two major advantages of EMSA are: it is able to resolve TF-RE complexes of different stoichiometries or conformation, and the sample for EMSA may be crude nuclear or whole cell extract rather than a purified preparation. However, EMSA has limitations: (1) Several TFs bind related and even unrelated DNA sequences; (2) If the TF-RE complex contains multiple proteins, the EMSA pattern provides little information about the identity of these, and further analysis such as EMSA supershift assays and ChIP assay may be needed [28]. Since many TFs bind DNA as heterodimers, identifying a single TF is no guarantee that there are not other associated TFs. (3) EMSA relies on knowing a RE to be used as a probe, and this sequence must be determined in other ways.
2.2 Southwestern (SW) blotting
SW can be used to determine the MW of an unknown TF binding to a specific RE. The SW was first described by Bowen et al early in 1980 [29] to identify and characterize TFs, which provides information about the molecular weight of an unknown TF. In current versions of this technique, proteins in crude nuclear extracts or partially purified preparations are first separated by denaturing SDS-PAGE by MW and then blotted to nitrocellulose or PVDF membrane. The blot is then renatured in a SDS-free buffer containing urea to remove detergent, and the urea concentration is gradually reduced to allow protein refolding to occur. In some cases, the TFs are denatured and renatured using Guanidine hydrochloride [30]. Renatured proteins are incubated with a 32P-labeled duplex DNA probe, typically at nM concentrations, to ensure specificity and subsequently visualized by autoradiography. The MW of the TF is calculated by comparison to standards. For example, a SW blot of the c-jun element is shown in Fig. 3A. In this case, 1.5 nM of radiolabeled probe is bound to three closely spaced TF bands from 37–40 kDa.
Fig.3.
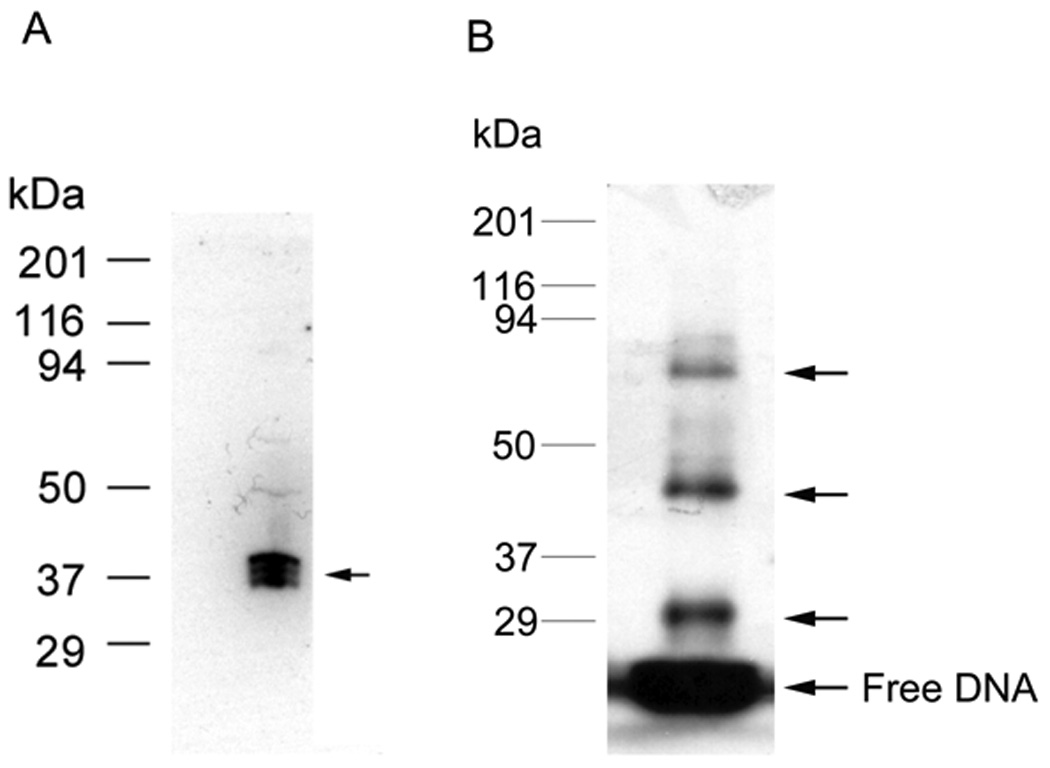
(A) Southwestern blot assay. HEK293 nuclear extract was separated by 12% SDS-PAGE gel electrophoresis and transferred to nitrocellulose membrane. The blotted proteins were denatured and renatured by adding guanidine hydrochloride to 6M and gradual dilution to 0.1M. The proteins on blot bound the labeled c-jun element (1.5 nM) during subsequent incubation and washing. Autoradiography analysis indicates the position of proteins on the blot that interacted with element DNA, indicated by the arrow. In this case, the complex consists of three closely spaced bands from 37–40 kDa. (B) DNA UV-crosslinking assay in vitro. HEK293 nuclear extract was incubated with labeled WT c-jun element at room temperature for 30 min, then UV crosslinked on ice for another 30 min, the UV-crosslinked proteins are separated by 12% SDS-PAGE gel electrophoresis. Autoradiography analysis indicates the position of protein-DNA complex, indicated by arrows. This revealed a protein DNA complex of about 45 and 85 kDa in this case plus a DNA-DNA crosslink near 30 kDa. Protein standards are shown on the left.
The advantage of SW over other methods such as EMSA and DNA footprinting is that the molecular weight of unknown TFs is readily determined without special equipment. Consequently, a SW is a prerequisite in many laboratories for DNA affinity chromatography of TFs. Related methods can be used to screen expression libraries with DNA probes. The success of a SW largely depends on renaturation after SDS treatment. Some TFs may be inefficiently renatured and thus be unable to bind DNA on blots. In particular, any heteromeric protein that requires a combination of different subunits to bind DNA will be missed by this technique. Likewise, since the separation of proteins under denaturing SDS-PAGE could dissociate polymeric protein factors leading to ineffective binding of DNA, a SW is not suitable for detecting TFs that require more than one subunit for efficient DNA binding [21]. In addition, TFs requiring cofactors for DNA binding may also be difficult to be detected [31]. This is especially true for TFs with Zn2+-finger and Zn2+-cluster motifs [32].
2.3 Two-dimensional southwestern blot (2D-SW): 2D-SW is developed to detect the pI and MW of a DNA binding protein
Two-dimensional gel electrophoresis (2-DE) is one of the most powerful protein separation techniques, enabling resolution of up to 5000 proteins on a single gel [33]. Although 2-DE is a powerful tool to separate complex biological samples, it has been much less frequently used in TF purification because low abundance TFs present difficult challenges of detection. As mentioned above, a SW blot may be used to determine the molecular weight of TF-RE complexes. TFs detected by SW blots are well known for one-dimensional SDS-PAGE, but 2-DE has not been widely used for TFs. Undoubtedly, a SW blot combined with 2-DE provides higher resolution than SDS-PAGE since TFs are resolved by both molecular weight and isoelectric point.
To perform 2D-SW, nuclear extract or a partially purified sample is separated by 2-DE before protein spots are blotted, renatured, and probed with radiolabeled DNA. The SW spot on a 2-DE blot reveals the location of a specific TF. Using this method, it is feasible to cut the corresponding spot from the blot directly for capillary LC/MS/MS-based protein identification. In our laboratory, 2-DE-SW has been developed and applied successfully to purify GFP-C/EBP fusion protein from bacterial crude extract, C/EBP [34], and USF2 from HEK293 nuclear extract (Shoulei Jiang and Harry W. Jarrett, unpublished data). For example, a 2-DE-SW experiment is shown in Fig. 4. A silver stained 2-DE gel in Fig. 4A shows that hundreds of spots expanding a very broad range of MW and pI are separated from nuclear extract of HEK293 cells. When a blot of the 2-DE gel is incubated with 1.5 nM radiolabeled RE bound by C/EBP for SW analysis, two major spots, one of which with pI 8.3 and M.W 40 kDa and another with pI 6.0 and M.W 110kDa, and several minor ones, occupying regions of the gel where there are relatively few proteins, are identified as binding to this RE (Fig. 4B). Further identification by capillary LC/MS/MS indicates one of the spots on the 2-DE-SW blot to be C/EBP beta and a 2-DE western blot confirms that the 2-DE-SW spot can be detected with a C/EBP beta antibody at same location.
Fig.4.
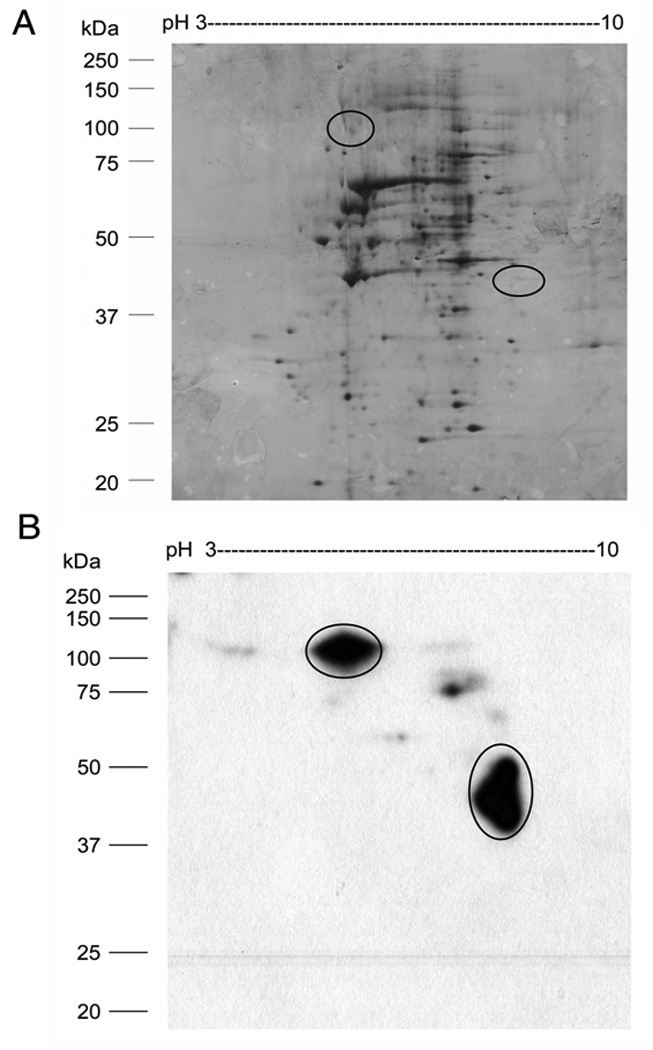
(A) Two-dimensional gel electrophoresis (2-DE) of HEK293 nuclear extract. HEK293 nuclear extract (50 µg) was separated by IEF using a pH 3–10 strip (7 cm) combined with 12% SDS-PAGE gel electrophoresis in the second dimension. The 2-DGE gel is stained by silver nitrate. (B) Two-dimensional southwestern blot analysis (2D-SW) of the CAAT enhancer binding protein (C/EBP) in nuclear extract. A 2-DE gel of HEK293 (50 µg) nuclear extract was transferred to nitrocellulose membrane for SW blot analysis. The proteins interacting with C/EBP cognate DNA are indicated by circles. Position off protein MW standard is shown on the left.
2.4 DNA-protein crosslinking (DPC) in vitro
DPC is another technique to detect the molecular weight of a TF-RE complex. In this method, when a TF-RE complex is formed and UV irradiated, it causes the formation of covalent bonds between pyrimidines and certain amino acid residues in the TF that are in close proximity to the DNA. SDS-PAGE reveals the molecular weight of the complexes formed [25]. DPC assay can also be used to measure DNA-protein affinity and amount of DNA binding proteins to specific DNA sequences [35]. As long as all components are in close contact with the DNA, DPC can reveal heteromeric complexes and those involving cofactor binding, which cannot be detected by southwestern blot analysis. However, UV light produces less stable and relatively inefficient interaction as well as protein redistribution and artifactual crosslinking of UV-damaged molecules because of long exposure time from minutes to hours. The drawbacks of conventional UV light may be overcame by high-intensity pulsed UV-laser irradiation which requires little time, nanoseconds or picoseconds, to complete rapid DNA-protein binding. This “freezes” existing DNA-protein interactions, thus avoiding artifactual crosslinking, and improves the yield of DNA-protein crosslinks 50–100 fold without the formation of protein-protein crosslinks.
UV-crosslinking results for the c-jun element are shown in Fig. 3B. DNA-crosslinking adds about 15.6 kDa (24 bp × 650 Da/bp=15.6 kDa) of RE to the apparent MW. Therefore, the upper two bands (arrows) correspond to proteins of about 80 and 37 kDa, respectively. There is also a band near 29 kDa that is probably from the result of DNA-DNA crosslinking.
2.5 Chromatin immunoprecipitation assay (ChIP) in vivo
ChIP is a powerful and widely used tool for identifying TFs, histones, and other DNA-binding proteins, associated with specific genomic regions in vivo. ChIP includes chemical crosslinking, sonication, immunoprecipitation, and analysis of the immunoprecipitated DNA or protein. There are two types of ChIP: Cross-linking ChIP (X-ChIP or XChIP) and native chromatin ChIP (N-ChIP or NChIP). The former uses chromatin fixed with formaldehyde and fragmentation by sonication. The later uses native chromatin prepared by nuclease digestion of cell nuclei. In live cells, protein-protein and protein-DNA within a short distance (2 Å) of the euchromatin are semi-reversibly crosslinked with formaldehyde. After crosslinking, cells are lysed and sonicated to shear the DNA to fragments of approximately 500 bp in length. Crosslinked TF-DNA species are then immunoprecipitated and enriched by an antibody directed against a TF or a specific post-translational modification (PTM) thereof. After crosslinking reversal, the resulting DNA and TFs can be independently studied by PCR or western blotting analysis, respectively. Success of ChIP depends on the abundance of TF-RE complexes, the antibody, the size and complexity of the genetic loci in question.
ChIP has these advantages: (1) Detection of interactions between the promoter DNA and its TFs in the natural genomic state. (2) Providing information on the histone code (i.e., histone acetylation, trimethylation, etc.) and PTMs of TFs for discrete chromatin regions. (3) Crosslinking minimizes the chances of chromatin rearrangements during preparation and precipitation. (4) Increased specificity due to the availablility of gene-specific primers for subsequent PCR of the immunoprecipitated DNA. The disadvantages of ChIP are: (1) it typically requires several days to complete an assay. Recently, Nelson et al developed an efficient and rapid Chelex resin-based ChIP procedure that dramatically reduces turnaround time [36]. (2) Certain antibodies are inefficient for immunoprecipitation. (3) Lack of crosslinking may occur due to inaccessibility of factors in large complexes or the biochemical properties of the TFs themselves. Thus, a negative result does not necessarily mean that a given TF is not associated with the RE. (4) Cross-linking may fix interactions of minor functional significance.
3.0 TF Purification
A major difficulty in the purification of TFs is their low abundance (ranging between 102 and 105 molecules per cell). Assuming 1–10 pmol (50–500 ng at 50 kDa.) of pure protein is required for analysis, including capillary LC/MS/MS for protein identification, it is estimated that 108−1011 cells are needed for TF purification if the overall yield is 50%. There are always several methods to purify a TF to homogeneity. Among them, DNA affinity chromatography is the most widely used.
3.1 Concatemer DNA affinity chromatography
For DNA affinity chromatography, sometimes the target double-stranded (duplex) DNA is prepared as a concatemer, composed of multiple tandem repeats of a RE specific for a TF, and covalently immobilized on a matrix support such as cyanogen bromide-activated Sepharose beads (Sepharose 4B or CL-2B). The TF is purified because it preferentially binds to the REs in the affinity resin rather than to nonspecific competitor DNA, typically poly dI:dC, that is added to the mobile phase [37]. After the nuclear extract or partially purified fraction pass through this column, the TF will bind to the matrix, which can then be eluted with a salt gradient. DNA binding activity of the TF can be monitored by EMSA during each step of the purification process.
However, such single-step DNA affinity chromatography may have a high amount of nonspecifically co-purifying proteins. For example, one study showed that concatemers were no more effective at TF purification than a single copy RE [17]. To address this, pre-clear step is used to decrease nonspecific binding, which can be done by using nonspecific DNA column as a first step, or by mixing nonspecific DNA such as fragmented Salmon or herring sperm genomic DNA or mutant target DNA with sequence specific target DNA in solution to decrease nonspecific binding through competition. This pre-clear technique has been successfully used to purify C/EBP, lac repressor, B3, NF458 Y, NF-AT, Stat III and others [17,38]. This procedure can be repeated multiple rounds to increase TF purity. Indeed, many TFs can be purified up to 1000-fold with two sequential purification steps [25]. For example, a protein fraction that is enriched for TF Sp1 can be further purified 500- to 1000-fold by two sequential affinity chromatography steps to give an estimated 90% homogeneity with 30% yield. In addition, the use of tandem affinity columns containing different REs allows the simultaneous purification of multiple TFs from the same extract. This method is successfully used to purify Sp1 and –CAAT-binding TFs [39,40].
DNA affinity chromatography using avidin- or streptavidin solid supports to capture biotinylated DNA has also been exploited. In this approach, the biotinylated DNA is bound by (strept) avidin immobilized chromatographic support (e.g., agarose or to paramagnetic beads). The binding affinity and efficiency of biotin binding to (strept)avidin is very high and resistant to high concentrations of salt and urea, resulting in one of the most stable interactions in biology. After incubation of the biotinylated DNA–streptavidin beads with nuclear extract, a strong magnet is placed against the wall of the containing vessel to recover the beads and the bound TF. Similarly, the addition of excess competitor DNA lessens nonspecific binding. Bound TFs are eluted by resuspending the paramagnetic beads in a buffer of high ionic strength [41]. One limitation of the technique is that streptavidin coated supports can bind additional proteins in nuclear extract, especially those containing the biotin group, and avidin or streptavidin are highly charged proteins that may interact non-specifically with other proteins lacking biotin to decrease the purity of recovered TFs [41–43].
3.2 Trapping
Since TFs typically bind REs with nM-pM affinity, the most specific purification would be obtained by forming the TF-RE complex at these low concentrations. DNA covalently attached to columns is almost always present at µM or higher concentrations in traditional affinity chromatography and probably encourages nonspecific binding. To allow efficient purification at lower concentrations, trapping procedures were developed. When duplex DNA (oligonucleotide or promoter) containing a (GT)5 single-stranded tail is incubated at nM concentrations with a TF, the specific TF-RE complex forms in solution. The complex is then trapped on an (AC)5–Sepharose column by annealing (AC)5 on the column with the (GT)5 of oligonucleotide or promoter in the complex [3,4,8]. To further aid specific binding, modifiers known to decrease non-specific binding, i.e. heparin, T18, poly dI:dC and non-ionic detergent, are added to the trapping mixture. Once trapped on the column, protein bound on the column can be eluted by high salt to disrupt TF-RE interactions. Alternatively, the TF-RE complex can be eluted by using low salt and moderate temperatures to melt the (GT)5:(AC)5 hybrid. This can be refined by measuring the affinity and amount of a TF in a nuclear extract to determine the optimal concentration of modifiers. Compared with conventional DNA affinity chromatography, trapping usually yields a purer TF [3], and in some cases, has only required one-step purification from crude nuclear extract. Oligonucleotide trapping has been used to successfully purify several TFs such as rat liver C/EBP (CCAAT enhancer binding protein), the Xenopus B3 TF [3,4], MafA [10] and a complex which binds a novel RE in the c-jun promoter [8]. In addition, promoter trapping has been developed to purify a transcriptionally active PIC and individual TFs binding to c-jun promoter [15].
3.3 Two-dimensional electrophoretic mobility shift assay (2D-EMSA)
Stead et al [44] developed a two-dimensional electrophoretic mobility shift assay technique (2D-EMSA) to purify nucleic acid binding protein from crude extract. In their study, partially purified or crude extract is first separated by 2-DE. If the pI and MW of the DNA binding protein can be estimated, then the corresponding spot on the 2-DE gel is cut and proteins are electroeluted, renatured and assayed by EMSA. For an alternative 2D-EMSA, EMSA replaces isoelectric focusing in the first dimension of 2-DE. When a TF forms a complex with RE, its electrophoretic mobility is affected compared with that of the free nucleic acid. Following EMSA, denaturing PAGE is implemented in a second dimension. TFs that bind a specific RE are recognized as a spots at particular positions and can be identified by capillary LC/MS/MS. This technique does not require any knowledge of the TF, nor does it require its renaturation after excision from gels. For example, the TF, AtrA, was successfully separated and identified from bacterial crude extract [45,46].
3.4 Three-dimensional EMSA (3D-EMSA)
The success of 2D-EMSA makes the development of another technique, three-dimensional EMSA, which is now optimized in our lab. 3D-EMSA merges nondenaturing EMSA-with 2-DE to purify TFs. This technique is performed by cutting the TF-RE complex band from EMSA non-denaturing gel and applying the band to 2-DE for further separation. As 3D-EMSA combines the high specificity of EMSA and the high resolution of 2-DE, it is possible to purify TFs from crude extract. For example, this method was used to successfully purify a GFP-C/EBP fusion protein constructed to bind C/EBP’s canonical sequence -CAAT-, from bacterial crude extract (unpublished data, DJ and HWJ). Although 3D-EMSA provides the highest selectivity for binding REs, some contaminating proteins are still observed. This is likely due to protein-protein interactions; therefore, 3D- EMSA combined with a SW blot may be necessary for the most challenging TF purification problems.
In summary, enrichment and purity are two major challenges for TFs purification at present. Normally, it is difficult to get TFs significantly enriched from small amounts of material originating from tissue or cells, and it is almost impossible to get homogeneous TF by one-step purifications. Although DNA affinity chromatography is widely used in purification of TFs, non-specific binding is an unavoidable problem due to high concentrations of RE DNA and biotinylated protein. The oligonucleotide trapping technique decreases non-specific binding greatly, but some non-specific binding, such as heterogeneous ribonucleoproteins with RRM motifs, persists due to the DNA tail attached to the RE. Undoubtedly, trapping combined with 2D-SW will enable more difficult problems in TF purification to be solved. EMSA isolation followed by SDS-PAGE or 2-DE will also be explored as promising strategies to improve TF purity.
4.0 TF identification
4.1 TF Sample Preparation
TFs purified by the methods above often yield a minute amount of protein (femtomoles, 10−18) in small (µL) sample volumes that can only be identified and characterized by capillary liquid chromatography-tandem mass spectrometry (LC/MS/MS) or other proteomic approaches. This is a multistep process from sample preparation to analysis, and all steps are critical to a successful outcome. Careful sample preparation is the prerequisite for all subsequent steps. One must avoid and/or remove plastics, particulates, salts, detergents, buffer components and other contaminants that may interfere with digestion, preconcentration, desalting, separation and ionization. It is also important to minimize non-specific absorption, chemical modifications, and keratin contamination (nitrile gloves are advisable) [47,48]. Digestion of the TFs with sequence-specific exogenous protease(s) is the most important step.
4.1.1 In-gel digestion
In-gel digestion coupled with capillary LC/MS/MS is a powerful tool to identify and characterize TFs [49]. After a TF or TF-RE complex is purified, the eluate can be separated by SDS-PAGE or 2-DE. Gels are stained by MS compatible silver nitrate [50] or Coomassie Brilliant Blue prior to digestion with a protease. Trypsin is often used for these studies because it cleaves at the C-terminus of Lysine and Arginine residues to generate peptides that are ideal for capillary LC/MS/MS. For example, our laboratory successfully identified the fusion protein GFP-C/EBP, which is constructed by E-GFP and the DNA-binding domain of C/EBP alpha, by thiol-disulfide exchange DNA affinity chromatography and capillary LC/MS/MS [11]. However, in-gel digestion has major shortcomings such as low accessibility of proteases to TFs within gel slices and low recovery of large and/or hydrophobic peptides [51].
4.1.2 On-blot digestion
On-blot digestion of TFs electroblotted to NC or PVDF membranes is an alternative to in-gel digestion [52]. After a TF on the blot is immunostained, antibody can be removed by washing the membrane in 0.2 M glycine–HCl (pH 2.0). Then, the TF can be digested and peptides are extracted for PVDF. Alternatively, if NC is used, the blot can be dissolved directly into acetone or acetonitrile where precipitated peptides are re-dissolved for subsequent analysis. The latter technique is so called BARN (Blotting and Removal of Nitrocellulose), which offers improved confidence in protein identification, especially for membrane proteins, and provides comparable or better results than in-gel digestion [53,54]. For PVDF membranes, peptides can be extracted by TFA and an organic solvent such as acetonitrile prior to analysis [55]. In order to prevent protease absorption to a membrane, a blocking step should be performed before on-blot digestion.
Several previous reports have described the use of mass spectrometry to identify proteins detected by Western blotting [55]. Nakanishi et al carry out on-membrane digestion using piezoelectric chemical inkjet printing in combination with MS to successfully identify the tyrosine -phosphorylated proteins from A-431 human epidermoid carcinoma cells [56]. Significantly, matrix-assisted laser desorption ionization (MALDI) was employed to ionize peptides directly from the membrane.
Until now, a SW blot combined with on-blot digestion of TFs has not been reported. In order to improve the efficiency of SW blotting and on-blot digestion, we investigated membrane type, renaturing, blocking and stripping of proteins on membranes and the conditions for on-blot digestion such as membrane type, blocking, etc. Recently, we achieved confident identification of the C/EBP (from the lower, right-hand encircled spot in Fig. 4B) in HEK293 nuclear extract by this 2-DE-SW blot and on-blot digestion approach followed by capillary LC/MS/MS. One of the 2DE-SW spots is identified as human CCAAT/enhancer binding protein beta (C/EBP beta) with theoretical pI of 8.55 and molecular mass of 36 kDa, consistent with the position on 2-DE-SW blot. There are two unique peptides matched with human C/EBP beta after searching SwissProt fused with in-house database, which are: APPTACYAGAAPAPSQVKSK [243–262 aa., expect value is 0.0035, Mascot score 19(13 was significant for this search)] for m/z 639.18(3+) and AKMRNLETQHK (292–302 aa., expect value is 0.012, Mascot score 21) for m/z 686.15 (2+), and the sequence coverage of C/EBP beta is 9%. C/EBP exists in several isoforms, perhaps explaining the complexity of the observed spot but the molecular weight and isoelectric point are consistent with known C/EBP isoforms. This is an exciting discovery as it represents the direct identification of a native TF directly from nuclear extract without any prior purification. Further refinements of this technique appear promising and is being pursued [34].
4.1.3 Other types of digestions
In-solution and on-bead digestions are often engaged when high sensitivity and/or sequence coverage are necessary or when specific amino acid residues or PTMs are of interest. For example, improved sequence coverage of low abundance cardiac troponins from serum has been reported with on-bead digestion using multiple proteases [57]. Combining on-bead digestions with affinity microcapture of TFs on DNA-magnetic particles [58] is a promising direction for future studies.
5.0 Conclusions
The synergy of highly selective purification and analytical strategies described herein has led to an explosion of knowledge about the low abundance and post-translationally modified TF proteome and the proteomes of other DNA- and RNA-binding proteins. Purification methods described include: various assays, EMSA, ChIP, SW blots, DPC, concatemer DNA affinity chromatography, Trapping, 2-DE, 2-DE-SW, 2-D-EMSA and 3-D-EMSA. Analysis methods described include: in-gel, on-blot and other digestions combined with protein identification and characterization by capillary LC/MS/MS and other proteomic approaches. We envision that future investigations will combine these and currently unknown technologies to simultaneously deepen our knowledge of the TF proteome and to reveal unexplored intricacies of nucleotide-protein interactions important to human health.
Fig.5.
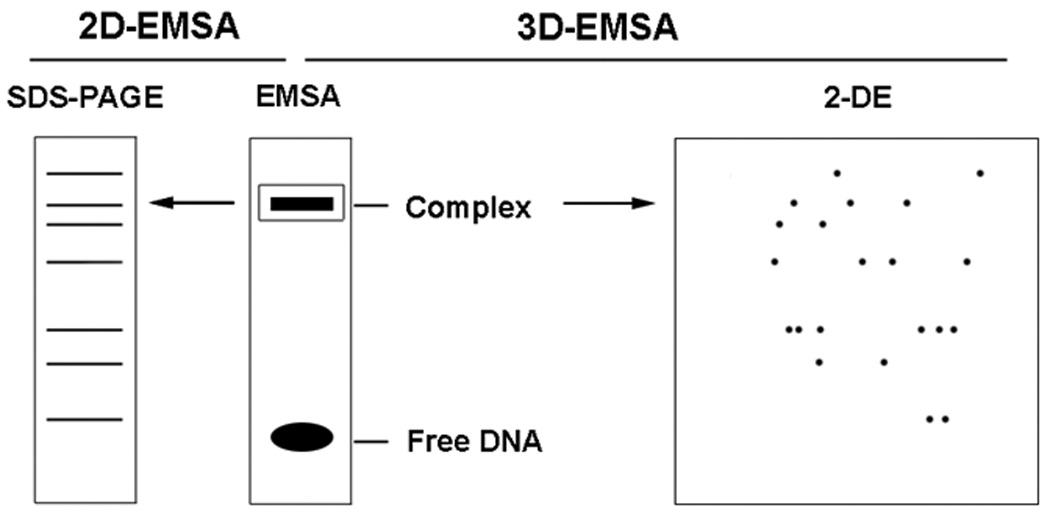
Scheme of 2D-EMSA and 3D-EMSA. Nuclear extract is incubated with radiolabeled element DNA to form specific DNA-protein complex and analyzed by EMSA. The complex on the non-denature PAGE gel is cut out, crashed and mixed with 1X Laemmli buffer or Rehydration buffer for further separation by SDS-PAGE (2D-EMSA)or two-dimensional electrophoresis (3D-EMSA).
Footnotes
Publisher's Disclaimer: This is a PDF file of an unedited manuscript that has been accepted for publication. As a service to our customers we are providing this early version of the manuscript. The manuscript will undergo copyediting, typesetting, and review of the resulting proof before it is published in its final citable form. Please note that during the production process errors may be discovered which could affect the content, and all legal disclaimers that apply to the journal pertain.
References
- 1.Venter JC, Adams MD, Myers EW, Li PW, Mural RJ, Sutton GG, Smith HO, Yandell M, Evans CA, Holt RA, Gocayne JD, Amanatides P, Ballew RM, Huson DH, Wortman JR, Zhang Q, Kodira CD, Zheng XH, Chen L, Skupski M, Subramanian G, Thomas PD, Zhang J, Gabor Miklos GL, Nelson C, Broder S, Clark AG, Nadeau J, McKusick VA, Zinder N, Levine AJ, Roberts RJ, Simon M, Slayman C, Hunkapiller M, Bolanos R, Delcher A, Dew I, Fasulo D, Flanigan M, Florea L, Halpern A, Hannenhalli S, Kravitz S, Levy S, Mobarry C, Reinert K, Remington K, Abu-Threideh J, Beasley E, Biddick K, Bonazzi V, Brandon R, Cargill M, Chandramouliswaran I, Charlab R, Chaturvedi K, Deng Z, Di Francesco V, Dunn P, Eilbeck K, Evangelista C, Gabrielian AE, Gan W, Ge W, Gong F, Gu Z, Guan P, Heiman TJ, Higgins ME, Ji RR, Ke Z, Ketchum KA, Lai Z, Lei Y, Li Z, Li J, Liang Y, Lin X, Lu F, Merkulov GV, Milshina N, Moore HM, Naik AK, Narayan VA, Neelam B, Nusskern D, Rusch DB, Salzberg S, Shao W, Shue B, Sun J, Wang Z, Wang A, Wang X, Wang J, Wei M, Wides R, Xiao C, Yan C, et al. Science. 2001;291:1304. [Google Scholar]
- 2.Gadgil H, Jurado LA, Jarrett HW. Analytical Biochemistry. 2000;290:147. doi: 10.1006/abio.2000.4912. [DOI] [PubMed] [Google Scholar]
- 3.Gadgil H, Jarrett HW. J. Chromatogr A. 2002;966:99. doi: 10.1016/s0021-9673(02)00738-0. [DOI] [PubMed] [Google Scholar]
- 4.Moxley RA, Jarrett HW. J Chromatogr A. 2005;1070:23. doi: 10.1016/j.chroma.2005.02.012. [DOI] [PubMed] [Google Scholar]
- 5.Berg OG, Winter RB, von Hippel PH. Biochemistry. 1981;20:6929. doi: 10.1021/bi00527a028. [DOI] [PubMed] [Google Scholar]
- 6.Winter RB, Berg OG, von Hippel PH. Biochemistry. 1981;20:6961. doi: 10.1021/bi00527a030. [DOI] [PubMed] [Google Scholar]
- 7.Winter RB, von Hippel PH. Biochemistry. 1981;20:6961. doi: 10.1021/bi00527a030. [DOI] [PubMed] [Google Scholar]
- 8.Jiang D, Zhou Y, Moxley RA, Jarrett HW. Biochemistry. 2008;47:9318. doi: 10.1021/bi800285q. [DOI] [PMC free article] [PubMed] [Google Scholar]
- 9.Moxley RA, Oak SA, Gadgil H, Jarrett HW. In: Handbook of Affinity Chromatography. Hage D, editor. New York: Francis & Taylor; 2005. p. 173. [Google Scholar]
- 10.Matsuoka T, Zhao L, Artner I, Jarrett H, Friedman D, Means A, Stein R. Mol Cell Biol. 2003;23:6049. doi: 10.1128/MCB.23.17.6049-6062.2003. [DOI] [PMC free article] [PubMed] [Google Scholar]
- 11.Panda M, Jiang D, Jarrett HW. J Chromatogr A. 2008;1202:75. doi: 10.1016/j.chroma.2008.06.020. [DOI] [PMC free article] [PubMed] [Google Scholar]
- 12.Hahn S. 2004;11:394. [Google Scholar]
- 13.Rani PG, Ranish JA, Hahn S. Mol Cell Biol. 2004;24:1709. doi: 10.1128/MCB.24.4.1709-1720.2004. [DOI] [PMC free article] [PubMed] [Google Scholar]
- 14.Behrens A, Jochum W, Sibilia M, Wagner EF. Oncogene. 2000;19:2657. doi: 10.1038/sj.onc.1203603. [DOI] [PubMed] [Google Scholar]
- 15.Jiang D, Moxley RA, Jarrett HW. J. Chromatogr A. 2006;1133:83. doi: 10.1016/j.chroma.2006.08.001. [DOI] [PubMed] [Google Scholar]
- 16.Samuel S, Twizere JC, Bernstein LR. Biochem J. 2005;388:921. doi: 10.1042/BJ20041497. [DOI] [PMC free article] [PubMed] [Google Scholar]
- 17.Gadgil H, Taylor WL, Jarrett HW. J. Chromatogr A. 2001;917:43. doi: 10.1016/s0021-9673(01)00647-1. [DOI] [PubMed] [Google Scholar]
- 18.Gadgil H, Jarrett HW. J. Chromatogr A. 1999;848:131. doi: 10.1016/s0021-9673(99)00338-6. [DOI] [PubMed] [Google Scholar]
- 19.Robinson FD, Gadgil H, Jarrett HW. J. Chromatogr A. 1999;849:403. doi: 10.1016/s0021-9673(99)00586-5. [DOI] [PubMed] [Google Scholar]
- 20.Rozek D, Pfeifer G. J Cell Biochem. 1995;57:479. doi: 10.1002/jcb.240570313. [DOI] [PubMed] [Google Scholar]
- 21.Siu FK, Lee LT, Chow BK. Nat Protoc. 2008;3:51. doi: 10.1038/nprot.2007.492. [DOI] [PubMed] [Google Scholar]
- 22.Fried M, Crothers DM. Nucleic Acids Res. 1981;9:6505. doi: 10.1093/nar/9.23.6505. [DOI] [PMC free article] [PubMed] [Google Scholar]
- 23.Garner MM, Revzin A. Nucleic Acids Res. 1981;9:3047. doi: 10.1093/nar/9.13.3047. [DOI] [PMC free article] [PubMed] [Google Scholar]
- 24.Hendrickson WA, Horton JR, Murthy HM, Pahler A, Smith JL. Basic Life Sci. 1989;51:317. doi: 10.1007/978-1-4684-8041-2_28. [DOI] [PubMed] [Google Scholar]
- 25.Yang VW. J Nutr. 1998;128:2045. doi: 10.1093/jn/128.11.2045. [DOI] [PubMed] [Google Scholar]
- 26.Crothers DM, Gartenberg MR, Shrader TE. Methods Enzymol. 1991;208:118. doi: 10.1016/0076-6879(91)08011-6. [DOI] [PubMed] [Google Scholar]
- 27.Fried MG. Electrophoresis. 1989;10:366. doi: 10.1002/elps.1150100515. [DOI] [PubMed] [Google Scholar]
- 28.Hellman LM, Fried MG. Nat Protoc. 2007;2:1849. doi: 10.1038/nprot.2007.249. [DOI] [PMC free article] [PubMed] [Google Scholar]
- 29.Bowen B, Steinberg J, Laemmli UK, Weintraub H. Nucleic Acids Res. 1980;8:1. doi: 10.1093/nar/8.1.1. [DOI] [PMC free article] [PubMed] [Google Scholar]
- 30.Ohri S, Sharma D, Dixit A. Eur J Biochem. 2004;271:4892. doi: 10.1111/j.1432-1033.2004.04458.x. [DOI] [PubMed] [Google Scholar]
- 31.Labbe S, Stewart G, LaRochelle O, Poirier GG, Seguin C. Methods Mol Biol. 2001;148:255. doi: 10.1385/1-59259-208-2:255. [DOI] [PubMed] [Google Scholar]
- 32.Wieczorek E, Lin Z, Perkins EB, Law DJ, Merchant JL, Zehner ZE. J Biol Chem. 2000;275:12879. doi: 10.1074/jbc.275.17.12879. [DOI] [PubMed] [Google Scholar]
- 33.O'Farrell PH. J Biol Chem. 1975;250:4007. [PMC free article] [PubMed] [Google Scholar]
- 34.Jiang D, Jia Y, Zhou Y, Jarrett HW. J Proteome Res. 2009 doi: 10.1021/pr900214p. In press. [DOI] [PMC free article] [PubMed] [Google Scholar]
- 35.Molnar NOLG, Pardee AB, Bradley DW. Nucleic Acids Res. 1995;23:3318. doi: 10.1093/nar/23.16.3318. [DOI] [PMC free article] [PubMed] [Google Scholar]
- 36.Nelson JD, Denisenko O, Sova P, Bomsztyk K. Nucleic Acids Res. 2006;34:e2. doi: 10.1093/nar/gnj004. [DOI] [PMC free article] [PubMed] [Google Scholar]
- 37.Kadonaga JT. Methods Enzymol. 1991;208:10. doi: 10.1016/0076-6879(91)08004-2. [DOI] [PubMed] [Google Scholar]
- 38.Gadgil H, Oak SA, Jarrett HW. J. Biochem. Biophys Methods. 2001;49:607. doi: 10.1016/s0165-022x(01)00223-8. [DOI] [PubMed] [Google Scholar]
- 39.Kadonaga JT, Tjian R. Proc Natl. Acad Sci U.S.A. 1986;83:5889. doi: 10.1073/pnas.83.16.5889. [DOI] [PMC free article] [PubMed] [Google Scholar]
- 40.Kerrigan LA, Kadonaga JT. Chapter 9. Curr Protoc Protein Sci. 2001 doi: 10.1002/0471140864.ps0906s11. Unit 9 6. [DOI] [PubMed] [Google Scholar]
- 41.Gadgil H, Taylor WL, Jarrett HW. J Chromatogr A. 2001;917:43. doi: 10.1016/s0021-9673(01)00647-1. [DOI] [PubMed] [Google Scholar]
- 42.Jarrett HW, Foster JL. J Biol Chem. 1995;270:5578. doi: 10.1074/jbc.270.10.5578. [DOI] [PubMed] [Google Scholar]
- 43.Franza BR, Jr., Josephs SF, Gilman MZ, Ryan W, Clarkson B. Nature. 1987;330:391. doi: 10.1038/330391a0. [DOI] [PubMed] [Google Scholar]
- 44.Woo AJ, Dods JS, Susanto E, Ulgiati D, Abraham LJ. Mol Cell Proteomics. 2002;1:472. doi: 10.1074/mcp.t200003-mcp200. [DOI] [PubMed] [Google Scholar]
- 45.Stead JA, Keen JN, McDowall KJ. Mol Cell Proteomics. 2006;5:1697. doi: 10.1074/mcp.T600027-MCP200. [DOI] [PubMed] [Google Scholar]
- 46.Stead JA, McDowall KJ. Nat Protoc. 2007;2:1839. doi: 10.1038/nprot.2007.248. [DOI] [PubMed] [Google Scholar]
- 47.Grosveld F, Rodriguez P, Meier N, Krpic S, Pourfarzad F, Papadopoulos P, Kolodziej K, Patrinos GP, Hostert A, Strouboulis J. Ann N Y Acad Sci. 2005;1054:55. doi: 10.1196/annals.1345.008. [DOI] [PubMed] [Google Scholar]
- 48.Sebastiaan Winkler G, Lacomis L, Philip J, Erdjument-Bromage H, Svejstrup JQ, Tempst P. Methods. 2002;26:260. doi: 10.1016/S1046-2023(02)00030-0. [DOI] [PubMed] [Google Scholar]
- 49.Shevchenko A, Wilm M, Vorm O, Mann M. Anal Chem. 1996;68:850. doi: 10.1021/ac950914h. [DOI] [PubMed] [Google Scholar]
- 50.Jin LT, Hwang SY, Yoo GS, Choi JK. Proteomics. 2006;6:2334. doi: 10.1002/pmic.200500596. [DOI] [PubMed] [Google Scholar]
- 51.Jonsson AP, Aissouni Y, Palmberg C, Percipalle P, Nordling E, Daneholt B, Jornvall H, Bergman T. Anal Chem. 2001;73:5370. doi: 10.1021/ac010486h. [DOI] [PubMed] [Google Scholar]
- 52.Liang X, Bai J, Liu YH, Lubman DM. Anal Chem. 1996;68:1012. doi: 10.1021/ac950685z. [DOI] [PubMed] [Google Scholar]
- 53.Luque-Garcia JL, Zhou G, Spellman DS, Sun TT, Neubert TA. Mol Cell Proteomics. 2008;7:308. doi: 10.1074/mcp.M700415-MCP200. [DOI] [PMC free article] [PubMed] [Google Scholar]
- 54.Luque-Garcia JL, Zhou G, Sun TT, Neubert TA. Anal Chem. 2006;78:5102. doi: 10.1021/ac060344t. [DOI] [PMC free article] [PubMed] [Google Scholar]
- 55.Methogo RM, Dufresne-Martin G, Leclerc P, Leduc R, Klarskov K. J Proteome Res. 2005;4:2216. doi: 10.1021/pr050014+. [DOI] [PubMed] [Google Scholar]
- 56.Nakanishi T, Ando E, Furuta M, Tsunasawa S, Nishimura O. J Chromatogr B. 2007;847:24. doi: 10.1016/j.jchromb.2006.08.024. [DOI] [PubMed] [Google Scholar]
- 57.Labugger R, Simpson JA, Quick M, Brown HA, Collier CE, Neverova I, Van Eyk JE. Clin Chem. 2003;49:873. doi: 10.1373/49.6.873. C.C.J.P. 1):873-9. [DOI] [PubMed] [Google Scholar]
- 58.Yaneva M, Tempst P. Anal Chem. 2003;75:6437. doi: 10.1021/ac034698l. [DOI] [PubMed] [Google Scholar]