Abstract
We describe depth-resolved microscopy of cortical hemodynamics with high-speed spectral/Fourier domain optical coherence tomography (OCT). Stimulus-evoked changes in blood vessel diameter, flow, and total hemoglobin were measured in the rat somatosensory cortex. The results show OCT measurements of hemodynamic changes during functional activation and represent an important step toward understanding functional hyperemia at the microscopic level.
Optical microscopy has been used to investigate the metabolic and hemodynamic responses to brain activation [1,2]. Optical methods can measure relative changes in cerebral blood flow, cerebral blood volume, and blood oxygenation with high spatiotemporal resolution. Optical intrinsic signal imaging (OISI) can provide highly sensitive measures of blood volume and oxygenation changes [3] but does not enable depth resolution. Scanning laser-Doppler [4] and laser speckle [5] imaging have been investigated for measurements of cerebral blood flow but cannot perform depth-resolved measurements. Two-photon microscopy [6] enables measurements of capillary flow and diameter, but measurements of high velocities or simultaneous measurements at multiple cortical depths are challenging. Therefore an imaging tool that provides microscopic, depth-resolved, cross-sectional imaging during functional activation would aid in investigating the hemodynamic response.
Optical coherence tomography (OCT) has shown potential as a tool for studying the functional response to neuronal activation. OCT has been used to measure signal changes related to functional activation [7,8]. However, these changes were indirectly related to changes in blood flow and volume and are therefore difficult to interpret. Recently, high-speed spectral/Fourier domain OCT was used to visualize blood flow in cortical vessels [9]. In this Letter, we apply spectral/Fourier domain OCT to directly perform depth-resolved measurements of blood vessel diameter, blood flow, and total hemoglobin in the brain during functional activation.
Animal protocols were approved by the animal care committee at the Massachusetts General Hospital. Rats were prepared with cranial windows [10]. Imaging was performed during forepaw stimulation (300-µs-wide pulses; 3 Hz repetition rate; 4 s pulse train duration, 20 s stimulation sequence period; 0.5 mA–1.5 mA pulse amplitude) while rats were under alpha-chloralose anesthesia and immobilized stereotactically. Rats were first imaged during forepaw stimulation using OISI to determine the response area and to confirm physiological stability of the animal. For OISI, an Hg:Xe lamp illumination was spectrally filtered to a narrow band (±5 nm) at 570 nm, an isosbestic point for hemoglobin absorption. Therefore a decrease in cortical reflectivity at 570 nm corresponds mostly to an increase in total hemoglobin.
A spectral/Fourier-domain OCT microscope was constructed for in vivo imaging of the rat cerebral cortex. The light source consisted of a Ti:sapphire laser (Mai Tai, Spectra Physics) operating at ~830 nm and spectrally broadened in a nonlinear fiber (UHNA3 manufactured by Nufern, distributed by Thorlabs). The axial (depth) resolution was approximately 5.0 µm in air (3.7 µm in tissue). The power on the sample was 15 mW, and the sensitivity was 110 dB. A home-built spectrometer using a 2048 pixel, 12 bit line scan camera (Aviiva SM2 camera, e2v semiconductors) enabled an imaging speed of 22,000 axial scans per second and an axial imaging range of 2.5 mm in air. The galvanometer mirrors (Cambridge Technology, Inc.) were relay imaged onto the back focal plane of a microscope objective (Olympus XLUMPLFL20XW/IR-SP, 20×, 0.95 NA, 1.9 mm working distance). The transverse resolution was ~11 µm. OCT cross-sectional images were acquired repeatedly across 2 mm of cortical tissue at either 2800 axial scans per image (Fig. 1) or 4100 axial scans per image (Fig. 2 and Fig. 3). Thirty trials of contralateral forepaw stimulation were performed. OCT imaging was performed within 20 min of OISI imaging using a separate microscope.
Fig. 1.
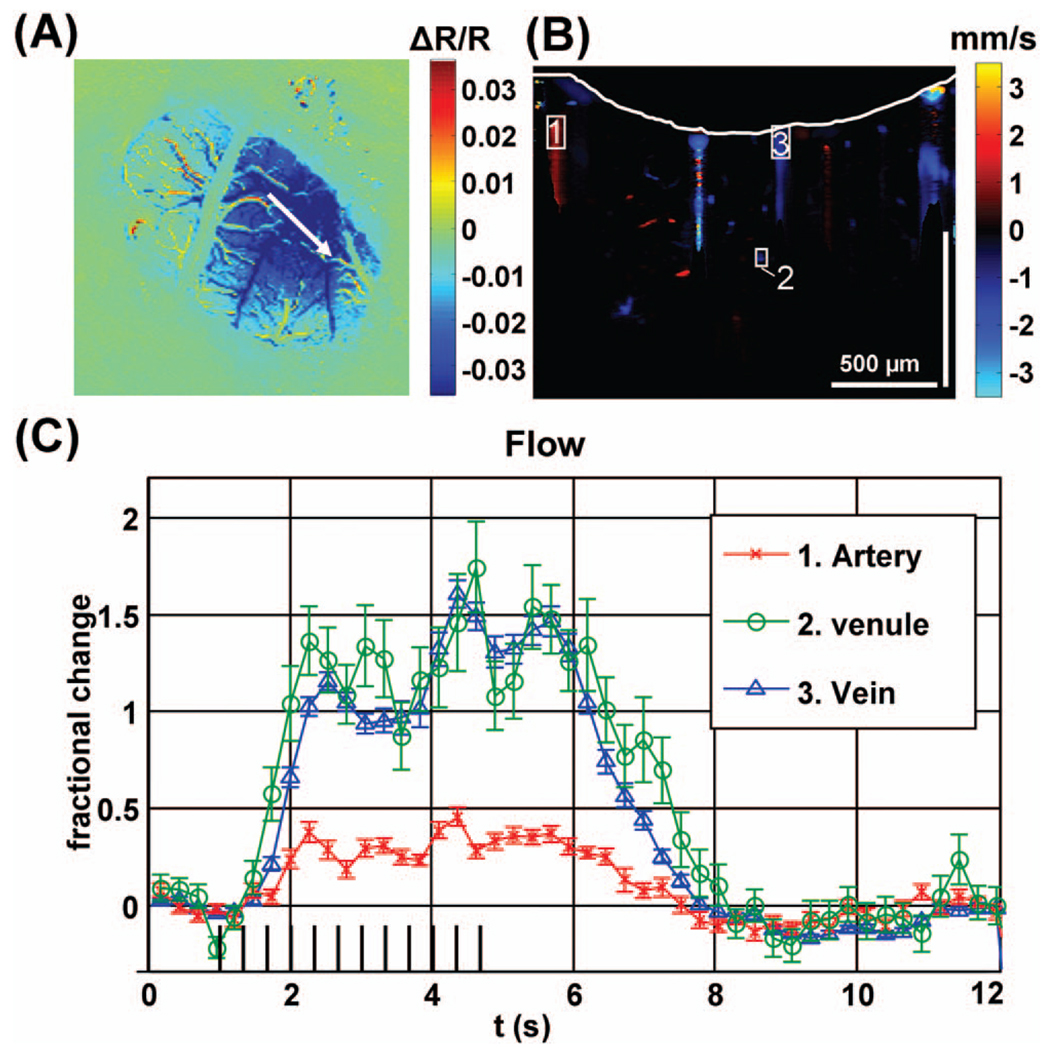
(A) Differential OISI image at peak activation, (B) Doppler OCT image at baseline with cortical surface indicated by a white line, (C) Doppler OCT flow changes over selected regions of interest.
Fig. 2.
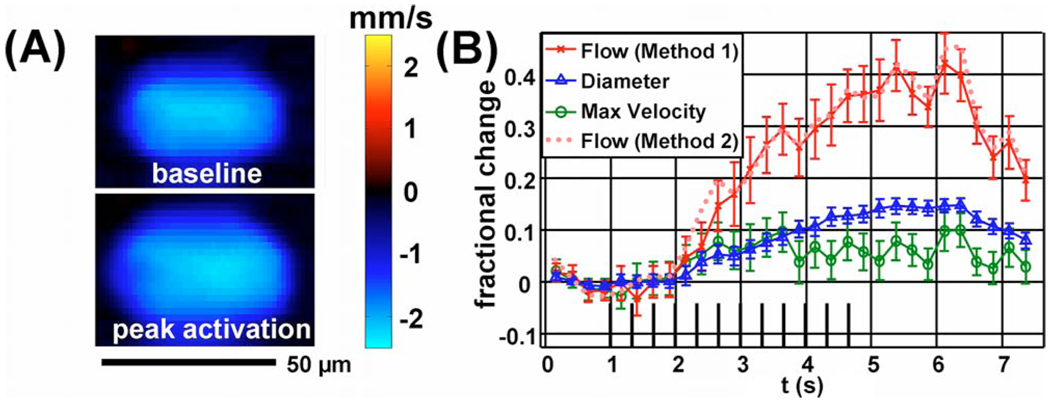
(Color online) (A) Doppler OCT velocity image of an arteriole at baseline (above) and during peak activation (below). (B) Relative flow, velocity, and diameter time courses.
Fig. 3.
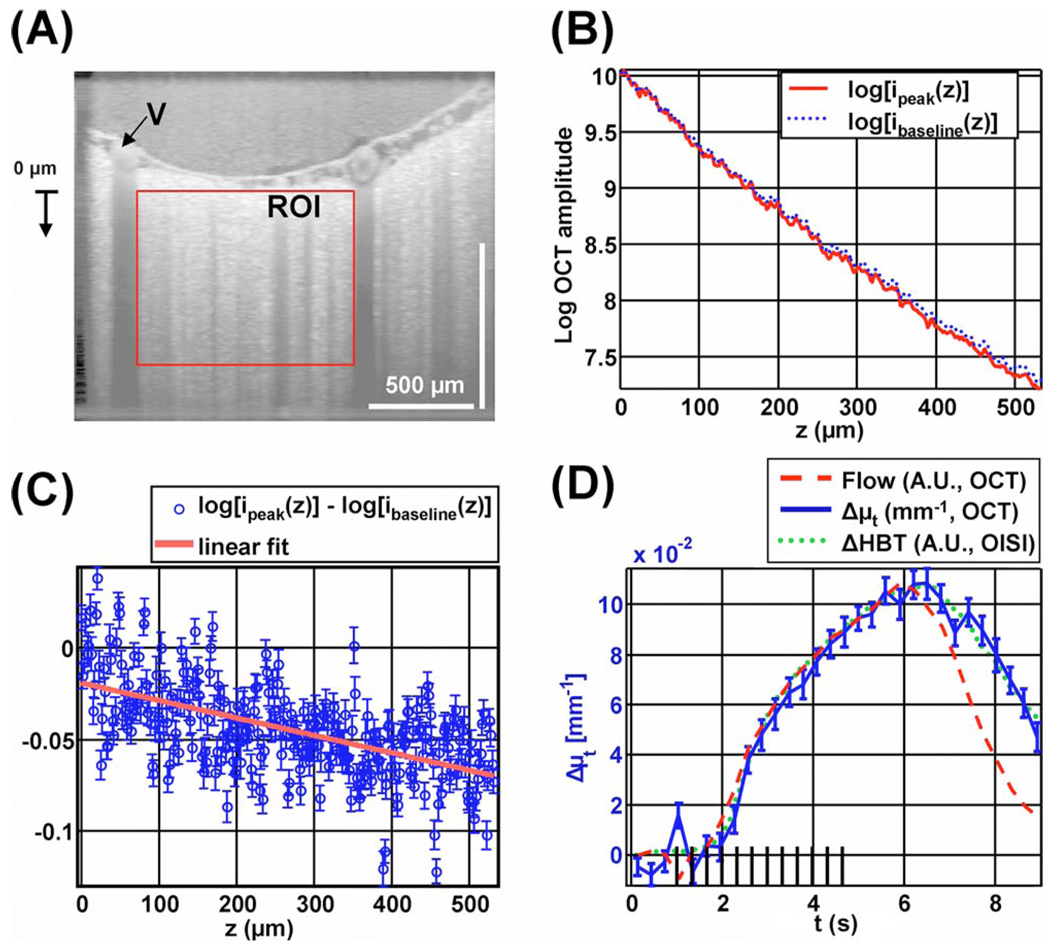
(Color online) Extinction coefficient change measured by OCT shows a time course that resembles total hemoglobin. (A) OCT amplitude image on a logarithmic scale, showing a region of interest (ROI) in a capillary bed, and a draining vein (V) near the region of interest. (B) Profile of the natural logarithm of OCT amplitude versus depth, before the stimulus (dotted line) and during peak activation (solid line). (C) Profile of difference between peak activation and baseline, with standard errors and linear fit. (D) Time courses of Δµt measured by OCT (solid curve), flow in the draining vein measured by OCT (dashed curve), and ΔHbT measured by OISI (dotted curve).
Before Doppler OCT analysis, a digital temporal high-pass filter was applied to the complex OCT data. High-pass filtering to remove stationary clutter improves the accuracy of velocity profile estimates [11]. For this study, high-pass filtering enabled visualization of deeper vessels by reducing signal from the vessel wall, multiple scattering from stationary structures, and low-frequency fluctuations in the light source. The complex temporal autocorrelation function was estimated at multiple time delays using an 8 µm × 8 µm window at every position. The autocorrelation function estimate was subsequently corrected by subtracting the noise autocorrelation function, which was determined by the noise variance and high-pass filter. Finally, a weighted least-squares fit was performed to determine the phase slope of the autocorrelation function, accounting for noise heteroskedasticity and autocorrelation. This fitting procedure is an extension of the Kasai autocorrelation [12].
Figure 1(A) shows a colormap of the OISI change in reflectance at 570 nm during peak activation normalized to baseline. The OCT scan is shown as a white arrow. Figure 1(B) shows the Doppler OCT image, computed by performing a complex summation over all baseline images, converting phase slope to velocity, and thresholding the resulting image based on the OCT amplitude image. The Doppler OCT image shows the locations of blood vessels up to a depth of greater than 500 µm. Artifacts are evident below large vessels as a result of multiple scattering and sidelobes from the point-spread function. Figure 1(C) shows relative flow changes in an artery, a vein, and a venule. Doppler OCT axial velocities were summed over the ROIs shown in Figure 1(B), yielding flow axial projections. Relative changes in velocity and flow were assumed to be equal to relative changes in their respective axial projections. The artery shows a smaller response and a larger relative undershoot, because it is further from the center of activation [10].
Figure 2(A) shows a Doppler OCT image of an arteriole at baseline (0–1 s) and during peak activation (4–6 s). A complex summation at each position over all relevant time points and trials was performed before phase slope was converted to velocity. Both changes in velocity and cross-sectional area are evident. Figure 2(B) shows measurements of flow (F), diameter (d), and maximum velocity during functional activation. The diameter was calculated as the FWHM of the velocity profile. The flow and maximum velocity show significant covariance and have a higher variance than the diameter measurements. The relative flow change calculated directly by spatial summation over an ROI containing the vessel (method 1) agrees with the relative flow change obtained from the relative changes in maximum velocity and diameter (method 2). The peak change in velocity is approximately 10%, while the peak change in diameter is 15% and the peak change in flow is 40%. Separation of flow, velocity, and diameter changes based on the velocity profile is possible in large vessels. However, this method fails to provide accurate measurements in capillaries. In vessels of intermediate diameter where the velocity profile varies significantly on the scale of the resolution, the effects of integration over the resolution voxel as well as the frequency weighting introduced by digital high-pass filtering and CCD camera low-pass filtering must be accounted for in order to yield accurate measures of flow, velocity, and diameter.
Figure 3 shows imaging of total hemoglobin concentration by measuring the change in extinction coefficient caused by functional activation. Figure 3(A) shows an OCT image with a region of interest around a capillary bed, and a draining vein (V) near the region of interest. Figure 3(B) shows the natural logarithm of the transversally averaged OCT signal as a function of depth during baseline (0–1 s) and peak activation (5–7 s) over this region of interest. The time range for peak activation was chosen based on the OISI measurements. Assuming single scattering, the OCT signal profile i(z, t) is determined by the time-dependent extinction coefficient µt(t), time-dependent backscattering A(t), focusing of the OCT beam [13], and the sensitivity rolloff of the spectrometer [14]. The focusing of the beam and the spectrometer roll-off function are represented as multiplicative factors hconfocal(z) and hspectrometer(z), respectively: i(z, t)=hconfocal(z) hspectrometer(z)A(t) exp[−µt(t)z]. By taking the natural logarithm of this expression and subtracting off the baseline profile, log [i(z, t)] − log [ibaseline(z)] = log [A(t)] − log [Abaseline]−[µt(t)−µt,baseline] z=log[A(t) /Abaseline]−Δµt(t)z. The left-hand side of this expression is plotted at peak activation with standard errors, computed across trials, in Fig. 3(C). A least-squares fit was performed to determine Δµt(t). Thus the change in the extinction coefficient was computed independently of focusing or the spectrometer roll-off. In Fig. 3(C), the standard errors are depth independent, although the number of detected photons decreases with depth. This suggests that the dominant source of noise is physiologic motion and speckle and not photon noise. Therefore a 3D OCT raster scan protocol to reduce speckle [15] will improve estimates of extinction coefficients.
Figure 3(D) shows the change in the extinction coefficient as a function of time with the OISI total hemoglobin change ΔHBT and the OCT flow in a vein [labeled in Fig. 3(A)]. Both the ΔHBT signal and the OCT flow signal are scaled to match the peak of the Δµt signal. The ΔHBT and Δµt time course shapes are virtually identical. By contrast, the flow response shows a faster return to baseline than both the ΔHBT and the Δµt responses. The increase in extinction coefficient is consistent with an increase in scattering resulting from a higher red-blood-cell concentration.
Measurements for these experiments were performed with a supercontinuum generated by a normal dispersion high-NA fiber. While self-phase modulation is expected to generate a smooth spectrum with very little noise, temporal fluctuations in the spectrum limited the dynamic range. Therefore future studies will use a more stable superluminescent diode. Finally, the range of measurable velocities before phase wrapping occurred in our system was −3.6 mm/s to 3.6 mm/s. We observed aliasing frequently in pial arteries where the velocity was high and in diving arterioles where the angle between the flow and the probe beam was high. Faster spectrometer systems with speeds of 50,000–75,000 axial scans per second will eliminate most phase-wrapping artifacts.
To our knowledge, these results represent the first direct measurements of evoked hemodynamic changes due to functional activation with OCT. These results may help to elucidate the hemodynamic component of the functional response that is responsible for the BOLD (blood oxygen level-dependant) magnetic resonance imaging (MRI) signal, thereby enabling more quantitative interpretation of functional MRI. In addition, measurements of blood flow are important for quantitative measurements of oxygen delivery and therefore oxygen consumption. Similar methods may be applied in the retina or other organ systems to measure stimulus-induced changes in blood flow.
Acknowledgments
We acknowledge support by the National Institutes of Health (NIH) (R01-NS057476, P01NS055104, P50NS010828, K99NS067050, and R01-CA075289-12) the Air Force Office of Scientific Research (AFOSR) FA9550-07-1-0014 and the Medical Free-Electron Laser Program FA9550-07-1-0101.
Footnotes
OCIS codes: 110.4500, 170.3880, 170.5380, 170.1470.
References
- 1.Grinvald A, Frostig RD, Lieke E, Hildesheim R. Physiol. Rev. 1988;68:1285. doi: 10.1152/physrev.1988.68.4.1285. [DOI] [PubMed] [Google Scholar]
- 2.Villringer A, Chance B. Trends Neurosci. 1997;20:435. doi: 10.1016/s0166-2236(97)01132-6. [DOI] [PubMed] [Google Scholar]
- 3.Tso DY, Frostig RD, Lieke EE, Grinvald A. Science. 1990;249:417. doi: 10.1126/science.2165630. [DOI] [PubMed] [Google Scholar]
- 4.Ances BM, Greenberg JH, Detre JA. Neuroimage. 1999;10:716. doi: 10.1006/nimg.1999.0510. [DOI] [PubMed] [Google Scholar]
- 5.Fercher AF, Briers JD. Opt. Commun. 1981;37:326. [Google Scholar]
- 6.Kleinfeld D, Mitra PP, Helmchen F, Denk W. Proc. Natl. Acad. Sci. USA. 1998;95:15741. doi: 10.1073/pnas.95.26.15741. [DOI] [PMC free article] [PubMed] [Google Scholar]
- 7.Maheswari RU, Takaoka H, Kadono H, Homma R, Tanifuji M. J. Neurosci. Methods. 2003;124:83. doi: 10.1016/s0165-0270(02)00370-9. [DOI] [PubMed] [Google Scholar]
- 8.Chen Y, Aguirre AD, Ruvinskaya L, Devor A, Boas DA, Fujimoto JG. J. Neurosci. Methods. 2008;178:162. doi: 10.1016/j.jneumeth.2008.11.026. [DOI] [PMC free article] [PubMed] [Google Scholar]
- 9.Wang RK, Jacques SL, Ma Z, Hurst S, Hanson SR, Gruber A. Opt. Express. 2007;15:4083. doi: 10.1364/oe.15.004083. [DOI] [PubMed] [Google Scholar]
- 10.Devor A, Tian P, Nishimura N, Teng IC, Hillman EM, Narayanan SN, Ulbert I, Boas DA, Kleinfeld D, Dale AM. J. Neurosci. 2007;27:4452. doi: 10.1523/JNEUROSCI.0134-07.2007. [DOI] [PMC free article] [PubMed] [Google Scholar]
- 11.Ren H, Sun T, MacDonald DJ, Cobb MJ, Li X. Opt. Lett. 2006;31:927. doi: 10.1364/ol.31.000927. [DOI] [PubMed] [Google Scholar]
- 12.Kasai C, Namekawa K, Koyano A, Omoto R. IEEE Trans. Sonics Ultrason. 1985;32:458. [Google Scholar]
- 13.Faber DJ, van der Meer FJ, Aalders MCG. Opt. Express. 2004;12:4353. doi: 10.1364/opex.12.004353. [DOI] [PubMed] [Google Scholar]
- 14.Leitgeb R, Hitzenberger CK, Fercher AF. Opt. Express. 2003;11:889. doi: 10.1364/oe.11.000889. [DOI] [PubMed] [Google Scholar]
- 15.Srinivasan VJ, Wojtkowski M, Fujimoto JG, Duker JS. Opt. Lett. 2006;31:2308. doi: 10.1364/ol.31.002308. [DOI] [PubMed] [Google Scholar]


