Abstract
Des-N-methylleucyl-4-(4-fluorophenyl)benzyl-vancomycin (DFPBV) retains activity against vancomycin-resistant pathogens despite its damaged D-Ala-D-Ala binding cleft. Using solid-state NMR, a DFPBV binding site in the cell walls of whole cells of S. aureus has been identified. The cell walls were labeled with D-[1-13C]alanine, [1-13C]glycine, and L-[ε-15N]lysine. Internuclear distances from 19F of the DFPBV to the 13C and 15N labels of the cell-wall peptidoglycan were determined by rotational-echo double resonance (REDOR) NMR. The 13C{19F} and 15N{19F} REDOR spectra show that in situ, DFPBV binds to the peptidoglycan as a monomer with its vancosamine hydrophobic sidechain positioned near a pentaglycyl bridge. This result suggests that the antimicrobial activity of other vancosamine-modified glycopeptides depends on both D-Ala-D-Ala stem-terminus recognition (primary binding site) and stem-bridge recognition (secondary binding site).
Keywords: Chlorobiphenyl vancomycin, dipolar coupling, glycopeptide antibiotic, lipoglycopeptide, magic-angle spinning, oritavancin, peptidoglycan, rotational-echo double resonance, solid-state NMR, transglycosylase
It is generally believed that many glycopeptide antibiotics including vancomycin inhibit peptidoglycan biosynthesis in Gram-positive bacteria by binding to the D-Ala-D-Ala terminus of the peptidoglycan precursor lipid II, N-acetylglucosamine-N-acetyl-muramyl-pentapeptide-pyrophosphoryl-undecaprenol. Vancomycin binding to lipid II inhibits transglycosylase activity and prevents the regeneration of lipid transporter C55, pyrophosphoryl-undecaprenol, which is only released upon the completion of the transglycosylation step. Because C55 is present in only a small number of copies per bacterium (1), vancomycin binding to lipid II is an effective means of sequestering C55 and thus preventing the transportation of peptidoglycan precursors to the membrane exoface for cell-wall biosynthesis.
Because the D-Ala-D-Ala stem terminus is highly conserved in bacteria, vancomycin is active against a broad spectrum of Gram-positive pathogens, including methicillin-resistant S. aureus (MRSA). With the increasing frequency of MRSA infections, vancomycin usage became routine and the emergence of vancomycin-resistant pathogens soon followed. The first clinical isolate of a vancomycin-resistant pathogen appeared in 1986 (2). Vancomycin-resistant enterococci (VRE) are now more than 25% of all clinical enterococcal isolates (3). In 2002, the first case of vancomycin-resistant S. aureus (VRSA) was reported with a vancomycin minimum inhibitory concentration (MIC) that was greater than 128 µg/ml (4). This VRSA strain was also resistant to ciprofloxacin, clindamycin, erythromycin, gentamicin, and methicillin, drugs representing five different classes of antibiotics. Vancomycin resistance in VRE and VRSA both result from replacement of the D-Ala-D-Ala peptidoglycan stem terminus by D-Ala-D-Lac, which reduces vancomycin binding affinity by three orders of magnitude (5).
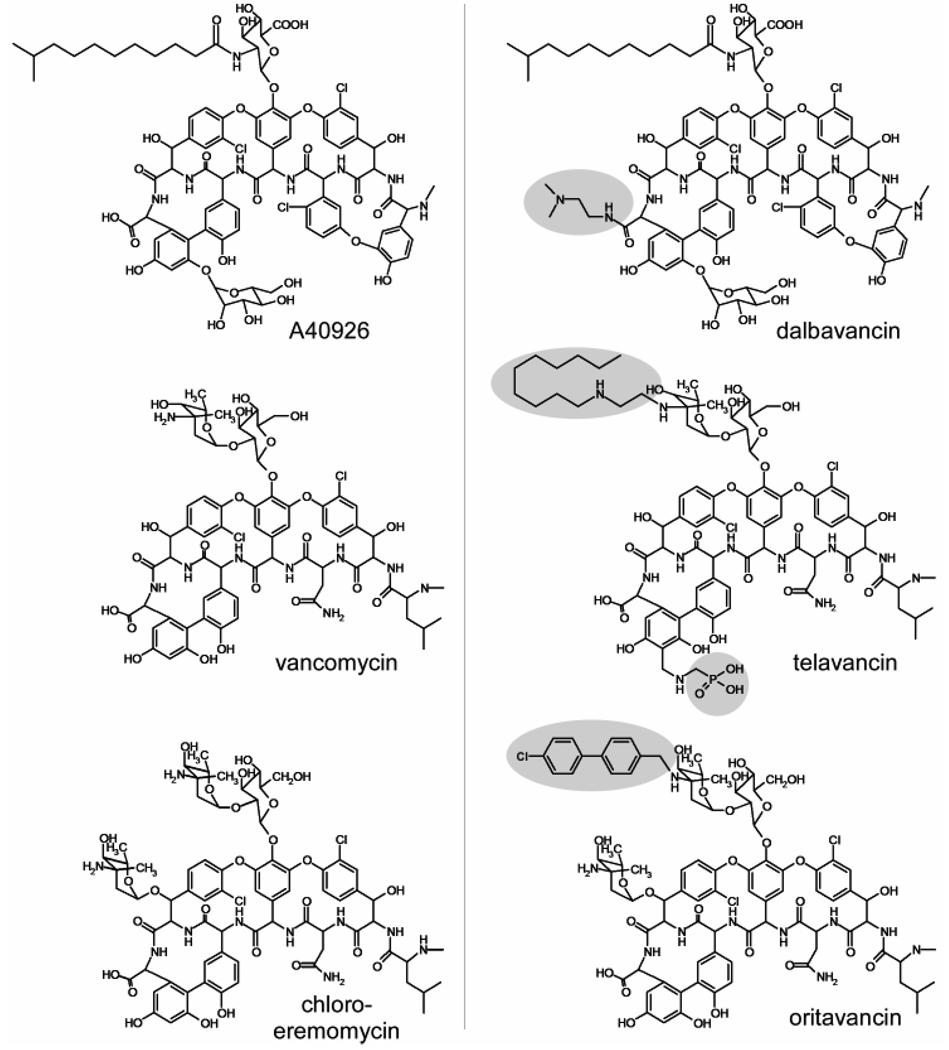
To improve glycopeptide activity against vancomycin-resistant pathogens, numerous semi-synthetic glycopeptides have been made and tested. Currently there are three such glycopeptides in Phase III clinical trials (6): dalbavancin (Pfizer, USA), telavancin (Theravance Inc., USA), and oritavancin (Targanta Therapeutics Inc., Canada). The chemical structures of these glycopeptides and their parent compounds are shown in Figure 1. All of these second-generation glycopeptides exhibit concentration-dependent rapid bactericidal activity (6), a clear departure from the bacteriostatic activity of vancomycin, and all have enhancements in antimicrobial activity of two to three orders of magnitude relative to the activities of their parent compounds.
Figure 1.
Chemical structures of some second-generation glycopeptides antibiotics (right) and their parent compounds (left). Synthetic modifications of the second-generation glycopeptides are highlighted.
A common structural motif in second-generation glycopeptides is a hydrophobic sidechain substituent at the amine sugar which is attached to the phenolic-hydroxyl group of the fourth amino acid of the aglycon structure. Because these hydrophobic sidechains are positioned on the periphery of the drug, away from the D-Ala-D-Ala binding cleft, the sidechains do not improve the in vitro binding of glycopeptides to peptidoglycan stem mimics. For example, the binding affinity of telavancin and oritavancin to the tripeptide L-Lys-D-Ala-D-Lac shows no improvement relative to that of the parent compounds (7, 8). This observation has led to the suggestion that hydrophobic side chains might mediate the formation of drug dimers, or act as membrane anchors, either one of which could compensate for weak binding to D-Ala-D-Lac (9). However so far, dimers and membrane anchors have not been found in intact cell-wall and whole-cell oritavancin binding experiments (10, 11).
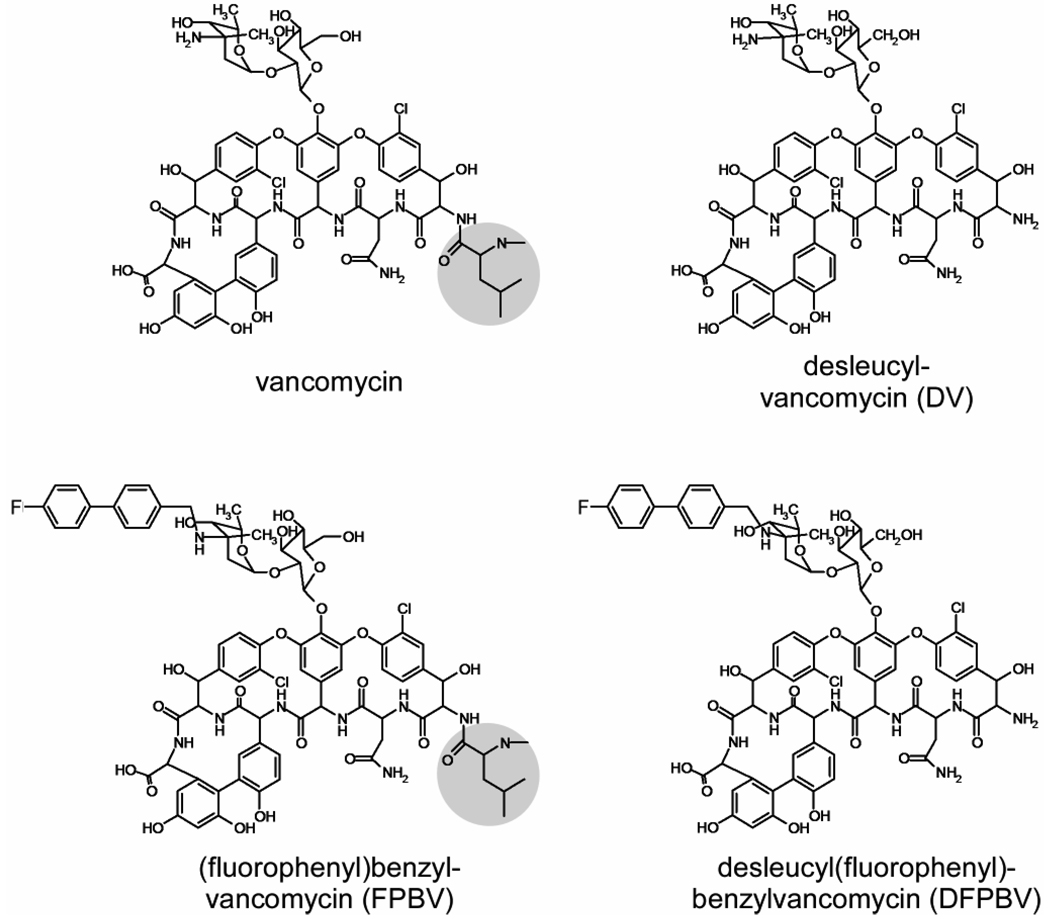
Oritavancin has also been inferred to target directly membrane proteins associated with cell-wall biosynthesis (12). This proposal is based on the comparison of the antimicrobial activities of N-4-(4-chlorophenyl)benzyl-vancomycin (CPBV) and its Edman degradation product, des-N-methylleucyl-4-(4-chlorophenyl)benzyl-vancomycin (DCPBV). The Edman degradation removes the N-methylleucine from the aglycon structure (Figure 2) resulting in a hexapeptide with a damaged D-Ala-D-Ala binding cleft. The binding affinities of DCPBV and des-N-methylleucyl-vancomycin (DV, Figure 2) to the tripeptide L-Lys-D-Ala-D-Ala in vitro are several orders of magnitude less than those of their parent compounds (13). Although both vancomycin and CPBV have similar potent antimicrobial activity against wild-type S. aureus, DV has no antimicrobial activity against vancomycin-susceptible and vancomycin-resistant bacteria while DCPBV is highly active against both (14). The fact that DCPBV is unable to bind to D-Ala-D-Ala but is still active has led to the proposal that its activity is due to binding to and interference with, one of the enzymes of cell-wall assembly, transglycosylase (15–17).
Figure 2.
Chemical structures of vancomycin and N-4-(4-fluorophenyl)benzyl-vancomycin (left) and their corresponding Edman degradation products (right). Terminal leucyl residues are highlighted.
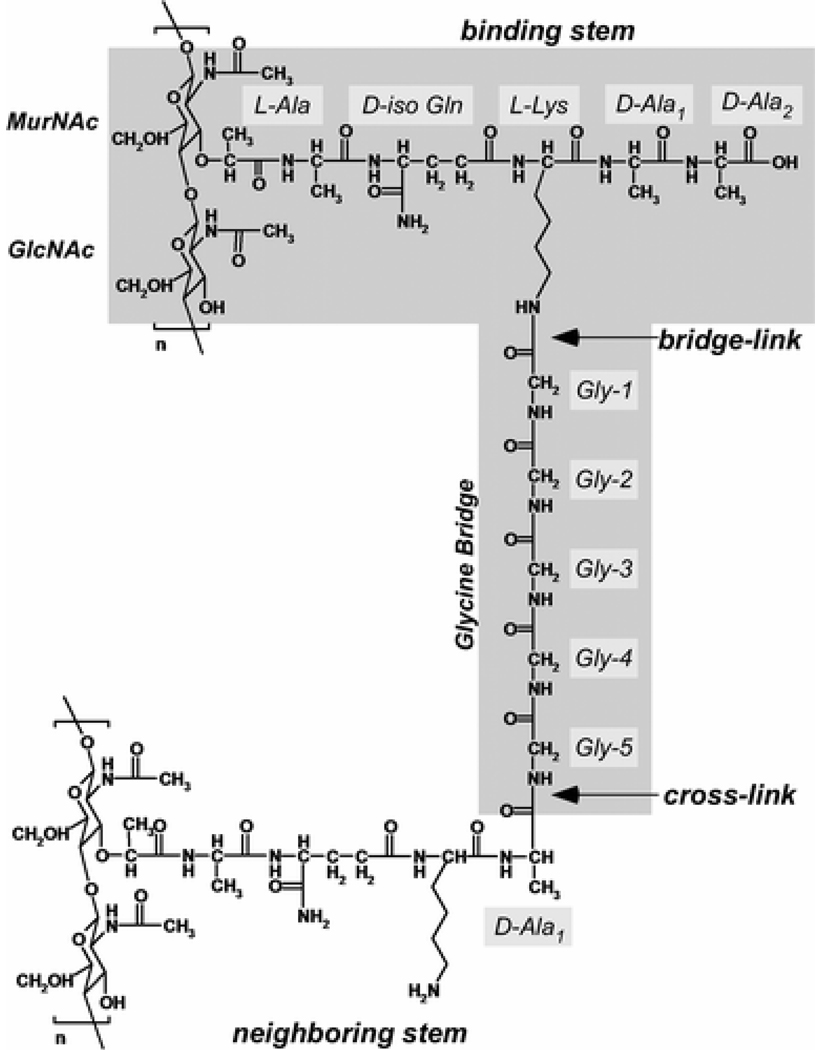
Our aim in this report is to examine the underlying assumption that DCPBV with a damaged D-Ala-D-Ala binding cleft does not bind to peptidoglycan in vivo. To accomplish this goal, we synthesized the fluorinated analogue of DCPBV, des-N-methylleucyl-4-(4-fluorophenyl)benzyl-vancomycin (DFPBV, Figure 2), and formed complexes with whole cells of S. aureus grown in defined media containing D-[1-13C]alanine, or [1-13C]glycine and L-[ε-15N]lysine. The labels were incorporated in peptidoglycan cross-links, pentaglycyl bridges, and bridge-links, key locations in the cell-wall structure of S. aureus (Figure 3). The fluorine in place of chlorine in DFPBV does not alter the antimicrobial activity of the glycopeptide but permits the use of rotational-echo double resonance (REDOR) NMR (18) for detection of putative cell-wall binding in situ. The results of the REDOR experiments prove that DFPBV binds to the cell-wall peptidoglycan of S. aureus and is therefore in a position to interfere indirectly with cell-wall biosynthesis (11) without the direct formation of an enzyme complex.
Figure 3.
Chemical structure of the peptidoglycan of S. aureus. The building-block repeat unit is highlighted.
Materials and Methods
Synthesis of 4-(4-fluorophenyl)benzyl-vancomycin
4-(4-fluorophenyl)benzaldehyde was prepared by the Suzuki-Miyaura cross-coupling reaction (19) of 458 mg (1.3 mmol) of 4-fluorophenylboric acid, 607 mg (1.3 mmol) of 4-bromobenzaldehyde and 526 mg of palladium on carbon suspended in a mixture of 28.2 mL of 2-propanol−31% w/v aq. K2CO3 (8:1). The suspension was refluxed under positive pressure of N2 for 2 hours. After cooling to room temperature, the reaction mixture was filtered through cerite and the residue was washed with EtOAc and water. The filtrate was extracted with EtOAc, washed with saturated NH4Cl and dried over Na2SO4. The EtOAc solution was filtered through cotton and the filtrate was evaporated in vacuo to yield 250 mg (96%) of 4-(4-fluorophenyl)benzaldehyde (11).
The N terminus of vancomycin was protected prior to N-alkylation according to the method reported by Preobrazhenskaya et al (20). Briefly, to a stirring solution of vancomycin hydrochloride (500 mg, 336 µmol) in 30 mL of H2O-acetonitrile 1:1 (v/v) adjusted to pH 7 with 0.1 M NaOH, a solution of FmocOSu (169 mg, 500 µmol) in 7 mL of acetonitrile was added dropwise over 2 hours. The reaction mixture was adjusted to pH 7 with 0.1 M NaOH. After stirring for 8 hours, the reaction mixture was evaporated in vacuo with 1-butanol to dryness. The resulting white residue was suspended into 30 mL of water and adjusted to pH 3.5 with 1 M HCl, then extracted with 15 mL of water-saturated 1-butanol three times. The extracts were combined, and evaporated in vacuo with water. To the resulting concentrated solution, 30 mL of acetone was added and left for 6 hours. The precipitated white solid was collected by centrifugation, washed with acetone, and dried to yield 400 mg (68%) of N-Fmoc-vancomycin (21).
N-[4-(4-fluorophenyl)benzyl]vancomycin was synthesized by reacting N-Fmoc-vancomycin (400 mg, 230 µmol) with 4-(4-fluorophenyl)benzaldehyde (105 mg, 525 µmol) in 1.5 mL of DMF stirred for 2 hours at room temperature. Then a solution of NaBH3CN in methanol (10 mg/1 mL) was added to the reaction mixture. After stirring for 12 hours at room temperature, the reaction mixture was transferred into 30 mL of water, adjusted to pH 3.5 with HCl, and then extracted with 15 mL of water-saturated 1-butanol three times. The combined extract was evaporated in vacuo with water. To the concentrated solution, 30 mL of acetone was added and left for 6 hours. The white precipitate was collected by centrifugation, washed with acetone, and dried to yield 380.3 mg (88%) of N-Fmoc-N-[4-(4-fluorophenyl)benzyl]vancomycin (N-Fmoc-FPBV). To 250 mg (133 µmol) of N-Fmoc-FPBV dissolved in 1 mL of DMF, 1 mL of 40% aq. (CH3)2NH was added. After stirring for 30 minutes the reaction mixture was transferred into water, adjusted to pH 3.5 by HCl, and extracted with 1-butanol. The combined extract was evaporated in vacuo with water. To the concentrated solution, 30 mL of acetone was added then left for 6 hours. A white precipitate was collected by centrifugation, washed with acetone, and dried to yield 200 mg of FPBV. Further purification was provided by HPLC to yield 51 mg (23%) of N-[4-(4-fluorophenyl)benzyl]vancomycin (11); HPLC retention time was 25.7 min through 21.4 × 250 mm ODS column (Microsorb C18, Varian, Palo Alto, CA) with 5 mL/min of flow rate linear gradient elution for 30 min starting from acetonitrile buffer containing 2.75 mM triethylamine hydrochloride at pH 3.5 (1:19) and ending at acetonitrile. The ESI-MS calculated mass for N-[4-(4-fluorophenyl)benzyl]vancomycin, C79H86Cl2FN9O24 [M+2H]2+ was 816.75, and the found mass was 816.8.
Synthesis of des-N-methylleucyl-4-(4-fluorophenyl)benzyl-vancomycin
Des-N-methylleucyl-4-(4-fluorophenyl)benzyl-vancomycin (DFPBV) was derived from FPBV according to the method reported by Preobrazhenskaya et al (21). To 12 mg (7.2 µmol) of FPBV dissolved in 300 µL of H2O − pyridine (1:1), 1.3 mg of PhNCS in 30 µL of DMF was added. After stirring for 16 h, and concentrated in vacuo with 1-butanol, the reaction mixture was applied to a 5 mL silanized silica gel column with stepwise gradient elution starting from 0.001 M aq AcOH and ending at MeOH − 0.001 M aq. AcOH (2:8). The final fraction was evaporated in vacuo with 1-butanol and dried to yield 11 mg of N-phenylaminothiocarbonyl-N-[4-(4-fluorophenyl)benzyl]vancomycin. The product was treated with 50 µL of 12 M HCl at 0°C for 60 min. The reaction mixture was neutralized by triethylamine at 0°C and acetone was added to the reaction mixture. The resulting white precipitate was collected by centrifugation, washed with acetone, and dried to yield 11 mg of DFPBV. Further purification was provided by HPLC to yield 10.3 mg (6.8µmol, 95%) of DFPBV; HPLC retention time was 25.5 min through 21.4 × 250 mm ODS column (Microsorb C18, Varian, Palo Alto, CA) with 5 mL/min of flow rate linear gradient elution for 30 min starting from acetonitrile−2.75 mM triethylamine hydrochloride buffer pH 3.5 (1:19) and ending at acetonitrile. The ESI-MS calculated mass for DFPBV, C72H83Cl2FN8O23 [M+2H]2+ was 753.2, and the found mass was 753.2.
Growth and labeling of whole cells and formation of complexes
Starter cultures of S. aureus (ATCC 6538P) were prepared by inoculating a test tube containing 5 ml of trypticase soy broth with a single colony. The tube was maintained at 37 °C, and shaken at 200 rpm in a Environ-Shaker (Lab-Lines Instruments, Inc., Melrose Park, IL). To prepare whole-cell S. aureus samples, the overnight starter culture (1% final volume) was added to one-liter flasks containing 250 to 330 mL of sterile Enhanced Standard Medium (ESM). The ESM is based on SASM described earlier by Tong et al. (22), fortified to allow both staphylococcal and enterococcal growth.
The ESM contained the following on a per liter basis: 10 g of d-glucose; 1 g each of K2HPO4·3H2O, KH2PO4, and (NH4)2SO4; 0.2 g of MgSO4·7H2O; 10 mg each of MnSO4·H2O, FeSO4·H2O, and NaCl; 5 mg each of adenine, cytosine, guanine, uracil, and xanthine; 2 mg each of calcium pantothenate, thiamin hydrochloride, and niacin; 1 mg each of pyridoxine hydrochloride, riboflavin, inositol, CuSO4·5H2O, and ZnSO4·7H2O; 0.1 mg each of biotin and folic acid; and 0.1 g of all 20 common amino acids. The pH of ESM was adjusted to 7.0 prior to sterile filtration. For NMR experiments, the natural-abundance amino acids in ESM were replaced by either [1-13C]glycine and L-[ε-15N]lysine, or D-[1-13C]alanine, to incorporate specific 13C and 15N labels at the pentaglycyl bridge, bridge-link, and cross-link positions in the peptidoglycan of whole-cells of S. aureus (Figure 3).
S. aureus was harvested during log-phase growth by centrifugation at 10,000 g for 10 mins at 4 °C in a Sorvall GS-3 rotor. The cells were washed twice in 100 ml of cold 40 mM triethanolamine hydrochloride, pH 7.0, and then resuspended in approximately 25 ml using the same buffer containing DFPBV. This mixture was incubated on ice for 5 min followed by rapid freezing and lyophilization. Two samples were prepared. The first consisted of whole-cells of S. aureus grown in ESM containing L-alanine (0.1 g/L), D-[1-13C]alanine (0.1 g/L), and alaphosphin (5 µg/mL) (Sigma-Aldrich, St. Louis, MO). The cells harvested at OD660 1.3 were complexed with 2.0 mg of DFPBV. A second sample consisted of whole cells of S. aureus grown in ESM with the labeled amino acids, [1-13C]glycine and L-[ε -15N]lysine. The cells were harvested at OD660 0.8 and were complexed with 4.3 mg of DFPBV.
Rotational-Echo Double Resonance
Rotational-echo double resonance (REDOR) is a solid-state NMR method used to recouple dipolar interactions under magic-angle spinning (MAS) (18). The REDOR experiment consists of two parts. In the first part of the experiment, a polarization transfer from the protons prepares the 13C magnetization and the spectrum is collected after N rotor periods. Rotor-synchronized π pulses on the 13C channel (one per rotor period at Tr) refocus the isotropic chemical shift. There is no dipolar evolution over the rotor period due to MAS and thus no net dipolar phase is accumulated. The observed 13C spectrum is referred to as the “full echo” or the “S0” spectrum and is used as an intensity reference. In the second part of the REDOR experiment, 13C-19F dipolar coupling, for example, is reintroduced by applying rotor-synchronized dephasing π pulses (one per rotor period at Tr/2) to the 19F nuclei in addition to the 13C π pulses. The 19F pulses invert the sign of the dipolar coupling and interfere with the MAS spatial refocusing, resulting in a net dipolar phase accumulation and reduced 13C signal intensity. The 13C spectrum with the dephasing pulses is referred to as the “dephased” or the S spectrum with N rotor cycles of dipolar evolution. The intensity of the difference spectrum (ΔS = S − S0) arises only from 13C that is dipolar coupled to 19F. The difference spectra are typically collected as a function of N rotor periods to map out the 13C-19F dipolar evolution. For both parts of the experiment, the π pulses are XY8 phase-cycled to compensate for pulse imperfections (18).
REDOR was performed at 12-T (proton radio frequency of 500 MHz) and at 4.7-T (proton radio frequency of 200 MHz), provided, respectively, by 89-mm bore Magnex (Oxfordshire, England) and Oxford (Cambridge, England) superconducting solenoids. REDOR performed at 12-T utilized a six-frequency transmission-line probe having a 12 mm long, 6-mm inside diameter analytical coil and a Chemagnetics/Varian ceramic spinning module. The lyophilized whole-cell sample was spun using a thin-wall Chemagnetics/Varian (Fort Collins, CO/ Palo Alto, CA) 5-mm outside-diameter zirconia rotor at 7143 Hz with the speed under active control to within ±2 Hz. A Tecmag Libra pulse programmer (Houston, TX) controlled the spectrometer. A 2-kW American Microwave Technology power amplifier was used to produce radio-frequency pulses for 13C (125 MHz). The 1H (500 MHz) and 19F (470 MHz) radio-frequency pulses were generated by 2-kW Creative Electronics tube amplifiers driven by 50-W American Microwave Technology power amplifiers. All three amplifiers were under active control (23). The π pulse lengths were 8 µs for 13C and 5 µs for 19F. Proton-carbon matched cross-polarization transfers were made in 2 ms at 62.5 kHz. Proton dipolar decoupling was 100 kHz during data acquisition and TPPM of the 1H radio frequency (24) was used throughout both dipolar evolution and decoupling periods.
REDOR performed at 4.7-T utilized a four-frequency transmission-line probe having a 17-mm long, 8.6-mm inside-diameter analytical coil and a Chemagnetics/Varian ceramic stator. Lyophilized whole-cell samples were contained in Chemagnetics/ Varian 7.5-mm outside-diameter zirconia rotors. The rotors were spun at 5000 Hz with the speed under active control to within ±2 Hz. A Tecmag Libra pulse programmer controlled the spectrometer. Radio frequency pulses for 13C (50.3 MHz) and 15N (20.3 MHz) were produced by 1-kW ENI (Andover, MA) LPI-10 power amplifiers. Radio frequency pulses for 1H (200 MHz) were produced by a 1-kW Kalmus Engineering Int. Ltd (Valencia, CA) power amplifier, and the 19F (188 MHz) pulses by a 1-kW Dressler Hochfrequenztechnik Gmbh (Stolberg-Vicht, Germany) power amplifier. All four amplifiers were under active control (23). The π pulse lengths were 10 µs for 13C, 15N, and 19F. Matched proton-carbon cross-polarization transfers were made in 2 ms at 50 kHz. Proton dipolar decoupling was 98 kHz during data acquisition. Standard XY-8 phase cycling (25) was used for all refocusing and dephasing pulses.
Calculated REDOR dephasing
The normalized REDOR difference (ΔS/S0) is a direct measure of dipolar coupling. This quantity was calculated using the modified Bessel function expressions given by Mueller et al. (26) and de la Caillerie and Fretigny (27) for an IS spin-1/2 pair. A plot of ΔS/S0 with respect to time (t=Ntr), yields the dipolar coupling constant and hence the internuclear distance (rIS ). In the 13C{19F} REDOR dephasing calculation for the bridge labeled by [1-13C]glycine, a five glycyl-residue α-helix was assembled and energy minimized using Insight II (MSI, San Diego, CA). The grid position of a single 19F label relative to the pentaglycyl helix was varied, and the root-mean-square deviation (RMSD) between experimental and calculated dephasing was minimized (10,28).
Results
DFPBV complex with whole cells labeled by D-[1-13C]alanine
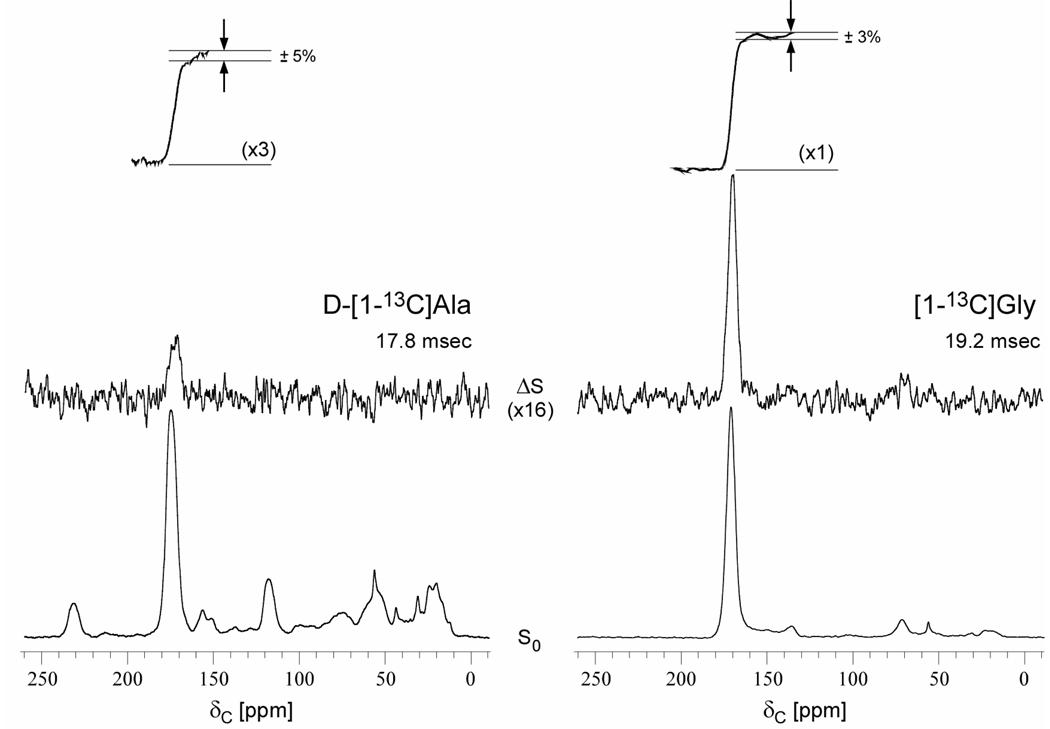
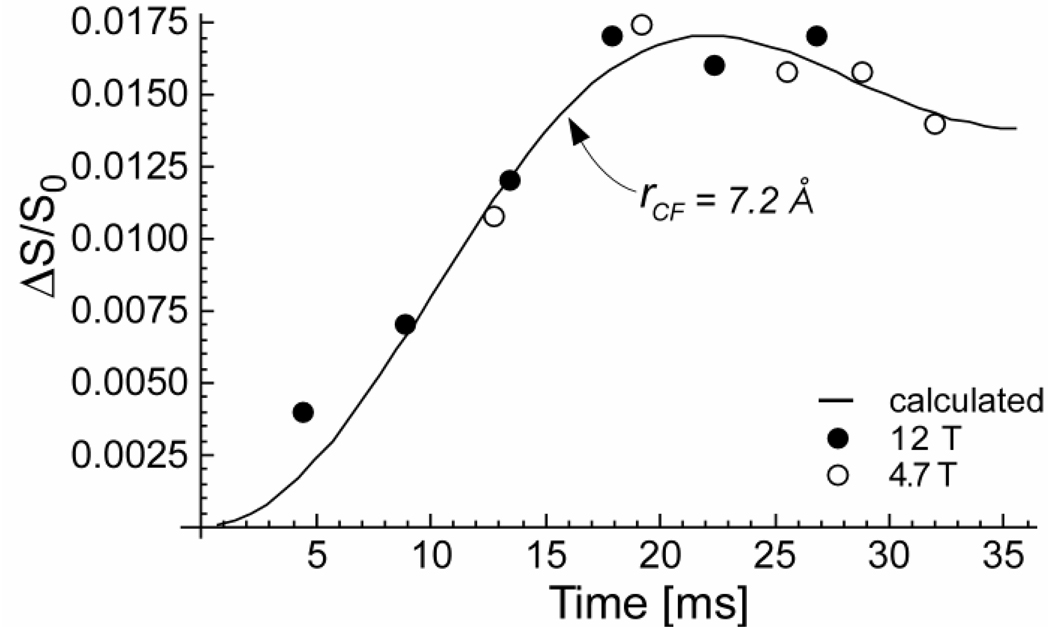
The 125-MHz 13C{19F} REDOR spectra of DFPBV complexed with whole cells of S. aureus grown on media containing D-[1-13C]alanine, L-alanine, and alaphosphin is shown in Figure 4 (left). The REDOR difference spectrum at the top of the figure arises exclusively from label in the cell wall. Baseline resolution allows an accurate determination of integrated intensity (Figure 4, left, inset). The 13C{19F} REDOR dephasing (ΔS/S0) of this complex is shown in Figure 5 as a function of dipolar evolution time. The observed maximum dephasing is 1.6% at 20 ms. A single 13C-19F distance of 7.2 Å (29) provides a reasonable match between calculated and experimental REDOR dephasing (Figure 5, solid line). We estimate the uncertainty in this distance determination as ± 0.5 Å, based on the widths of Gaussian distributions of distances needed to include the full dephasing set (see Figure 6 in reference 29). The dephasing data of Figure 5, collected for static magnetic fields of 4.7 T (open circles) and 12 T (closed circles), show unambiguously that DFPBV cell-wall binding has occurred.
Figure 4.
13C{19F} REDOR spectra of DFPBV complexes of whole cells of S. aureus labeled by D-[1-13C]alanine (left, 125 MHz) and [1-13C]glycine (right, 50.3 MHz). The full-echo spectra (S0) are at the bottom of the figure and the REDOR differences (ΔS = S0−S, where S is the dephased echo) are shown at the top. Integrals of the ΔS spectra are shown in the insets, along with estimates of the uncertainties. The spectra on the left were each the result of the accumulation of 106,212 scans, and on the right, 27,000 scans. Magic-angle spinning was at 7143 Hz for the spectra on the left, and 5000 Hz for those on the right.
Figure 5.
13C{19F}REDOR dephasing (ΔS/S0) as a function of the dipolar evolution time for a complex of DFPBV with whole cells of S. aureus labeled by D-[1-13C]alanine. The dephasing was measured for two values of the static magnetic field. Representative error bars based on integrals (see Figure 4) were determined by the uncertainties in ΔS, which ranged from ±15% near 5 ms evolution to ±5% at 20 ms evolution. The total number of scans accumulated was 2,018,656 for both S and S0 spectra. This accumulation required 93 days of spectrometer time. The solid line shows the calculated dephasing for a single 13C–19F distance of 7.2 Å and a maximum dephasing of 1.6%.
Figure 6.
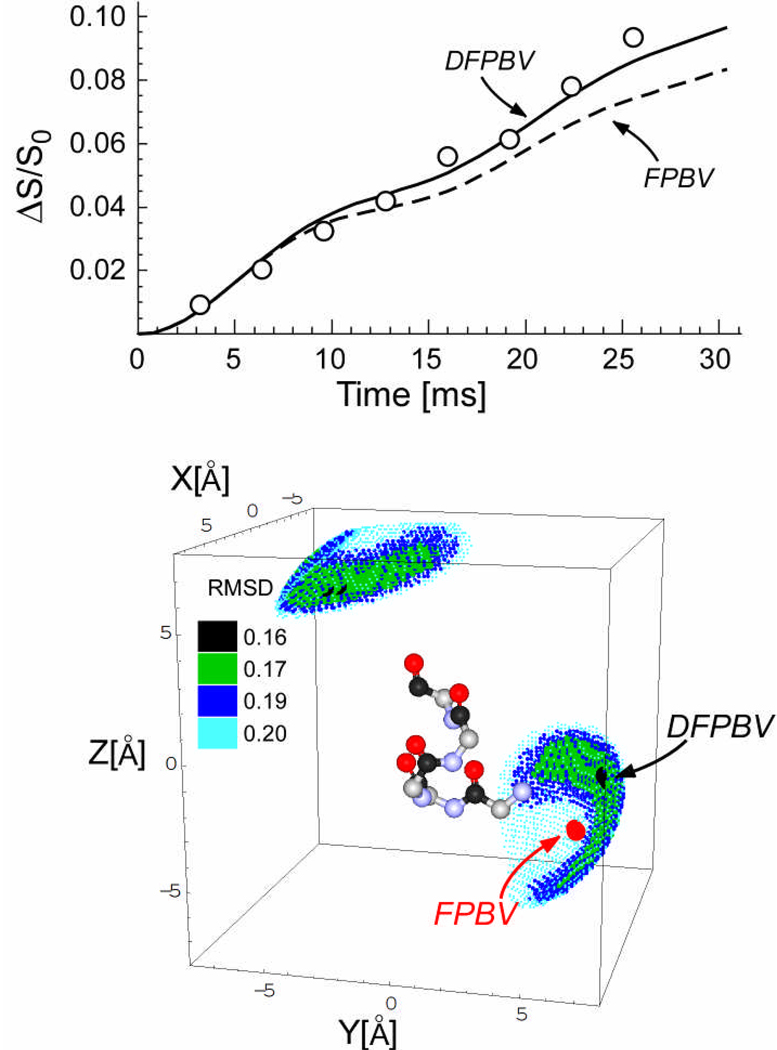
(Top) 13C{19F}REDOR dephasing (ΔS/S0) for a complex of DFPBV with whole cells of S. aureus labeled by [1-13C]glycine as a function of the dipolar evolution time. The measurements (open circles) were made at 4.7 T. The solid line shows the calculated dephasing assuming the five 13C-19F locations shown in the bottom panel and a total dephasing of 12%. The dotted line is the calculated dephasing for the known 19F position of FPBV. Error bars were determined by uncertainties in ΔS (see Figure 4). The total number of scans accumulated was 216,000, or 27,000 scans for each S and S0 spectrum for each evolution time. (Bottom) Possible locations of fluorine relative to the bridging pentaglycyl helix in peptidoglycan complexes of DFPBV. The pentaglycyl segment is shown in α-helical conformation with carbonyl carbons in black, alpha carbons in gray, nitrogens in blue, and oxygens in red. The positions that are consistent with the experimental 13C{19F}REDOR dephasing shown in the top panel are indicated by small dots whose colors indicate the root-mean-square deviation between calculated and experimental dephasing. The best match for DFPBV places the fluorine away from the helix axis. The position of the fluorine of heptapeptide FPBV bound to the peptidoglycan is indicated with a red dot and arrow. The 19F positions of DFPBV and FPBV are separated by 3 Å.
DFPBV complex with whole cells labeled by [1-13C]glycine and L-[ε-15N]lysine
The 50.3-MHz 13C{19F} REDOR spectra of DFPBV complexed with whole cells of S. aureus grown on media containing [1-13C]glycine and L-[ε-15N]lysine is shown in Figure 4 (right). The strong REDOR difference spectrum indicates proximity of the fluorine of DFPBV and pentaglycyl bridging segments. The 50.3-MHz 13C{19F} REDOR dephasing (ΔS/S0) of this complex as a function of dipolar evolution time is shown in Figure 6 (top). The locations of the 19F of DFPBV relative to a single bridging pentaglycyl helix that are consistent with the dephasing are shown in Figure 6 (bottom). The small dots are color coded to indicate the root-mean-square deviation between calculated and experimental dephasing. The best-fit 19F position of DFPBV is represented by a black dot. For comparison, the best-fit 19F position of FPBV (11) is also shown in the figure as a red dot. The two positions are close but do not overlap. The solid line in Figure 5 is the calculated 13C{19F} REDOR dephasing for the 19F of DFPBV at the position of the best fit. The maximum in this dephasing is 12%. The five 13C carbonyl-carbons of the α-helical pentaglycyl bridging segment are all close enough to have measurable dipolar coupling to the 19F of DFPBV. The 13C-19F distance to the nearest carbonyl carbon is 5.3 Å. The 13C-19F distances to the second, third, fourth, and fifth residues are 8.6, 9.6, 8.8, and 10.4 Å, respectively.
The 20.3-MHz 15N{19F} REDOR NMR spectra of DFPBV complexed with whole cells grown in media containing [1-13C]glycine and L-[ε-15N]lysine after 19.6 msec of dipolar evolution are shown in Figure 7 (left). The [ε-15N]lysine is readily utilized by whole cells of S. aureus without scrambling as indicated by the presence of only two peaks. The ε-15N labels that are incorporated into proteins and, to a lesser extent, the cytoplasmic peptidoglycan precursor, Park’s nucleotide, appear as side-chain amines (10 ppm). The ε-15N labels incorporated into stem bridge links (see Figure 3) are amides (93 ppm). The observed dephasing after 19.2 msec of dipolar evolution is 4% (Figure 7, left). There is no observable dephasing for a comparable whole-cell FPBV complex (Figure 7, right).
Figure 7.
20.3-MHz 15N{19F} REDOR spectra of whole cells of S. aureus labeled by L-[ε-15N]lysine in ESM and complexed with DFPBV (left), or labeled by L-[ε-15N]lysine in SASM and complexed with FPBV (right). The full-echo spectra (S0) are at the bottom of the figure and the REDOR differences (ΔS = S0−S, where S is the dephased echo) are shown at the top. The ε-15N amide nitrogen of the pentaglycyl-lysine bridge link appears near 93 ppm and the ε-15N amine nitrogen at 10 ppm. The dephasing of the 93-ppm peak is 4% after dipolar evolution during 96 rotor cycles (19.2 msec). The spectra on the left were the result of the accumulation of 69,000 scans, and on the right, 80,000 scans. Magic-angle spinning was at 5000 Hz.
Discussion
Dephasing Maxima and Leakage of Label from D-[1-13C]Alanine
The moles of DFPBV added to the cells labeled by D-[1-13C]alanine was equivalent to the moles of an undamaged FPBV sufficient to bind to 20% of the cell-wall peptidoglycan peptide stems ending in D-Ala-D-Ala. This percentage was confirmed by comparison of the 19F NMR signal intensity of the complex of Figure 5, relative to that observed for whole-cell complexes of FPBV of known binding-site occupancy (10). For a calculation of the maximum expected dephasing for the DFPBV cell-wall complex, two assumptions were made. First, we assumed that bound DFPBV is excluded from cross-link stem sites by its steric bulk and so binds to the cell wall only at sites that are not cross-linked. Such sites, on average, represent 46% of the stems in S. aureus (29). Second, we assumed that the fluorine of DFPBV is proximate to a single D-alanine on a nearest-neighbor stem and that 13C labels in other D-alanines are too distant for significant 13C-19F dipolar coupling (11). Thus, the maximum expected ΔS is (.20)(.46).
The full-echo S0 has contributions from D-alanine in both cross-linked and non-cross-linked stems, and from D-alanine in teichoic acids as well. The concentration of the latter in mature cells was estimated by a deconvolution of the carbonyl-carbon lineshape which indicated that the ratio of D-alanine in teichoic acid to D-alanine in cross-linked stems was approximately 1.0 (29). If there is no incorporation of D-alanine in cytoplasmic proteins and the concentration of D-alanine in Park’s nucleotide is small relative to that in the cell wall, then ΔS/S0 = (.20)(.46)/[(.46)(2) + (.54)(1) + (.54)(1)] = .046. This is three times the value observed experimentally, suggesting that the alaphosphin in ESM at 5 µg/ml allowed some interconversion between the D and L forms of alanine. For S. aureus grown in ESM with D-alanine in the presence of alaphosphin but no L-alanine, we have observed resumption of cell growth after one hour, indicating some leakage of D-alanine to L-alanine. We believe that the leakage allowed incorporation of label into cytoplasmic proteins thereby increasing S0 and decreasing ΔS/S0.
There is no leakage problem for the labeling by [1-13C]glycine. The observed maximum dephasing of 12% for the [1-13C]Gly-labeled DFPBV-peptidoglycan complex (Figure 6, top) is in reasonable agreement with the expected dephasing. The latter is based on a 64% binding-site occupancy (determined by binding assay), which is scaled by 46%, the fraction of stems that are not cross-linked, and 50%, the fraction of the glycine carbonyl-carbon peak intensity at 171 ppm arising from the cell wall (10). (The other half of the 171-ppm peak is from glycine incorporated into protein and is not proximate to 19F.) Thus, the expected dephasing maximum is ΔS/S0 = (.64)(.46)(.50) = 15%.
Conformation of the DFPBV-Peptidoglycan Complex
The observed single-distance 13C{19F} REDOR dephasing shown in Figure 5 is consistent with specific binding of DFPBV to the peptidoglycan of S. aureus labeled by D-[1-13C]alanine. Despite its damaged cleft, DFPBV binds as a monomer with a single 13C-19F distance of 7.2 Å to the nearest carbonyl carbon of the D-alanine in a neighboring stem just as FPBV (10).
The 13C{19F} REDOR of whole cells of S. aureus grown in media containing [1-13C]glycine determine the 19F position relative to the nearest pentaglycyl bridge structure. The observed dephasing maximum is 12% (Figure 6, top), just slightly lower than the calculated dephasing limit of 15%. If DFPBV were to bind as a dimer rather than a monomer, with nearest-neighbor stems and bridges too far away from one member of the dimer to contribute to ΔS, then the observed maximum dephasing would be half that expected for binding as a monomer. This is inconsistent with the agreement between observed and calculated maximum dephasing in Figure 6 (top).
The solid line in Figure 6 is the calculated 13C{19F}REDOR dephasing for the best 19F position of DFPBV in relation to the pentaglycyl-bridge, and the dotted line is the calculated dephasing for the known 19F position of FPBV. The two dephasing curves are superimposable up to 10 msec of dipolar evolution, consistent with the same 5-Å 13C-19F distance for both 19F of DFPBV and FPBV to the nearest glycine carbonyl carbon. The difference in the dephasing pattern after 10 msec indicates a modest change in the 19F positions of DFPBV from the known 19F position of FPBV (Figure 6, bottom). These two positions are about 3 Å apart.
The shift in 19F position of DFPBV is sufficient to have an effect on the 15N{19F} REDOR spectra of the same whole cells which were also labeled by L-[ε-15N]lysine. The observed 4% dephasing after 19.2 msec of dipolar evolution (Figure 7, left) translates into an 8 Å distance from the 19F of DFPBV to the [ε-15N]lysine bridge link. In contrast, no 15N{19F}REDOR dephasing was observed for the FPBV cell-wall complex after 19.2 msec (Figure 7, right), placing the 19F more than 10 Å away from the bridge link, consistent with the locations shown in Figure 5 (bottom).
Despite the shift of the fluorine, the overall similarities in the conformations of DFPBV- and FPBV-peptidoglycan complexes suggest that similar interactions between the drugs, non-terminal components of the stems, and bridging segments of the cell-wall peptidoglycan are responsible for stabilizing the complexes. For binding-site occupancy as high as 64%, DFPBV binds as a monomer with its vancosamine hydrophobic substituent near a pentaglycyl bridge or bridging segment. For des-N-methylleucyloritavancin (the Edman degradation product of oritavancin), the 4-epivancosamine substituent (Figure 1) may improve binding to the cell-wall peptidoglycan (30), but is not essential.
Proposed Mode of Action
The template strand is the last glycan chain whose length has been completed. Its three-dimensional structure is partially cross-linked and closely resembles that of mature peptidoglycan. For a cell wall with 8–10 glycan layers, the template strand represents 10–15% of the total number of glycan strands but has a larger fraction of peptide stems that are not cross-linked. We believe that glycopeptides like DFPBV bind to template and mature peptidoglycan similarly. We distinguish this binding from possible interactions with lipid II (the peptidoglycan monomer). In lipid II, the glycine bridging segment and peptide stem are unconstrained, whereas in the mature and template peptidoglycan, specific conformations and orientations are adopted due to the steric constraints imposed by the cross-linked lattice. We propose that the hydrophobic sidechain of DFPBV serves two functions: (i) mediating multiple drug-peptidoglycan interactions to stabilize the complex, and (ii) inhibiting transpeptidase activity through nonspecific steric blocking.
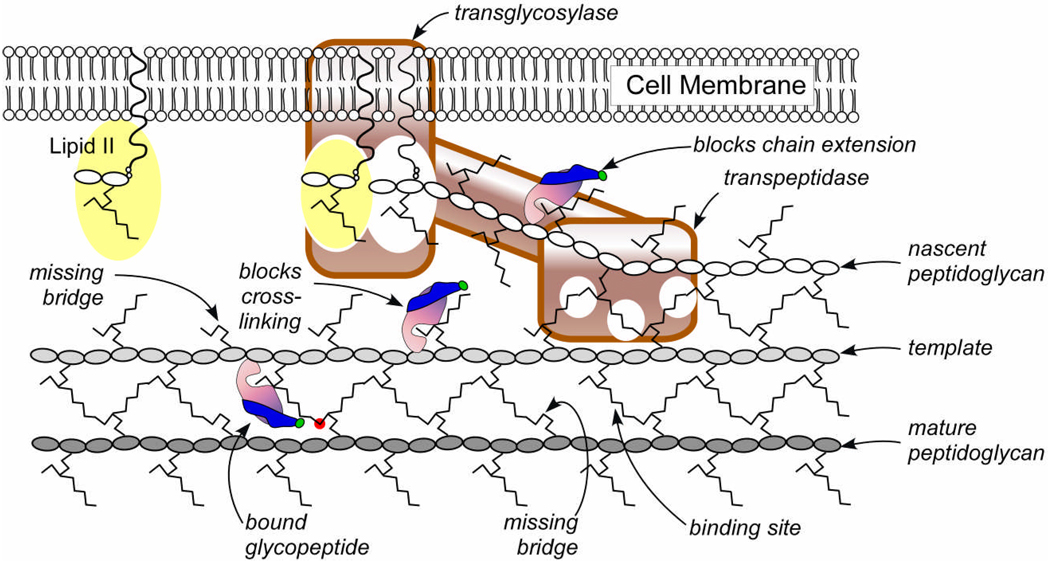
This proposed mode of action for DFPBV is illustrated schematically in Figure 8. DFPBV bound to template peptidoglycan is shown positioned to inhibit transpeptidase activity by nonspecific steric interference. This mechanism is independent of interaction with lipid II and requires no specific binding to enzymes. DFPBV may also bind at nascent peptidoglycan sites even though lattice constraints are only partially formed. If this occurs, the resulting complex could block transglycosylation by non-specific steric interference. Chain extension and cross-linking are synchronized by a single enzyme with two binding domains (31). This ensures the orientation needed for full cross-linking which may occur later.
Figure 8.
Two-dimensional schematic representation of peptidoglycan assembly in S. aureus. Chain extension (right to left) at the active site of transglycosylase (white oval) and cross-linking at the active site(s) of transpeptidase (white circles) are synchronized. This ensures that the orientation of monomers added to the growing nascent peptidoglycan is determined by the template strand (the last completed glycan chain shown in light gray) to which they ultimately will be cross-linked. Glycopeptides like DFPBV (pink-purple-green) cannot bind to D-Ala-D-Ala and so are unlikely to bind to lipid II (yellow), but can bind to mature peptidoglycan or between mature and template strands (bottom, left) at sites that are not cross-linked and so are sterically free. The 19F (green) of the hydrophobic substituent (blue) at such sites is near the D-alanine (red) of a neighboring stem. DFPBV can also bind at structurally similar template sites which are adjacent to nascent peptidoglycan, and this leads to inhibition of cross-linking. DFPBV possibly binds at nascent peptidoglycan sites, which could lead to inhibition of chain extension.
A cell-wall secondary binding site has been proposed earlier for other glycopeptides with hydrophobic vancosamine substituents (11). In particular, the correlation of structure and activity for five oritavancin-like glycopeptides can be explained by the same template-strand, cell-wall-binding mode of action illustrated in Figure 8. In addition, for oritavancin itself, we have observed both transglycosylase and transpeptidase inhibition in wild-type S. aureus at sub-lethal drug concentrations (30). The former resulted in the accumulation of Park’s nucleotide in the cytoplasm, and the latter, a decrease in the degree of cross-linking in the cell wall. In contrast, vancomycin (which has no vancosamine substituent) at sub-lethal concentrations showed primarily the accumulation of Park’s nucleotide and no substantive changes in the degree of cell wall cross-linking (32). This combination of effects is indicative of transglycosylase inhibition by the known targeting of lipid II.
We conclude that cell-wall secondary-site binding is common for oritavancin-like glycopeptides in staphylococci. Future experiments will determine if this mechanism extends to other second-generation glycopeptides and to binding in enterococci as well as in staphylococci.
Abbreviations
- C55
pyrophosphoryl-undecaprenol
- CPBV
N-4-(4-chlorophenyl)benzyl-vancomycin
- CPMAS
cross-polarization magic-angle spinning
- DCPBV
des-N-methylleucyl-4-(4-chlorophenyl)benzyl-vancomycin
- DFPBV
des-N-methylleucyl-4-(4-fluorophenyl)benzyl-vancomycin
- DV
des-N-methylleucyl-vancomycin
- ESM
enhanced standard medium
- FPBV
N-4-(4-fluorophenyl)benzyl-vancomycin
- lipid II
N-acetylglucosamine-N-acetyl-muramyl-pentapeptide-pyrophosphoryl-undecaprenol
- MAS
magic-angle spinning
- MIC
minimum inhibitory concentration
- MRSA
methicillin-resistant S. aureus
- [19F]oritavancin
N-4-(4-fluorophenyl)benzyl-chloroeremomycin
- REDOR
rotational-echo double resonance
- SASM
S. aureus standard medium
- VRE
vancomycin-resistant enterococci
- VRSA
vancomycin-resistant S. aureus.
Footnotes
This paper is based on work supported by the Naito Foundation of Japan and by the National Institutes of Health under grant number EB02058.
References
- 1.Breukink E, van Heusden HE, Vollmerhaus PJ, Swiezewska E, Brunner L, Walker S, Heck AJ, de Kruijff B. Lipid II is an intrinsic component of the pore induced by nisin in bacterial membranes. J. Biol. Chem. 2003;278:19898–19903. doi: 10.1074/jbc.M301463200. [DOI] [PubMed] [Google Scholar]
- 2.Leclercq R, Derlot E, Duval J, Courvalin P. Plasmid-mediated resistance to vancomycin and teicoplanin in Enterococcus faecium. N. Engl. J. Med. 1988;319:157–161. doi: 10.1056/NEJM198807213190307. [DOI] [PubMed] [Google Scholar]
- 3.National Nosocomial Infections Surveillance (NNIS) System Report, data summary from January 1992 through June 2004, issued October 2004. Am. J. Infect. Control. 2004;32:470–485. doi: 10.1016/S0196655304005425. [DOI] [PubMed] [Google Scholar]
- 4.CDC. Staphylococcus aureus resistant to vancomycin-United States, 2002. Morb. Mortal. Wkly. Rep. 2002;51:565–567. [PubMed] [Google Scholar]
- 5.Allen NE, LeTourneau DL, Hobbs JN., Jr Molecular interactions of a semisynthetic glycopeptide antibiotic with D-alanyl-D-alanine and D-alanyl-D-lactate residues. Antimicrob. Agents Chemother. 1997;41:66–71. doi: 10.1128/aac.41.1.66. [DOI] [PMC free article] [PubMed] [Google Scholar]
- 6.Van Bambeke F. Glycopeptides in clinical development: pharmacological profile and clinical perspectives. Curr. Opin. Pharmacol. 2004;4:471–478. doi: 10.1016/j.coph.2004.04.006. [DOI] [PubMed] [Google Scholar]
- 7.Breukink E, Humphrey PP, Benton BM, Visscher I. Evidence for a multivalent interaction between telavancin and membrane-bound Lipid II; Interscience Conference on Antimicrobial Agents and Chemotherapy; 2006. [Google Scholar]
- 8.Allen NE, LeTourneau DL, Hobbs JN., Jr The role of hydrophobic side chains as determinants of antibacterial activity of semisynthetic glycopeptide antibiotics. J. Antibiot. 1997;50:677–684. doi: 10.7164/antibiotics.50.677. [DOI] [PubMed] [Google Scholar]
- 9.Beauregard DA, Williams DH, Gwynn MN, Knowles DJ. Dimerization and membrane anchors in extracellular targeting of vancomycin group antibiotics. Antimicrob. Agents Chemother. 1995;39:781–785. doi: 10.1128/AAC.39.3.781. [DOI] [PMC free article] [PubMed] [Google Scholar]
- 10.Kim SJ, Cegelski L, Studelska DR, O'Connor RD, Mehta AK, Schaefer J. Rotational-echo double resonance characterization of vancomycin binding sites in Staphylococcus aureus. Biochemistry. 2002;41:6967–6977. doi: 10.1021/bi0121407. [DOI] [PubMed] [Google Scholar]
- 11.Kim SJ, Cegelski L, Preobrazhenskaya M, Schaefer J. Structures of Staphylococcus aureus cell-wall complexes with vancomycin, eremomycin, and chloroeremomycin derivatives by 13C{19F} and 15N{19F} rotational-echo double resonance. Biochemistry. 2006;45:5235–5250. doi: 10.1021/bi052660s. [DOI] [PMC free article] [PubMed] [Google Scholar]
- 12.Ge M, Chen Z, Onishi HR, Kohler J, Silver LL, Kerns R, Fukuzawa S, Thompson C, Kahne D. Vancomycin derivatives that inhibit peptidoglycan biosynthesis without binding D-Ala-D-Ala. Science. 1999;284:507–511. doi: 10.1126/science.284.5413.507. [DOI] [PubMed] [Google Scholar]
- 13.Allen NE, LeTourneau DL, Hobbs JN, Jr, Thompson RC. Hexapeptide derivatives of glycopeptide antibiotics: tools for mechanism of action studies. Antimicrob. Agents Chemother. 2002;46:2344–2348. doi: 10.1128/AAC.46.8.2344-2348.2002. [DOI] [PMC free article] [PubMed] [Google Scholar]
- 14.Goldman RC, Baizman ER, Longley CB, Branstrom AA. Chlorobiphenyl-desleucyl-vancomycin inhibits the transglycosylation process required for peptidoglycan synthesis in bacteria in the absence of dipeptide binding. FEMS Microbiol. Lett. 2000;183:209–214. doi: 10.1111/j.1574-6968.2000.tb08959.x. [DOI] [PubMed] [Google Scholar]
- 15.Chen L, Walker D, Sun B, Hu Y, Walker S, Kahne D. Vancomycin analogues active against vanA-resistant strains inhibit bacterial transglycosylase without binding substrate. Proc. Natl. Acad. Sci. U S A. 2003;100:5658–5663. doi: 10.1073/pnas.0931492100. [DOI] [PMC free article] [PubMed] [Google Scholar]
- 16.Leimkuhler C, Chen L, Barrett D, Panzone G, Sun B, Falcone B, Oberthur M, Donadio S, Walker S, Kahne D. Differential inhibition of Staphylococcus aureus PBP2 by glycopeptide antibiotics. J. Am. Chem. Soc. 2005;127:3250–3251. doi: 10.1021/ja043849e. [DOI] [PubMed] [Google Scholar]
- 17.Barrett D, Leimkuhler C, Chen L, Walker D, Kahne D, Walker S. Kinetic characterization of the glycosyltransferase module of Staphylococcus aureus PBP2. J. Bacteriol. 2005;187:2215–2217. doi: 10.1128/JB.187.6.2215-2217.2005. [DOI] [PMC free article] [PubMed] [Google Scholar]
- 18.Gullion T, Schaefer J. Detection of weak heteronuclear dipolar coupling by rotational-echo double-resonance nuclear magnetic resonance. Adv. Magn. Reson. 1989;13:57–83. [Google Scholar]
- 19.Miyaura N, Suzuki A. Palladium-catalyzed cross-coupling reactions of organoboron compounds. Chem. Rev. 1995;95:2457–2483. [Google Scholar]
- 20.Pavlov AY, Miroshnikova OV, Printsevskaya SS, Olsufyeva EN, Preobrazhenskaya MN, Goldman RC, Branstrom AA, Baizman ER, Longley CB. Synthesis of hydrophobic N′-mono and N′,N″-double alkylated eremomycins inhibiting the transglycosylation stage of bacterial cell wall biosynthesis. J. Antibiot. 2001;54:455–459. doi: 10.7164/antibiotics.54.455. [DOI] [PubMed] [Google Scholar]
- 21.Printsevskaya SS, Pavlov AY, Olsufyeva EN, Mirchink EP, Isakova EB, Reznikova MI, Goldman RC, Branstrom AA, Baizman ER, Longley CB, Sztaricskai F, Batta G, Preobrazhenskaya MN. Synthesis and mode of action of hydrophobic derivatives of the glycopeptide antibiotic eremomycin and des-(N-methyl-D-leucyl)eremomycin against glycopeptide-sensitive and -resistant bacteria. J. Med. Chem. 2002;45:1340–1347. doi: 10.1021/jm010460i. [DOI] [PubMed] [Google Scholar]
- 22.Tong G, Pan Y, Dong H, Pryor R, Wilson GE, Schaefer J. Structure and dynamics of pentaglycyl bridges in the cell walls of Staphylococcus aureus by 13C-15N REDOR NMR. Biochemistry. 1997;36:9859–9866. doi: 10.1021/bi970495d. [DOI] [PubMed] [Google Scholar]
- 23.Stueber D, Mehta AK, Chen Z, Wooley KL, Schaefer J. Local order in polycarbonate glasses by 13C{19F} Rotational-Echo Double-Resonance NMR. J. Polym. Sci., Part B: Polym. Phys. 2006;44:2760–2775. [Google Scholar]
- 24.Bennett AE, Reienstra CM, Auger M, Lakshmi KV, Griffin RG. Heteronuclear decoupling in rotating solids. J. Chem. Phys. 1995;103:6951–6958. [Google Scholar]
- 25.Gullion T, Baker DB, Conradi MS. New, compensated Carr-Purcell sequences. J. Magn. Reson. 1990;89:479–484. [Google Scholar]
- 26.Mueller KT, Jarvie TP, Aurentz DJ, Roberts BW. The REDOR transform: direct calculation of internuclear couplings from dipolar-dephasing NMR data. Chem. Phys. Lett. 1995;242:535–542. [Google Scholar]
- 27.de la Caillerie J-BdE, Fretigny C. Analysis of the REDOR signal and inversion. J. Magn. Reson. 1998;133:273–280. doi: 10.1006/jmre.1998.1462. [DOI] [PubMed] [Google Scholar]
- 28.O'Connor RD, Schaefer J. Relative CSA-dipolar orientation from REDOR sidebands. J. Magn. Reson. 2002;154:46–52. doi: 10.1006/jmre.2001.2461. [DOI] [PubMed] [Google Scholar]
- 29.Cegelski L, Steuber D, Mehta AK, Kulp DW, Axelsen PH, Schaefer J. Conformational and quantitative characterization of oritavancin-peptidoglycan complexes in whole cells of Staphylococcus aureus by in vivo 13C and 15N labeling. J. Mol. Biol. 2006;357:1253–1262. doi: 10.1016/j.jmb.2006.01.040. [DOI] [PubMed] [Google Scholar]
- 30.Kim SJ, Cegelski L, Stueber D, Singh M, Dietrich E, Tanaka KSE, Parr TR, Jr, Far AR, Schaefer J. Mode of action of oritavancin in Staphylococus aureus by solid-state NMR. J. Mol. Biol. 2007 doi: 10.1016/j.jmb.2008.01.031. (accepted). [DOI] [PMC free article] [PubMed] [Google Scholar]
- 31.Lovering AL, de Castro LH, Lim D, Strynadka NCJ. Structural Insight into the Transglycosylation Step of Bacterial Cell-Wall Biosynthesis. Science. 2007;315:1402–1405. doi: 10.1126/science.1136611. [DOI] [PubMed] [Google Scholar]
- 32.Cegelski L, Kim SJ, Hing AW, Studelska DR, O'Connor RD, Mehta AK, Schaefer J. Rotational-echo double resonance characterization of the effects of vancomycin on cell wall synthesis in Staphylococcus aureus. Biochemistry. 2002;41:13053–13058. doi: 10.1021/bi0202326. [DOI] [PubMed] [Google Scholar]


