Summary
Voltage-dependent H+ (Hv) channels mediate proton conduction into and out of cells under the control of membrane voltage. Hv channels are unusual compared to voltage-dependent K+, Na+ and Ca2+ channels in that Hv channel genes encode a voltage sensor domain (VSD) without a pore domain. The H+ currents observed when Hv channels are expressed heterologously suggest that the VSD itself provides the pathway for proton conduction. In order to exclude the possibility that the Hv channel VSD assembles with an as yet unknown protein in the cell membrane as a requirement for H+ conduction we have purified Hv channels to homogeneity and reconstituted them into synthetic lipid liposomes. The Hv channel VSD by itself supports H+ flux.
Keywords: Voltage-sensor, Membrane protein, Proton channel
Voltage-dependent H+ (Hv) channels were first described in snail neurons and have been characterized most thoroughly in mammalian cells by DeCoursey 1; 2. Hv channels are involved in many cellular functions including acid extrusion and charge compensation during the phagocyte respiratory burst 3. The recent discovery of Hv channel genes demonstrated that they encode membrane proteins that are related in amino acid sequence to voltage sensor domains (VSD) of voltage-dependent cation channels 4; 5. Voltage-dependent cation channels contain a single central pore surrounded by four VSDs, which regulate opening and closing of the pore 6; 7. It was therefore interesting to observe that Hv channels appear to consist of a regulatory (voltage-sensor) domain without a pore, and yet, when expressed in mammalian cells, they produce voltage-dependent H+ currents with pharmacological properties expected of native Hv channels 4; 5.
Functional expression of a gene in cells leaves open the possibility that an unknown component provided by the cell is necessary to support function. Stimulated by our interest in voltage sensor proteins our laboratory has been studying Hv channels using biochemical methods with the ultimate goal to determine the atomic structure. Our expression and purification studies enable us to test the functional competence of the Hv VSD-like protein in a completely defined reconstituted state 8.
Hv mediates H+ flux in vesicles
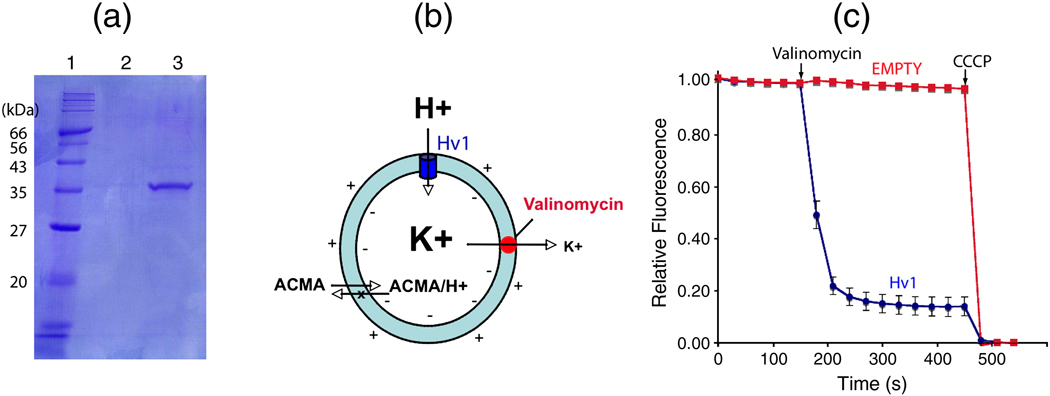
Human Hv channels including a C-terminal 1D4 tag were expressed in Pichia pastoris yeast and purified using affinity chromatography followed by size exclusion chromatography (see Fig. 1A for detailed methods). Purified protein appears as a single band corresponding to the expected size of a monomer on gel electrophoresis under denaturing conditions (Fig. 1A). Reconstitution of Hv protein into lipid vesicles was carried out as described in methods using different protein to lipid ratios. As a control, reconstitution of empty vesicles was carried out in parallel in the absence of protein.
Fig. 1.
Proton flux by vesicles containing recombinant Hv channels. (A) SDS-PAGE gel showing purified Hv channels. Lane 1: molecular weight marker, 2: final wash, and 3: Human Hv-1D4 eluted with 0.4 mg/ml 1D4 peptide. The gene for the full length human Hv channels (GenBank accession no: 91992153) with a C-terminal 1D4 tag (ARAAGGTETSQVAPA) was ligated into the PICZ-c vector (Invitrogen Life Technologies). This vector was transformed into a His+ strain of SMD1163 Pichia pastoris and selected as described 6. Transformed cells were grown in 1 L cultures of BMG media (Yeast Nirtogen Base, 100 mM sodium phosphate pH 6.3 and 1 % glycerol) at 30 ° C until an optical density of ~20 was reached. BMG media was exchanged for BMM media (BMG with 1 % MeOH instead of glycerol) and grown at 24° C for 24 hours. Frozen pellets were lysed with a mixer mill (Retsch, Inc. Model MM301) and resuspended in buffer (500 mM NaCl, 50 mM TRIS-HCl, pH 8.5, 2 mM β-mercaptoethanol, 0.1 µg/ml deoxyribonuclease I, 0.1 µg/ml pepstatin, 1 µg/ml leupeptin, 1 µg/ml aprotinin, 1.0 mM phenylmethysulfonyl fluoride and 2.0 mM Ethylenediaminetetraacetic acid (EDTA). The pH was adjusted to 8.5 with NaOH, and 0.15 g DDM (n-dodecyl-β-D-maltopyranoside, Anatrace) per g of cells was added prior to a 2–3 hour extraction at room temperature followed by centrifugation at 31000 × g for 25 min. Supernatant was added to 1D4 antibody-linked sepharose affinity resin previously equilibrated with buffer A (500 mM NaCl, 50 mM TRIS-HCl, pH 7.5, 1 mM EDTA and 1 mM DDM) and rotated at room temperature for 2 hours. The resin was collected on a column, washed with buffer A (4 × 5 column volumes) and eluted with buffer A containing 0.4 mg/ml 1D4 peptide. Protein was loaded on a Superdex-200 gel filtration column in 20 mM TRIS-HCl, pH 7.5, 150 mM KCl, 50 mM NaCl and 4 mM DM (n-decyl-β-D-maltopyranoside, Anatrace, anagrade) (Buffer B). The fractions corresponding to Hv channels were pooled and concentrated to 1.0 mg/ml for reconstitution into lipid vesicles. (B) Fluorescence-based H+ flux assay. Vesicles (cyan) loaded with high concentration of K+ are diluted into low concentration K+ buffer containing the fluorescence dye ACMA (9-amino-6-chloro-methoxyacridine). Addition of valinomycin (red), a K+ selective ionophore, results in K+ efflux, which generates a driving force for H+ influx. If there is a H+ channel (blue) in the vesicle membrane, pH inside the vesicle will decrease. This pH decrease is monitored by ACMA because the protonated form, which becomes trapped inside vesicles, loses fluorescence whereas unprotonated ACMA diffuses freely across the membrane 9. (C) Fluorescence-based H+ flux assay for vesicles with and without Hv1 colored blue and red, respectively (n = 5). Error bars indicate standard error of the mean. Valinomycin and CCCP are added at the indicated time points. The fluorescence data for vesicles containing Hv channels was obtained using a published procedure with the following modification 16. A mixture of 6:6:3:3:1 of POPC:POPE:POPS:SM:PI (1-Palmitoyl-2-Oleoyl-sn-Glycero-3-Phosphocholine, 1-Palmitoyl-2-Oleoyl-sn-Glycero-3-Phosphoethanolamine, 1-Palmitoyl-2-Oleoyl-sn-Glycero-3-Phospho-L-Serine, Sphingomyelin, and L-α-Phosphatidylinositol, obtained from Avanti) was prepared based on the composition of human neutrophil plasma membrane 17. The lipid mixture was dried under an Argon stream and then resuspended to 10 mg/ml in dialysis buffer (20 mM HEPES, pH 7.0, 150 mM KCl, 10% glycerol, 0.2 mM EGTA and 2 mM 2-mercaptoethanol). The lipid mixture was then sonicated in a bath sonicator three times for 2 minutes. Decylmaltoside (DM) was added to the lipid mixture to 10 mM and rotated at room temperature for 1hr. Protein was added to the lipid mixture in a 1:100 (wt:wt) protein to lipid ratio and an additional 10 mM DM was added. As a control empty vesicles were made in which only buffer B was added to the lipids. The protein-lipid mixture was rotated at room temperature for ~3 hours then placed into dialysis membrane (molecular weight cut off of 50 KDa) and dialyzed in 4 L of dialysis buffer for 5 days at RT exchanging buffer daily. Vesicles were then harvested and flash frozen in liquid nitrogen and stored at −80° C. Vesicles were thawed in room temperature water and then sonicated once in a bath sonicator for 5 seconds and then diluted 20 fold into flux buffer (20 mM HEPES, pH 7.0, 150 mM NaCl, 7.5 mM KCl, 10% glycerol, 0.2 mM EGTA, 0.5 mg/ml BSA, 2 mM 2-mercaptoethanol and 2 µM ACMA) in a quartz cuvette. Data were collected on a Spex Fluorolog 3–11 spectrofluorometer in time acquisition mode at 30-second intervals with excitation at 410 nm, emission 490 nm, with bandwidth 5 nm and an integration time 2 s. A baseline was collected for 150 s before the addition of 20 nM valinomycin. After the fluorescence stabilized carbonyl cyanide m-chloro phenyl hydrazone (CCCP) was added to 2 µM rendering all vesicles H+ permeable and a minimum baseline was collected for 150 seconds. Data are scaled by (Fi − Fmin)/(Fmax−Fmin), where Fmax is the average value of the starting baseline and Fmin is the average value of the minimum baseline. Fmax−Fmin (the total reduction in fluorescence after CCCP addition) was ~ 25 % for all vesicles.
To study H+ flux in lipid vesicles containing human Hv channels we used the fluorescence-based H+ flux assay depicted in Fig. 1B. This assay was originally developed to study H+ flux through V-ATPase 9. Vesicles were reconstituted in the presence of 150 mM K+ and diluted 20-fold into buffer containing 7.5 mM K+ generating a 10-fold K+ gradient across the membranes. Upon addition of the K+ selective ionophore valinomycin the K+ gradient produces an electric potential across the vesicular membrane negative inside relative to outside. If a H+ channel is present in the membrane the negative inside electric potential will cause H+ to enter the vesicles and lower the internal pH, which is monitored by H+ induced quenching of the fluorophore 9-amino-6-chloro-2-methoxyacridine (ACMA).
Fig. 1C shows the fluorescence change caused by addition of valinomycin to a sample of empty vesicles and to a sample of human Hv reconstituted vesicles at a protein to lipid ratio of 1:100 (wt:wt). The empty vesicles exhibit a very gradual fluorescence change consistent with there being a very slow nonspecific leak for H+ entry until the proton ionophore carbonyl cyanide m-chlorophenyl hydrazone (CCCP) is added. Vesicles containing Hv channels showed a robust change in fluorescence upon addition of valinomycin, consistent with the Hv channel providing a specific pathway for H+ entry. The further reduction in fluorescence brought about by the addition of CCCP reflects a small fraction of empty vesicles. As we demonstrate below by analysis of flux at different protein to lipid ratios, the roughly 15% of empty vesicles even at high protein to lipid ratios stem from a population of vesicles that appear incapable of incorporating functional Hv channels. Similar fractions of reconstitution deficient vesicles have been described previously in studies of other transport proteins 10; 11; 12.
The Majority of Reconstituted Hv Channels are Functional
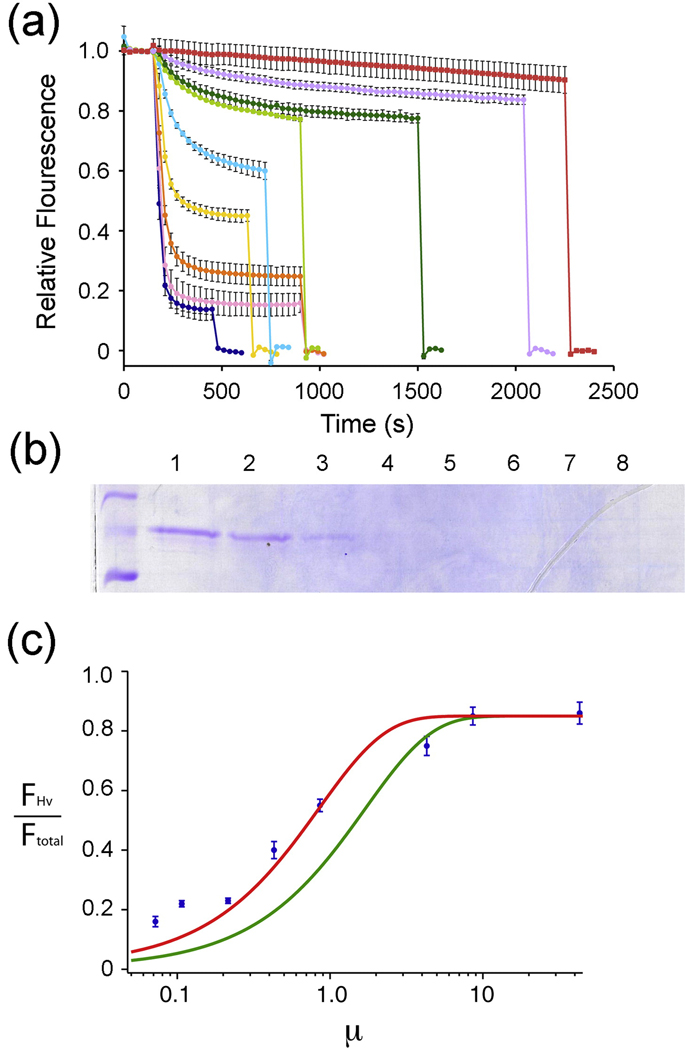
In order to investigate further the Hv channels we performed the reconstitution at various protein to lipid ratios (Fig. 2A). The fluorescence-based assay, which indirectly measures H+ flux through an unknown relationship between H+ concentration and fluorescence, precludes quantitative determination of H+ conduction rates. The assay does, however, allow us to estimate the fraction of total channels in the reconstitution that are functional through the following reasoning. The fluorescence decay brought about by the addition of valinomycin (FHv) is proportional to the number of vesicles that contain at least one Hv channel. The fluorescence decay brought about by valinomycin plus CCCP (Ftotal) is proportional to the total number of vesicles. Given that we know the mass protein to mass lipid ratio in the reconstitution, and that the reconstitution occurs efficiently (Fig. 2B), with a few assumptions we can calculate the mean number of channels per vesicle μ. The main assumptions are that the lipid head group area is 63 Å213 and that the vesicles are uniform in size with a radius of 100 nm 14. If incorporation of Hv channels into vesicles is random then we expect
| (1) |
where θ is the fraction of reconstitution deficient vesicles (~15%, measured directly from the data) and φ is the fraction of channels that are functional 12. The red curve in Fig. 2C corresponds to the equation with ϕ = 1.0. To ensure that this conclusion is not mistakenly based on an incorrect assumption of the vesicle radius, which we have not measured but estimate from values in the literature, we fit the data using alternative values. At 70 nm vesicles would be too numerous given the number of channels: in other words ϕ would have to be greater than 1.0, which is physically impossible. At 130 nm the best fit still corresponds to ϕ approximately 0.75. Therefore, even given the degree of uncertainty introduced by our assumptions of vesicle radius, uniformity, and lipid molecule surface area, the data support the conclusion that the majority of Hv channels in the reconstitution are functional.
Fig. 2.
Understanding the time course of fluorescence decay
Although we are unable to determine the H+ conduction rate we can ask to what degree the time course of fluorescence decay is at least qualitatively consistent with our expectation based on theory. We simulated H+ flux into a population of vesicles with a mean number of μ channels per vesicle assuming that a vesicle will have n channels with subset m facing outside-in with a frequency
| (2) |
Upon addition of valinomycin the membrane potential is driven to very near the Nernst potential for K+ (about −60 mV inside) because the K+ conductance exceeds H+ conductance under all conditions in the simulation. We model Hv voltage-dependent gating with a two-state Boltzmann function with midpoint activation voltage Vmid = 40 mV and valence 3 5; 15.
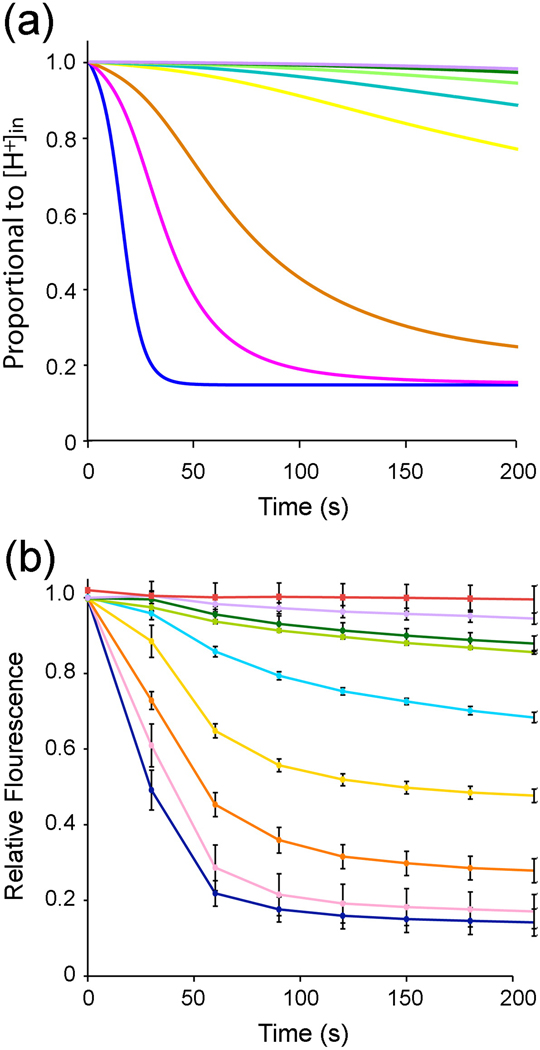
Fig. 3A graphs simulation results for populations of vesicles with channels distributed according to equation 2. If one focuses on a single vesicle a value 1.0 on the y-axis corresponds to a free (unbound) internal H+ concentration of 10−7 M; a value 0 corresponds to a free internal H+ concentration of 10−6 M. During the simulation the free internal H+ concentration in the given vesicle changes from 10−7 to 10−6 (approximately) following a time course that depends on the number of channels and their orientation in the vesicle. The graph shows the weighted sum of time courses for all vesicles (including empty) in the population for a 200 s interval. The curves show a fast followed by a slower decay at smaller values of μ: the slower component is attributable mainly to a fraction of vesicles with only outside-out channels, which have a very low open probability. The curves also show a negative second derivative (curvature) at early time points due to H+ buffering inside the vesicles. These same qualitative features are observed in fluorescence decay data (Fig. 3B).
Fig. 3.
The theoretical and experimental curves are different in two obvious respects. As a function of μ the curves do not exhibit the same spacing between them. We think this most likely reflects the nonlinear (and unknown) relationship between free internal H+ concentration and fluorescence. We emphasize that this unknown relationship prevents us from determining H+ flux rates, but it does not prevent us from determining the fraction of vesicles with no channels versus vesicles with at least one channel (Fig. 2A). The second difference between theory and experiment is a more prominent slow component of fluorescence change in the data, which is consistent with channel-independent H+ leak in the vesicles, which we have not included in the model.
In the simulation the curves correspond to an open channel conductance of 0.1 fS. This value should not be taken as an accurate determination of Hv channel conductance for the reasons discussed above. However, this value is smaller than the reported conductances measured electrophysiologically – 10–100 fS 15 – by a factor too large to be accounted for by the unknown relationship between H+ concentration and fluorescence.
The Specificity of H+ conduction by Hv
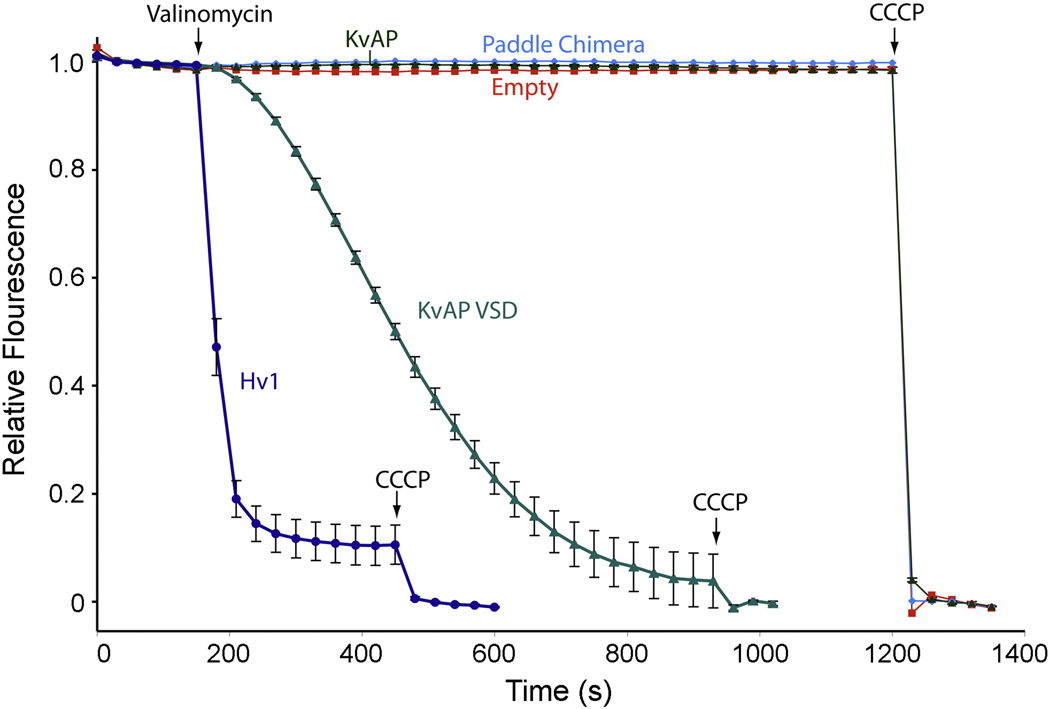
The small conductance inferred from our study (compared to estimates from electrophysiological studies) raises the concern that the H+ flux into the vesicles may be due to a nonspecific leak resulting from the presence of protein in the membranes. To examine this possibility we expressed, purified and reconstituted at equivalent protein to lipid ratios (to match the number of VSDs per vesicle) three additional proteins: full-length KvAP (KvAP), KvAP isolated VSD (KvAP VSD), and Kv1.2–2.1 paddle chimera (paddle chimera). The fluorescence-based H+ flux analysis of these proteins shows that vesicles containing either KvAP or paddle chimera generated very little fluorescence decay (Fig. 4). Because both KvAP and paddle chimera contain K+ pores, the K+ driven membrane potential may well be established before valinomycin addition. Initial fluorescence values with vesicles containing these channels are very similar to other vesicle preparations (Hv or empty), suggesting that no H+ influx occurred before the first point of data collection (data not shown). Interestingly, vesicles containing KvAP VSD exhibited fluorescence decay but at a significantly slower rate than vesicles containing Hv channels (Fig. 4). Sucrose cushions of these vesicles confirmed efficient reconstitution of all proteins (data not shown). These data suggest that the H+ flux through Hv is not simply a manifestation of membrane protein reconstitution into the vesicles. Relatively rapid H+ flux is specific to Hv. The slower H+ flux observed for KvAP VSD might reflect an intrinsic proton conduction potential of the VSD, which is suppressed by its association with the K+ channel pore.
Fig. 4.
Specific H+ permeation through Hv1. Fluorescence-based H+ flux assay for vesicles containing Hv1 (dark blue, n=5), KvAP VSD (green, n=4), KvAP (dark green, n=4), paddle chimera (cyan). Empty vesicles are shown in red. Error bars indicate standard error of the mean. Valinomycin and CCCP are added at the indicated time points. KvAP, KvAP VSD, and paddle chimera channels were expressed and purified according to published procedures 7; 18. Reconstitutions were carried out as described in Fig. 1C legend with the following protein to lipid ratios (wt:wt) 1:200 (KvAP VSD), 1:100 (KvAP), and 1: 50 (paddle chimera).
Conclusions
Further work will be required to determine whether the apparently slower conduction rates reflect differences in conduction versus gating, and whether the differences are related to the Hv protein, lipid membrane, or unknown differences in the electrophysiological versus flux assays. Uncertainties in absolute rates notwithstanding, the data presented here demonstrate that the Hv channel is by itself sufficient to mediate H+ conduction across lipid membranes. The data also lead us to speculate that Hv channels may have evolved as voltage sensors expressed in the absence of a pore since the VSD from KvAP exhibits H+ flux, albeit at a slow rate.
Acknowledgements
We thank X. Tao and J. Butterwick for critical reading. We thank R. Molday (University of British Columbia) for providing the anti-1D4 tag cell line. This work is supported by NIH grant GM 43949 (R.M.). S–Y. Lee is a recipient of the Jane Coffin Childs Memorial Fund, J. Letts is a recipient of a Post Graduate Scholarship M award from the Natural Science and Engineering Research Council of Canada and R.M. is an Investigator in the Howard Hughes Medical Institute.
Footnotes
Publisher's Disclaimer: This is a PDF file of an unedited manuscript that has been accepted for publication. As a service to our customers we are providing this early version of the manuscript. The manuscript will undergo copyediting, typesetting, and review of the resulting proof before it is published in its final citable form. Please note that during the production process errors may be discovered which could affect the content, and all legal disclaimers that apply to the journal pertain.
Reference
- 1.Thomas RC, Meech RW. Hydrogen ion currents and intracellular pH in depolarized voltage-clamped snail neurones. Nature. 1982;299:826–828. doi: 10.1038/299826a0. [DOI] [PubMed] [Google Scholar]
- 2.Decoursey TE. Voltage-gated proton channels and other proton transfer pathways. Physiol Rev. 2003;83:475–579. doi: 10.1152/physrev.00028.2002. [DOI] [PubMed] [Google Scholar]
- 3.DeCoursey TE, Morgan D, Cherny VV. The voltage dependence of NADPH oxidase reveals why phagocytes need proton channels. Nature. 2003;422:531–534. doi: 10.1038/nature01523. [DOI] [PubMed] [Google Scholar]
- 4.Sasaki M, Takagi M, Okamura Y. A voltage sensor-domain protein is a voltage-gated proton channel. Science. 2006;312:589–592. doi: 10.1126/science.1122352. [DOI] [PubMed] [Google Scholar]
- 5.Ramsey IS, Moran MM, Chong JA, Clapham DE. A voltage-gated proton-selective channel lacking the pore domain. Nature. 2006;440:1213–1216. doi: 10.1038/nature04700. [DOI] [PMC free article] [PubMed] [Google Scholar]
- 6.Long SB, Campbell EB, Mackinnon R. Crystal structure of a mammalian voltage-dependent Shaker family K+ channel. Science. 2005;309:897–903. doi: 10.1126/science.1116269. [DOI] [PubMed] [Google Scholar]
- 7.Long SB, Tao X, Campbell EB, MacKinnon R. Atomic structure of a voltage-dependent K+ channel in a lipid membrane-like environment. Nature. 2007;450:376–382. doi: 10.1038/nature06265. [DOI] [PubMed] [Google Scholar]
- 8.Miller C. Biophysics. Lonely voltage sensor seeks protons for permeation. Science. 2006;312:534–535. doi: 10.1126/science.1127186. [DOI] [PubMed] [Google Scholar]
- 9.Zhang J, Feng Y, Forgac M. Proton conduction and bafilomycin binding by the V0 domain of the coated vesicle V-ATPase. J Biol Chem. 1994;269:23518–23523. [PubMed] [Google Scholar]
- 10.Eytan GD. Use of liposomes for reconstitution of biological functions. Biochim Biophys Acta. 1982;694:185–202. doi: 10.1016/0304-4157(82)90024-7. [DOI] [PubMed] [Google Scholar]
- 11.Goldberg AF, Miller C. Solubilization and functional reconstitution of a chloride channel from Torpedo californica electroplax. J Membr Biol. 1991;124:199–206. doi: 10.1007/BF01994354. [DOI] [PubMed] [Google Scholar]
- 12.Heginbotham L, Kolmakova-Partensky L, Miller C. Functional reconstitution of a prokaryotic K+ channel. J Gen Physiol. 1998;111:741–749. doi: 10.1085/jgp.111.6.741. [DOI] [PMC free article] [PubMed] [Google Scholar]
- 13.Rand RP, Parsegian VA. Hydration forces between phospholipid bilayers. Biochimlca et Biophysica Acta. 1989;988:351–376. [Google Scholar]
- 14.Moffat JC, Vijayvergiya V, Gao PF, Cross TA, Woodbury DJ, Busath DD. Proton transport through influenza A virus M2 protein reconstituted in vesicles. Biophys J. 2008;94:434–445. doi: 10.1529/biophysj.107.109082. [DOI] [PMC free article] [PubMed] [Google Scholar]
- 15.DeCoursey TE. Voltage-gated proton channels: what's next? J Physiol. 2008;586:5305–5324. doi: 10.1113/jphysiol.2008.161703. [DOI] [PMC free article] [PubMed] [Google Scholar]
- 16.Ruta V, Jiang Y, Lee A, Chen J, MacKinnon R. Functional analysis of an archaebacterial voltage-dependent K+ channel. Nature. 2003;422:180–185. doi: 10.1038/nature01473. [DOI] [PubMed] [Google Scholar]
- 17.Tamura M, Tamura T, Tyagi SR, Lambeth JD. The superoxide-generating respiratory burst oxidase of human neutrophil plasma membrane. Phosphatidylserine as an effector of the activated enzyme. J Biol Chem. 1988;263:17621–17626. [PubMed] [Google Scholar]
- 18.Jiang Y, Lee A, Chen J, Ruta V, Cadene M, Chait BT, MacKinnon R. X-ray structure of a voltage-dependent K+ channel. Nature. 2003;423:33–41. doi: 10.1038/nature01580. [DOI] [PubMed] [Google Scholar]


