

Abstract
A number of recent studies suggest that mitochondrial function is a player in tumor development and progression. In this study, we have used gene expression arrays to examine transcriptional differences between oxidative phosphorylation (OXPHOS)-competent and OXPHOS-impaired human osteosarcoma cells. Genes associated with extracellular matrix remodeling, including members of the matrix metalloproteinases (MMPs) and tissue inhibitors of the MMP (TIMP) family, urokinase plasminogen activator and its inhibitor plasminogen-activator inhibitor-1 (PAI1), and CTGF and CYR61 (members of the Cysteine-rich 61, Connective Tissue Growth Factor and Nephroblastoma-overexpressed (CCN) gene family of growth regulators), were among the ones significantly altered in the OXPHOS-deficient cells. These changes were confirmed by RT–PCR and promoter reporter assays. Alterations at the protein level for some of these factors were also observed, though at a lower magnitude, with the exception of TIMP1, where a marked change in steady-state levels of the protein was observed after induction of OXPHOS dysfunction. Repopulation of mitochondrial DNA (mtDNA)-less cells with wild-type mtDNA reduced matrigel invasion, whereas repopulation with a mutated mtDNA did not. Taken together our data suggests that OXPHOS dysfunction modulates the invasive phenotype by transcriptional regulation of genes coding for members of the MMP/TIMP system, urokinase plasminogen activator/plasminogen-activator inhibitor I and CCN proteins.
Introduction
The role of mitochondrial DNA (mtDNA) and oxidative phosphorylation (OXPHOS) alterations in tumor growth has been explored for many decades (1,2). However, a number of important discoveries and observations in the last few years suggested that mitochondrial function is a player in tumor development and progression (3,4).
With the exception of multiple lipomas associated with some patients with the myoclonus epilepsy and ragged-red fibers (MERRF) syndrome (5,6), increased cancer prevalence is commonly not reported in patients with mitochondrial defects (7), suggesting that mitochondrial alterations may play a role in the progression rather than in the initiation of tumor growth. Avadhani et al. (8–11) described a mitochondria-to-nucleus stress signaling as a phenomenon initiated by mtDNA depletion and/or membrane damage and disruption of the mitochondrial membrane potential. These alterations would lead to a sustained increase in cytosolic calcium, which would alter expression of several nuclear genes. They also described that a mitochondrial stress was associated with the induction of an invasive phenotype in otherwise non-invasive cancer cells (10,11). Induction of cathepsin L was put forward as a major player for the increased invasiveness (10). In their system, the stress signal appears to involve activation of NFκB/Rel transcription factors by the inactivation of Ikß through calcineurin-mediated dephosphorylation (9).
Their data implicate calcium increase in the cytosol as a key mediator of a more aggressive tumorigenic phenotype. Among different Ca++-activated pathways, there is precedent for increases in cytosolic Ca++ also regulating matrix metalloproteinases (MMPs) expression and activation (12,13). Increased Ca++ has been shown to activate MMP-2 and to stimulate the degradation of tissue inhibitor of metalloproteinase-2 (TIMP 2), (14). MMPs can also be regulated at the transcriptional levels by the calpain inhibitor CP1B (15). We now show that the MMP/TIMP system, as well as the additional extracellular matrix (ECM) remodeling factors, can be regulated at the transcriptional level by OXPHOS activity. These results suggest that specific OXPHOS defects may participate in tumor progression by modulating ECM remodeling processes.
Materials and methods
Cell lines and culture conditions
Human 143B osteosarcoma cells (obtained from ATCC), 143B ρ° cell line, 143B CTM and human embryonic kidney (HEK) 293T cells were cultured in high-glucose Dulbecco’s modified Eagle’s medium supplemented with 10% fetal bovine serum, 100 μg/ml sodium pyruvate and 50 μg/ml of uridine. Treatment with mitochondrial inhibitors was performed by the addition of KCN (1 mM), rotenone (100 nM) or antimycin A (20 nM) to the culture medium. KCN was selected for the microarray experiments because inhibition of cytochrome oxidase at 21% oxygen has been shown to not increase reactive oxygen species (ROS) formation [(16,17) and unpublished observations]. Temporary mtDNA depletion was performed as described previously, by growing cells for 15 days in the presence of EtBr (10 ng/ml) (18). Cells grown in hypoxic conditions were incubated for 6 h in a chamber with 0.5% oxygen and 5% carbon dioxide. 143B CTM cell line was created by fusion of 143B ρ° cell line with human platelets carrying wild-type mtDNA as described previously (19). Southern blot analysis (Figure 1A) and total respiration measurements (data not shown) of 143B CTM cells confirmed repopulation of 143B ρ° cells with mtDNA and recovery of OXPHOS function.
Fig. 1.

OXPHOS defect results in a distinct pattern of gene expression changes. (A) Cell lines with different mtDNA genotypes were analyzed by Southern blot. For relative quantitation, the nuclear 18S rRNA gene was also detected. (B) Boxplot of Lowess M for all genes in each two-color array comparison shows a higher dispersion in the experimental groups than in the control groups. (C) Gene hierarchal clustering of statistically significant genes. Each letter corresponds to the experimental comparison plotted in panel B. Red represents upregulation, blue downregulation and yellow represents no change in gene expression. Samples: 143B, human 143B osteosarcoma cell line; 143B + EtBr, 143B cells grown in EtBr (20 ng/ml) for 15 days; ρ°, 143B cell line devoid of mtDNA; CTM, ρ° repopulated with wild-type mtDNA; Δ143B, homoplasmic cell line harboring mtDNA with a 7.5 kb deletion; Δ143B + EtBr, Δ143B incubated with EtBr (20 ng/ml) for 15 days to deplete mtDNA content; 143B KCN, 143B cells incubated with KCN for the described time points; 143B hypoxia, 143B cells incubated in 0.5% oxygen for 6 h; ρ° + EtBr, ρ° cells grown in EtBr (20 ng/ml) for 15 days.
Southern blot
Southern blot for mtDNA was performed as previously described (20). Briefly, total DNA from cells was purified by phenol extraction. From each sample 5 μg of DNA was digested with PvuII. Southern blot was analyzed using mtDNA probe corresponding to position 3305–4261. As a loading control, a nuclear 18S rDNA probe was used (21). Both probes were radioactively labeled by random priming (Roche, Indianapolis, IN).
Microarray sample handling
Cell culture conditions were strictly followed in order to prevent experimentally induced gene expression changes. For Incyte experiments, total RNA was isolated using TRIZOL reagent (Life Technologies, Rockville, MD). Subsequently, mRNA purification was performed using Oligotex kit (Qiagen, Valencia, CA). The quality of RNA was monitored by Agilent 2100 bioanalyzer before cRNA synthesis. Next, mRNA was labeled using Cy3- or Cy5-labeled probes using LifeArray probe labeling kit (IncyteGenomics, Palo Alto, CA). Incyte human Unigene 1 LifeArrays were hybridized with labeled cRNA at 60°C for 6 h, following the manufacturers’ direction. In order to eliminate dye swap bias, all OXPHOS-deficient samples were labeled with Cy3 and untreated 143B samples were labeled with Cy5. A dye swap experiment was performed for 143B EtBr (labeled with Cy5) versus 143B (labeled with Cy3) to rule out dye bias. Control comparisons (Figure 1B, lanes H–J,) show no significant gene expression changes (Figure 1B), validating the experimental procedure as well as documenting the unremarkable effect of EtBr (10 ng/ml) and KCN on gene expression when no change in OXPHOS function takes place.
For Affymetrix experiments, procedures were followed as presented in the manufacturer’s GeneChip Expression Technical Manual (Affymetrix, Santa Clara, CA). Briefly, TRIZOL was used for RNA isolation according to protocols recommended by the manufacturer. Total RNA in the amount of 5 μg from each sample was used for double-strand cDNA synthesis by linear amplification using oligo dT-T7 primer and reverse transcriptase. Subsequently, biotin-labeled cRNA was generated by in vitro transcription (IVT) using the BioArray HighYield RNA Transcript Labeling Kit (ENZO, Farmingdale, NY) followed by cRNA fragmentation. Prior to hybridizing to the expression arrays, the quality of the hybridization target was determined by hybridization to a Test3 array that indicated the efficacy of the RT/IVT reaction by the ratios of expression level of 5′ to 3′ of housekeeping genes (β-actin and GAPDH). Human U95A, U95B and U95C arrays were hybridized with each of the five labeled samples overnight at 45°C, and then washed, stained and scanned the next day.
Microarray data management and statistical analysis
Incyte Microarray images were acquired and analyzed using Genepix Pro 5.1 (Axon B Instruments, Union City, CA). For global normalization, locally weighted scatter plot smoothing (LOWESS, Cleveland, OH) was used (22). Data was then filtered for unreliable data points (irregular geometry, scratched, signal-to-noise ratio <3 and/or saturated signal) using Acuity software (Axon Instruments, Union City, CA). Filtered data was then imported into Gene-Spring software for further statistical analysis (Silicon Genetics, Redwood City, CA). The seven OXPHOS-deficient arrays were pooled and considered as replicate arrays since all treatments resulted in an OXPHOS defect. In this way, gene expression changes induced by any particular treatment would not be considered. Control arrays did not result in any significant gene expression changes and were therefore also pooled and considered as triplicate arrays and used subsequently for statistical analysis. One-way ANOVA was applied to these two groups. For multiple testing correction method, Benjamini and Hochberg (23) false discovery rate procedure was applied and genes with a P-value <0.01 were considered significantly differentially expressed in OXPHOS-deficient cells. Gene tree clustering, applying spearman correlation, was then applied on statistically significant genes (P < 0.01). Boxplot was generated using Sigmaplot software (Systat Software, Point Richmond, CA) by plotting lowess M [log ratios of F635 (Cy5) over F532 (Cy3) channel] for each gene in every array.
The Affymetrix dataset was normalized by scaling the target intensity to 150 using Microarray Suite 5.1 (Affymetrix). Data was imported into Genespring, each array was then normalized to the 50th percentile and each gene was normalized to the 143B sample intensity in order to obtain fold changes. U95A, B and C arrays for each condition were pooled and considered as replicates and subjected to one-sample t-test to obtain a gene list of statistically significant gene expression changes induced by OXPHOS dysfunction in all arrays. Functional classification of genelists was performed using Onto-express (24,25) according to biological processes in the Gene-Ontology (GO) category.
Confirmation of transcriptional changes by real-time RT–PCR
Total RNA was isolated from cells grown at 80% confluency using TRIZOL reagent (Life Technologies). cDNA was synthesized by the use of Superscript First-strand Synthesis system (Invitrogen Carlsbad, CA). Quantitative real-time RT–PCR was performed following the guidelines described previously (26,27). Briefly, quantification of relative transcript levels for MMP1, TIMP1, TIMP2, urokinase plasminogen activator (uPA), connective tissue growth factor (CTGF), plasminogen-activator inhibitor I (PAI1), cysteine-rich angiogenic inducer 61 (CYR61), and the housekeeping gene β-actin in the cDNA samples was performed and analyzed using a LightCycler instrument (Rotorgene, Mortlake, Australia). Primer pairs used are shown in Table I. Real-time RT–PCRs contained SYBR® Green (Molecular Probes, Eugene, OR) as the DNA intercalating fluorescent dye. Generally cDNA samples were amplified with an initial Taq DNA polymerase activation step at 95°C for 10 min, followed by 45 cycles of denaturation at 95°C for 20 s, annealing at 60°C for 20 s and extension at 72°C for 20 s, followed by acquisition of SYBR fluorescence. For each gene, Ct values were obtained in triplicates. For gene normalization, a standard curve was generated by parallel amplification of 1:4 serial dilutions of a randomly chosen cDNA sample for each amplicon. To normalize for variations in RNA amounts and reverse transcription efficacies, transcript levels of the housekeeping gene β-actin were determined. Relative transcript levels were determined as the ratio between the gene of interest and β-actin mRNA content of the sample. Fold change was subsequently determined by normalizing each sample to 143B.
Table I.
Oligonucleotide primers and probe sequences used for RT–PCR
| Gene | Sequences | Product (bp) |
|---|---|---|
| MMP1 | F-ATAACTACGATTCGGGGAGA R-GCCAGAAAACAGAAATGAAA |
106 |
| PAI1 | F-TGCTGGTGAATGCCCTCTACT R-CGGTCATTCCCAGGTTCTCTA |
399 |
| uPA | F-CACGCAAGGGGAGATGAA R-ACAGCATTTTGGTGGTGACTT |
332 |
| TIMP-1 | F-CTGTTGTTGCTGTGGCTGATA R-CCGTCCACAAGCAATGAGT |
470 |
| CYR61 | F-ACTTCATGGTCCCAGTGCTC R-AAATCCGGGTTTCTTTCACA |
88 |
| CTGF | F-GCAGGCTAGAGAAGCAGAGC R-ATGTCTTCATGCTGGTGCAG |
153 |
| β-Actin | F-GCGTGACATTAAGGAGAAGC R-ATGCCAGGGTACATGGTGGT |
300 |
Western blot/protein level determination
For ECM proteins, cells were seeded at 80% confluency. Next day the cells were washed and replaced with DMEM and 0.5% FCS. Conditioned media was collected after 48 h of incubation. Samples were run in an SDS–PAGE gel and transferred to a PVDF membrane (Biorad, Hercules, CA). Subsequently, the membrane was incubated with human MMP1 (OPA1-08012, Affinity Bioreagents, Golden, CO) and TIMP1 (IM32T, EMD Biosciences, San Diego, CA) antibodies. The immunoblots were developed by chemiluminescence after incubation with the appropriate secondary antibody.
Reporter gene assay
For luciferase reporter assays, human embryonic kidney 293T cells were used because of their high transfection efficiency. MMP1, TIMP1 and TIMP2 luciferase reporter plasmids were obtained as reported previously (28,29). For normalization, β-galactosidase (β-gal) gene under CMV promoter was used. Briefly, 6 × 10⁴ cells, well-plated and cultured in growth media overnight, were transfected with 1 μg/well of MMP1, TIMP1 or TIMP2 reporter plasmid and 0.1 μg/well of β-gal expressing plasmid (pSV-βgal, Promega) by using Fugene6 reagent (Roche Diagnostics, Indianapolis, IN). After 12 h incubation, the Fugene–DNA solution was replaced with growth media with or without OXPHOS inhibitors (1 mM KCN, 100 nM rotenone or 20 nM antimycin A) for 30 h. The cells were then harvested and luciferase and β-gal activities in the cell lysate were determined using Tropix ® Dual-Light ® luminescent reporter gene assay system (Applied Biosystems, Foster City, CA). Promoter activity was expressed as luciferase activity normalized to β-gal activity.
In vitro invasion assay
Invasive potential of cells was assessed using 8 μm Matrigel invasion chamber (BD Biosciences, USA). In 0.5 ml of serum-free DMEM media ~2 × 10⁴ cells were seeded in the top chamber. The bottom of the well was filled with 0.75 ml of DMEM supplemented with 10% FBS as a chemo-attractant. After 24–36 h of incubation, non-invasive cells present on the upper surface of the filter were wiped out with a cotton swab. The invasive cells that migrated onto the lower surface of the filter were fixed and stained with Diff-Quick (Dade Behring, Newark, Delaware) and placed on coverslips, and the number of invading cells were counted under a light microscope. BB-94 was added to the cells at a final concentration of 1 nmol/l (30).
Results
Changes in gene expression triggered by OXPHOS dysfunction
We performed genome wide cDNA microarray experiments to identify changes in the transcriptome triggered by OXPHOS dysfunction. For this, we used two platforms (Incyte and Affymetrix) of microarray technologies to reduce platform-specific bias. Initially, we performed Incyte two-color experiments comparing gene expression changes between cells harboring OXPHOS dysfunction and normal osteosarcoma 143B cells. In order to eliminate errors due to cell culture conditions or aneuploidy, seven arrays were performed comparing normal 143B cells with 143B cells with an OXPHOS defect. Different genetic and pharmacological models of OXPHOS dysfunction were used (Figure 1B): lane A, 143B cells treated with 50 ng/ml EtBr for 15 days which depletes the cells of mtDNA; lane B, 143B ρ° cell line (a cell line devoid of mtDNA); lanes C–E, 143B cells treated for 2, 6 and 24 h with an inhibitor of complex IV, potassium cyanide (1 mg/ml, KCN); lane F, 143BΔ, a cybrid cell line containing a homoplasmic 7.9 kb deletion in its mtDNA; and lane G, 143B grown under hypoxic conditions for 6 h. This latter treatment blocks oxidative ATP production similarly to OXPHOS inhibitors, but it can be influenced by the activation of HIF1α. All these conditions were hybridized/compared with 143B cell line grown under normal conditions. In addition, three control experiments were performed to rule out drug-induced gene expression changes: lane H, 143B ρ° cells treated with EtBr for 15 days compared with untreated 143B ρ° cells (EtBr treatment control); lane I, 143B ρ° cells treated with KCN for 24 h compared with untreated 143B ρ° cells (KCN treatment control); and lane J, 143BΔ cybrid cells treated with EtBr for 15 days compared with untreated 143BΔ cells. Since this latter cybrid is respiratory-impaired, this control could address gene expression changes induced by loss of mtDNA but not of OXPHOS). Southern blot analysis of cells with a mtDNA alteration (quantitative or qualitative) is depicted in Figure 1A. Figure 1B shows a boxplot for each microarray, showing the level of differences in gene expression for each experimental pair. The boxplot shows the dispersion of the data in each array. Each box contains 50% of the dataset for each array and the middle line represents the median of the ratios for all genes. Dots outside the box represent genes with fold changes outside of the 50th percentile of genes.
OXPHOS dysfunction versus normal respiration arrays (lanes A–G) resulted in gene expression changes that were significantly larger than the ones observed in control arrays (lanes H–J). These results confirm that EtBr or KCN did not induce significant effects on gene expression when no changes in OXPHOS function took place. Furthermore, 143BΔ cybrid depleted of mtDNA by EtBr when compared with untreated 143BΔ cybrid cells (lane J) did not result in significant gene expression changes. This suggests that loss of the mutated mtDNA per se (without any change in OXPHOS function) has a more modest effect on the cell transcriptome.
The different OXPHOS dysfunction two-color arrays were analyzed as replicates to rule out any treatment or cell-specific noise. Control arrays were also analyzed as one group. Therefore, there were five arrays for OXPHOS-deficient cells and three for the control cells. One-way ANOVA was performed for these groups and 338 genes were found to have gene expression changes associated with OXPHOS dysfunction with P-values < 0.01 in all treatments analyzed compared with the controls (Supplementary Table 1). Clustering analysis also showed OXPHOS dysfunction-induced gene expression changes that were common to all treatments (lanes A–F) and the changes were not seen in control arrays (lanes H–J) (Figure 1C).
To rule out platform-specific bias, we performed one-color arrays (U95A-C Affymetrix) for a more limited number of samples. We analyzed 143B, 143B treated with EtBr, 143BΔ, ρ° and ρ° treated with EtBr samples. This analysis resulted in 222 genes differentially expressed between OXPHOS dysfunction group and 143B cells with ANOVA P-values < 0.01 (Supplementary Table 2). Statistically significant genes for both platforms could be grouped into similar distinct functional groups (Figure 2).
Fig. 2.

Functional groups of differentially expressed genes in OXPHOS-deficient osteosarcoma cells. Statistically significant differentially expressed genes (P <0.01) that were common for the different treatment groups were grouped by their known function using the Onto-express software package. Both two-color (A) and Affymetrix (B) results gave a similar pattern of differentially expressed genes when grouped by biological processes.
ECM remodeling genes are differentially expressed due to OXPHOS dysfunction
From microarray studies, several genes involved in ECM remodeling as well as a few genes known to participate in neoplastic transformation were differentially expressed under OXPHOS dysfunction. Of particular interest, MMP1 was upregulated and two of its natural inhibitors, TIMPs 1 and 2, were downregulated in cells that had an OXPHOS defect. In order to confirm these results, we performed real-time RT–PCR on total RNA from the normal 143B cell line, 143B cell line treated for 14 days with EtBr and the ρ° cell line. Figure 3 summarizes the gene expression data obtained by Incyte, Affymetrix and real-time RT–PCR experiments. Additional genes with known role in tumorigenesis that were also differentially expressed and upregulated in OXPHOS-deficient cells include CTGF, uPA, PAI 1 and CYR61.
Fig. 3.

ECM remodeling and proliferation related genes are differentially expressed in OXPHOS-deficient conditions. Histogram shows fold change of gene expression between 143B, 143B + EtBr and ρ° relative to 143B levels obtained by quantitative real-time RT–PCR and microarray experiments (Incyte or Affymetrix). For real-time RT–PCR, a standard curve was performed for each amplification reaction. Relative β-actin amplification was used to normalize mRNA content in each sample. Fold changes are expressed as transcript level relative to β-actin. The fold changes for Incyte arrays were derived after applying lowess normalization to each array. Each array represents a comparison between an OXPHOS-deficient sample and 143B. For Affymetrix results, fold changes were derived after normalization of each sample array to 143B sample array. For more details refer to the Materials and methods section. Cell lines and conditions are equivalent to the ones used in Figure 1.
To determine whether the changes observed at the transcriptional level in osteosarcoma cells were reflected at the protein level, we performed western blot assays. These experiments showed that OXPHOS dysfunction was associated with a mild increase in the steady-state levels of MMP1 but a marked decrease in the levels of TIMP1 in OXPHOS-deficient cells (Figure 4).
Fig. 4.
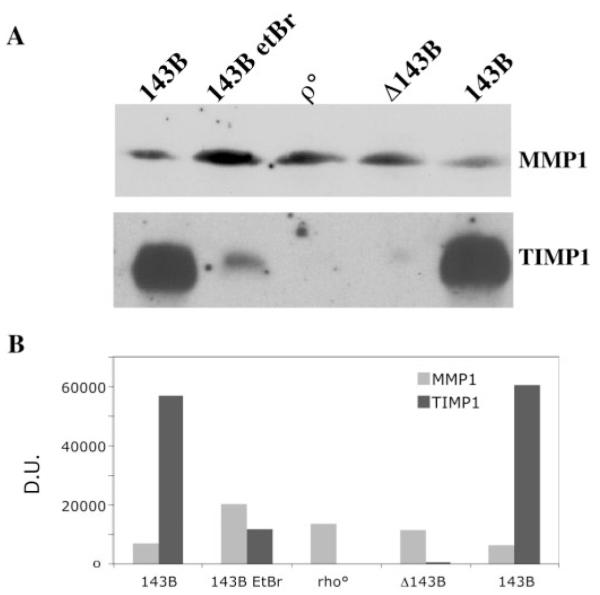
MMP1 and TIMP1 protein levels vary between normal and OXPHOS-deficient cells. To study the levels of MMP1 and TIMP1, conditioned media was prepared as described in Materials and methods and analyzed by PAGE/western blot. Cell lines and conditions are equivalent to the ones used in Figure 1. After transfer, Ponceau red staining confirmed equal loading of the protein. There was a marked decrease in TIMP1 in cells with defective OXPHOS.
In order to confirm these results in a different cell type, the HEK 293T cell line was used in reporter assays. This cell line was used because of its high transfection efficiency, which unfortunately could not be achieved with the osteosarcoma cells. Full-length MMP1, TIMP1 and TIMP2 luciferase reporter constructs were transfected into 293T cells and OXPHOS dysfunction was induced by chemical treatment with OXPHOS inhibitors (KCN, rotenone or Antimycin A). 293T cell line had undetectable levels of MMP1 mRNA (determined by real-time RT–PCR, data not shown), and therefore the MMP1 promoter gave a very weak signal in 293T cells (Figure 4). Nevertheless, the promoter was stimulated by the treatment with respiratory inhibitors. TIMP1 and TIMP2 expression was downregulated in 293T cells after drug-induced OXPHOS dysfunction (Figure 5). These data further support our results obtained with 143B osteosarcoma cells and suggest a common mechanism in which cells undergoing OXPHOS dysfunction or under hypoxic conditions stimulate ECM remodeling, which in vivo could lead to neovascularization or invasion into a more favorable environment, or better availability of growth factors (31).
Fig. 5.

Differential gene expression of MMP1, TIMP1 and TIMP2 is induced by OXPHOS inhibitors in 293T cells. Luciferase reporter gene assays for full-length promoters of MMP1 (panel A), TIMP1 (panel B) and TIMP2 (panel C) were performed in 293T cells. Briefly, cells were transfected with plasmids containing the luciferase gene under the control of either MMP1, TIMP1 or TIMP2 full-length promoters and a β-gal expressing plasmid as a control. The media was replaced 12 h after transfection and cells were incubated with growth media alone or with OXPHOS inhibitors (1 mM KCN, 100 nM rotenone or 20 nM antimycin (A) for 30 h. Cells were then collected and luciferase and β-gal content was determined. Data represent the relative luciferase units (LU) obtained for each construct, normalized by the β-gal signal (mean ± SD, n = 3).
OXPHOS competence decreases the matrigel invasive phenotype of osteosarcoma cells
We also investigated whether changes triggered by an OXPHOS defect were robust enough to alter the invasive phenotype in a matrigel invasion assay. We compared the invasiveness of an osteosarcoma cell line devoid of mtDNA (ρ° line) and the same cell line after its repopulation with either a functional mtDNA (wild-type CTM) or a defective mtDNA (harboring a MELAS disease-related A3243G mutation). The ρ° cell line showed a marked increase in invasion compared with the 143B cell line. Likewise, the repopulation with a wild-type mtDNA rendered the ρ° cell less invasive, whereas the repopulation with the MELAS mtDNA did not reduce invasiveness on matrigel (Figure 6). A wide-spectrum MMP inhibitor (BB-94) reduced matrigel invasion of the ρ° cell line (Figure 6). These results suggest that OXPHOS function play a role in the invasive phenotype of the ρ° cell line.
Fig. 6.

Effects of mtDNA on invasive potential of ρ° cells. The invasive behavior of a ρ° cell line and the same cell line, repopulated with wild-type mtDNA (ρ° CTM) or mutant mtDNA (ρ° MELAS), were compared. Approximately 2 × 10⁴ cells/well were seeded in the upper compartment of an 8 μm Matrigel invasion chamber. After 24 h incubation, the cells on the lower surface of the filter were stained, and the number of cells was counted. The top panel shows representative images (n >6) of migrating cells for each cell line. Lower panel represents quantification of the number of cells migrated per field. Total numbers of the migrated cells are shown as mean ± SD (n = 3). BB-94 (batimastat), an inhibitor of MMPs was used at a concentration of 1 nmol/l.
Discussion
Although several studies have implicated OXPHOS dysfunction in tumorigenesis, the molecular mechanism underlying this relationship remains undetermined. In order to shed light into the cellular processes taking place during OXPHOS dysfunction, genome wide cDNA microarray experiments were performed. To minimize cell-to-cell variations we performed different treatments that cause OXPHOS defects, including mtDNA depletion, no mtDNA and a defective mtDNA. We also analyzed cells exposed to KCN, a pharmacological inhibitor of complex IV.
Microarray studies revealed that differences in gene expression clustered in OXPHOS-deficient cells, indicating a common global effect on gene expression. Some of the highly significant genes were involved in extracellular remodeling and we confirmed these changes by quantitative RT–PCR. Notably, the transcription of MMP1 was highly increased, even though we were able to detect only a modest increase at the protein level by western blots. Nevertheless, Kermorgant et al. (32) showed that MMP1 participated in matrigel invasion of Caco-2 cells. Conversely, the transcription of TIMP1, an inhibitor of MMPs was decreased in our OXPHOS-deficient cells, not only at the transcriptional level but also at the protein level. In addition to its effect on transcription, OXPHOS dysfunction could have an activating effect on ECM remodeling by having an impaired calcium buffering capacity (8,33). Ca++ is a known activator of MMPs function (13,14). This could further explain the increase in invasive phenotype observed in mtDNA-deficient cells.
The increased invasiveness of OXPHOS-deficient cells has been documented in several studies, and it was previously attributed to cathepsin L overexpression (8,10,11). Our results suggest that in osteosarcoma cells, the transcription of genes belonging to the MMP/TIMP system is also modulated by OXPHOS function. In addition, uPA and its inhibitor PAI1, well-established markers of invasive phenotype (34), had increased transcripts in OXPHOS-deficient cells. Likewise, CTGF and CYR61 were upregulated in OXPHOS-deficient cells. CTGF and CYR61 are part of the CCN family of regulatory factors (the name was coined from CYR6, CTGF and Nov) involved in many aspects of cell proliferation and differentiation. An increasing body of evidence indicates that abnormal expression of the CCN proteins is associated with tumorigenesis (35). Increase in the expression of MMPs has also been observed in LMTK− mouse cells harboring mtDNA dimers, which exhibited decreased respiration (36). Parker and colleagues also showed that PAI1 was increased in a 143B-derived ρ° cell, a result confirmed by our studies (37). Miceli et al. (38), using quantitative RT–PCR, showed alterations in COL1A1 and COL4A1 (collagen type I alpha 1 and type IV alpha 1) in osteosarcoma ρ° cells, suggesting that additional factors may participate in the increased invasive phenotype.
OXPHOS defects could have an important role in cell migration and invasion. Because OXPHOS dysfunction somehow mimics lack of oxygen (e.g. both cause increased lactate production and acidification of extracellular environment), which is a common occurrence in solid tumors, one could speculate that cells may have evolved a ‘get me out of here’ response, which would allow them to migrate to a more favorable environment, a concept previously explored in the hypoxia field (39–41). Although increased angiogenesis and glucose uptake can be triggered by a block in post-translational modification of the hypoxia inducing factor 1 alpha (HIF1α) (42), our results suggest that there may be a more direct mechanism to activate genes involved in remodeling of the ECM when oxidative metabolism is absent. In fact, Darwinian pressure at the cellular level may select for parallel mechanisms that act in concert to promote cell survival. Godinot et al. (43,44) have shown that defects in OXPHOS correlated to aggressive phenotype of renal carcinomas. Recently, Petros et al. (45) showed that prostate cancer cells have significantly high rates of COXI (cytochrome oxidase subunit I) mutations, which cause OXPHOS dysfuntion. In the same study they showed that PC3 prostate cancer cells harboring homoplasmic levels of a mtDNA mutation in ATPase 6 generated tumors in nude mice that were larger than cells harboring wild-type mtDNA, and that these tumors generated significantly higher ROS, suggesting that mtDNA mutations that affect OXPHOS and increase ROS production could contribute to tumor promotion (45). Shidara et al. (46) showed similar results with cybrids harboring two different mtDNA mutations in the ATPase 6 gene.
The mechanism by which OXPHOS deficiency can lead to transcription activation of ECM remodeling genes is unclear. Constitutive activity of transcriptional factors NF-κB and AP1 has been correlated to some highly invasive cancers (47). NF-κB/Rel activation has been shown to be induced by OXPHOS dysfunction (9,48). It is also well established that MMP1, uPA, PAI1 as well as TIMP1 have binding sites for NF-κB as well as AP1 in their promoters (47,49–54). AP1 binding motif within CYR61 also seems to play a central role in the hypoxic regulation of this gene (55).
Although OXPHOS-generated ROS and the levels of superoxide dismutase 2 (SOD2) appear to regulate gene expression of ECM remodeling genes (49,51,56), an OXPHOS effect independent of ROS formation has also been described (48). Recently, it was shown that wild-type von Hippel–Lindau tumor suppressor protein (a regulator of HIF1α) increased mitochondrial DNA and respiratory chain protein contents, providing a link between HIF1α and OXPHOS transcriptional modulation pathways (57).
Our results further suggest that OXPHOS dysfunction associated with mtDNA mutations, which are increasingly being observed in tumor cells, could participate in the development of invasive phenotypes. Although ECM remodeling is a complex process, involving a large number of components, we conclude that OXPHOS function is an important player in regulating the transcriptional and steady-state levels of a subset of ECM remodeling factors.
Supplementary Material
Acknowledgements
The authors are grateful to the University of Miami Gene Array Facility for help with microarray scanning and processing. This work was supported by Public Health Service grants CA-85700 from the National Cancer Institute and EY-10804 from the National Eye Institute.
Abbreviations
- CCN
members of the cysteine-rich 61 connective tissue growth factor and nephroblastoma-overexpressed gene/protein family
- CPI
calpain inhibitor
- CTGF
connective tissue growth factor
- CYR61
cysteine-rich angiogenic inducer 61
- ECM
extracellular matrix
- HEK
human embryonic kidney
- HIF
hypoxia inducing factor
- IVT
in vitro transcription
- MMP
matrix metalloproteinases
- MERRF
myoclonus epilepsy and ragged-red fibers
- mtDNA
mitochondrial DNA
- OXPHOS
oxidative phosphorylation
- PAI1
plasminogen-activator inhibitor I
- ROS
reactive oxygen species
- SOD2
superoxide dismutase 2
- TIMP
tissue inhibitor of metalloproteinase
- uPA
urokinase plasminogen activator
Footnotes
Supplementary material Supplementary material is available online at http://www.carcin.oxfordjournals.org/
Conflict of Interest Statement: None declared.
References
- 1.Kalckar HM. 50 years of biological research—from oxidative phosphorylation to energy requiring transport regulation. Annu. Rev. Biochem. 1991;60:1–37. doi: 10.1146/annurev.bi.60.070191.000245. [DOI] [PubMed] [Google Scholar]
- 2.Gause GF. Cancer and mitochondrial DNA. Br. Med. J. 1969;3:413–414. doi: 10.1136/bmj.3.5667.413-c. [DOI] [PMC free article] [PubMed] [Google Scholar]
- 3.Jiang X, Wang X. Cytochrome c-mediated apoptosis. Annu. Rev. Biochem. 2004;73:87–106. doi: 10.1146/annurev.biochem.73.011303.073706. [DOI] [PubMed] [Google Scholar]
- 4.Liu VW, Shi HH, Cheung AN, Chiu PM, Leung TW, Nagley P, Wong LC, Ngan HY. High incidence of somatic mitochondrial DNA mutations in human ovarian carcinomas. Cancer Res. 2001;61:5998–6001. [PubMed] [Google Scholar]
- 5.Holme E, Larsson NG, Oldfors A, Tulinius M, Sahlin P, Stenman G. Multiple symmetric lipomas with high levels of mtDNA with the tRNA(Lys) A→G(8344) mutation as the only manifestation of disease in a carrier of myoclonus epilepsy and ragged-red fibers (MERRF) syndrome. Am. J. Hum. Genet. 1993;52:551–556. [PMC free article] [PubMed] [Google Scholar]
- 6.Silvestri G, Ciafaloni E, Santorelli FM, Shanske S, Servidei S, Graf WD, Sumi M, DiMauro S. Clinical features associated with the A→G transition at nucleotide 8344 of mtDNA (“MERRF mutation”) Neurology. 1993;43:1200–1206. doi: 10.1212/wnl.43.6.1200. [DOI] [PubMed] [Google Scholar]
- 7.Taylor RW, Turnbull DM. Mitochondrial DNA mutations in human disease. Nat. Rev. Genet. 2005;6:389–402. doi: 10.1038/nrg1606. [DOI] [PMC free article] [PubMed] [Google Scholar]
- 8.Biswas G, Adebanjo OA, Freedman BD, Anandatheerthavarada HK, Vijayasarathy C, Zaidi M, Kotlikoff M, Avadhani NG. Retrograde Ca2+ signaling in C2C12 skeletal myocytes in response to mitochondrial genetic and metabolic stress: a novel mode of inter-organelle crosstalk. EMBO J. 1999;18:522–533. doi: 10.1093/emboj/18.3.522. [DOI] [PMC free article] [PubMed] [Google Scholar]
- 9.Biswas G, Anandatheerthavarada HK, Zaidi M, Avadhani NG. Mitochondria to nucleus stress signaling: a distinctive mechanism of NFkappaB/Rel activation through calcineurin-mediated inactivation of IkappaBbeta. J. Cell Biol. 2003;161:507–519. doi: 10.1083/jcb.200211104. [DOI] [PMC free article] [PubMed] [Google Scholar]
- 10.Amuthan G, Biswas G, Zhang SY, Klein-Szanto A, Vijayasarathy C, Avadhani NG. Mitochondria-to-nucleus stress signaling induces phenotypic changes, tumor progression and cell invasion. EMBO J. 2001;20:1910–1920. doi: 10.1093/emboj/20.8.1910. [DOI] [PMC free article] [PubMed] [Google Scholar]
- 11.Amuthan G, Biswas G, Ananadatheerthavarada HK, Vijayasarathy C, Shephard HM, Avadhani NG. Mitochondrial stress-induced calcium signaling, phenotypic changes and invasive behavior in human lung carcinoma A549 cells. Oncogene. 2002;21:7839–7849. doi: 10.1038/sj.onc.1205983. [DOI] [PubMed] [Google Scholar]
- 12.Wada Y, Kato S, Okamoto K, Izumaru S, Aoyagi S, Morimatsu M. Diltiazem, a calcium antagonist, inhibits matrix metalloproteinase-1 (tissue collagenase) production and collagenolytic activity in human vascular smooth muscle cells. Int. J. Mol. Med. 2001;8:561–566. doi: 10.3892/ijmm.8.5.561. [DOI] [PubMed] [Google Scholar]
- 13.Winberg JO, Berg E, Kolset SO, Uhlin-Hansen L. Calcium-induced activation and truncation of promatrix metalloproteinase-9 linked to the core protein of chondroitin sulfate proteoglycans. Eur. J. Biochem. 2003;270:3996–4007. doi: 10.1046/j.1432-1033.2003.03788.x. [DOI] [PubMed] [Google Scholar]
- 14.Munshi HG, Wu YI, Ariztia EV, Stack MS. Calcium regulation of matrix metalloproteinase-mediated migration in oral squamous cell carcinoma cells. J. Biol. Chem. 2002;277:41480–41488. doi: 10.1074/jbc.M207695200. [DOI] [PubMed] [Google Scholar]
- 15.Popp O, Heidinger M, Ruiz-Heinrich L, Ries C, Jochum M, Gil-Parrado S. The calpastatin-derived calpain inhibitor CP1B reduces mRNA expression of matrix metalloproteinase-2 and -9 and invasion by leukemic THP-1 cells. Biol. Chem. 2003;384:951–958. doi: 10.1515/BC.2003.107. [DOI] [PubMed] [Google Scholar]
- 16.Barrientos A, Moraes CT. Titrating the effects of mitochondrial complex I impairment in the cell physiology. J. Biol. Chem. 1999;274:16188–16197. doi: 10.1074/jbc.274.23.16188. [DOI] [PubMed] [Google Scholar]
- 17.Palacios-Callender M, Quintero M, Hollis VS, Springett RJ, Moncada S. Endogenous NO regulates superoxide production at low oxygen concentrations by modifying the redox state of cytochrome c oxidase. Proc. Natl Acad. Sci. USA. 2004;101:7630–7635. doi: 10.1073/pnas.0401723101. [DOI] [PMC free article] [PubMed] [Google Scholar]
- 18.King MP. Use of ethidium bromide to manipulate ratio of mutated and wild-type mitochondrial DNA in cultured cells. Methods Enzymol. 1996;264:339–344. doi: 10.1016/s0076-6879(96)64032-4. [DOI] [PubMed] [Google Scholar]
- 19.Moraes CT, Dey R, Barrientos A. Transmitochondrial technology in animal cells. Methods Cell Biol. 2001;65:397–412. doi: 10.1016/s0091-679x(01)65023-4. [DOI] [PubMed] [Google Scholar]
- 20.Diaz F, Bayona-Bafaluy MP, Rana M, Mora M, Hao H, Moraes CT. Human mitochondrial DNA with large deletions repopulates organelles faster than full-length genomes under relaxed copy number control. Nucleic Acids Res. 2002;30:4626–4633. doi: 10.1093/nar/gkf602. [DOI] [PMC free article] [PubMed] [Google Scholar]
- 21.Moraes CT, Shanske S, Tritschler HJ, Aprille JR, Andreetta F, Bonilla E, Schon EA, DiMauro S. mtDNA depletion with variable tissue expression: a novel genetic abnormality in mitochondrial diseases. Am. J. Hum. Genet. 1991;48:492–501. [PMC free article] [PubMed] [Google Scholar]
- 22.Yang YH, Dudoit S, Luu P, Lin DM, Peng V, Ngai J, Speed TP. Normalization for cDNA microarray data: a robust composite method addressing single and multiple slide systematic variation. Nucleic Acids Res. 2002;30:e15. doi: 10.1093/nar/30.4.e15. [DOI] [PMC free article] [PubMed] [Google Scholar]
- 23.Benjamini Y, Hochberg Y. Controlling the false discovery rate: a practical and powerful approach to multiple testing. J. Roy. Stat. Soc. Series B. 1995;57:289–230. [Google Scholar]
- 24.Draghici S, Khatri P, Martins RP, Ostermeier GC, Krawetz SA. Global functional profiling of gene expression. Genomics. 2003;81:98–104. doi: 10.1016/s0888-7543(02)00021-6. [DOI] [PubMed] [Google Scholar]
- 25.Khatri P, Draghici S, Ostermeier GC, Krawetz SA. Profiling gene expression using onto-express. Genomics. 2002;79:266–270. doi: 10.1006/geno.2002.6698. [DOI] [PubMed] [Google Scholar]
- 26.Deprez R.H. Lekanne, Fijnvandraat AC, Ruijter JM, Moorman AF. Sensitivity and accuracy of quantitative real-time polymerase chain reaction using SYBR green I depends on cDNA synthesis conditions. Anal Biochem. 2002;307:63–69. doi: 10.1016/s0003-2697(02)00021-0. [DOI] [PubMed] [Google Scholar]
- 27.Marino JH, Cook P, Miller KS. Accurate and statistically verified quantification of relative mRNA abundances using SYBR Green I and real-time RT-PCR. J. Immunol. Methods. 2003;283:291–306. doi: 10.1016/s0022-1759(03)00103-0. [DOI] [PubMed] [Google Scholar]
- 28.Sun Y, Zeng XR, Wenger L, Firestein GS, Cheung HS. P53 down-regulates matrix metalloproteinase-1 by targeting the communications between AP-1 and the basal transcription complex. J. Cell Biochem. 2004;92:258–69. doi: 10.1002/jcb.20044. [DOI] [PubMed] [Google Scholar]
- 29.Bai G, Howell DS, Howard GA, Roos BA, Cheung HS. Basic calcium phosphate crystals up-regulate metalloproteinases but down-regulate tissue inhibitor of metalloproteinase-1 and -2 in human fibroblasts. Osteoarthritis Cartilage. 2001;9:416–422. doi: 10.1053/joca.2000.0407. [DOI] [PubMed] [Google Scholar]
- 30.Zempo N, Koyama N, Kenagy RD, Lea HJ, Clowes AW. Regulation of vascular smooth muscle cell migration and proliferation in vitro and in injured rat arteries by a synthetic matrix metalloproteinase inhibitor. Arterioscler Thromb. Vasc. Biol. 1996;16:28–33. doi: 10.1161/01.atv.16.1.28. [DOI] [PubMed] [Google Scholar]
- 31.Dallas SL, Sivakumar P, Jones CJ, Chen Q, Peters DM, Mosher DF, Humphries MJ, Kielty CM. Fibronectin regulates latent transforming growth factor-beta (TGF beta) by controlling matrix assembly of latent TGF beta-binding protein-1. J. Biol. Chem. 2005;280:18871–18880. doi: 10.1074/jbc.M410762200. [DOI] [PubMed] [Google Scholar]
- 32.Kermorgant S, Aparicio T, Dessirier V, Lewin MJ, Lehy T. Hepatocyte growth factor induces colonic cancer cell invasiveness via enhanced motility and protease overproduction. Evidence for PI3 kinase and PKC involvement. Carcinogenesis. 2001;22:1035–1042. doi: 10.1093/carcin/22.7.1035. [DOI] [PubMed] [Google Scholar]
- 33.Brini M, Pinton P, King MP, Davidson M, Schon EA, Rizzuto R. A calcium signaling defect in the pathogenesis of a mitochondrial DNA inherited oxidative phosphorylation deficiency. Nat. Med. 1999;5:951–954. doi: 10.1038/11396. [DOI] [PubMed] [Google Scholar]
- 34.Harbeck N, Thomssen C. u-Plasminogen activator (urinary plasminogen activator, urokinase) (uPA) and its PA-1 type 1 inhibitor are not only prognostically but also predictively significant and support clinical decisions on therapy in primary carcinoma of the breast. Zentralbl Gynakol. 2003;125:362–367. doi: 10.1055/s-2003-43036. [DOI] [PubMed] [Google Scholar]
- 35.Planque N, Perbal B. A structural approach to the role of CCN (CYR61/CTGF/NOV) proteins in tumourigenesis. Cancer Cell Int. 2003;3:15. doi: 10.1186/1475-2867-3-15. [DOI] [PMC free article] [PubMed] [Google Scholar]
- 36.Clark KM, Brown TA, Davidson MM, Papadopoulou LC, Clayton DA. Differences in nuclear gene expression between cells containing monomer and dimer mitochondrial genomes. Gene. 2002;286:91–104. doi: 10.1016/s0378-1119(01)00805-8. [DOI] [PubMed] [Google Scholar]
- 37.Park SY, Choi B, Cheon H, Pak YK, Kulawiec M, Singh KK, Lee MS. Cellular aging of mitochondrial DNA-depleted cells. Biochem. Biophys. Res. Commun. 2004;325:1399–1405. doi: 10.1016/j.bbrc.2004.10.182. [DOI] [PubMed] [Google Scholar]
- 38.Miceli MV, Jazwinski SM. Common and cell type-specific responses of human cells to mitochondrial dysfunction. Exp. Cell. Res. 2005;302:270–280. doi: 10.1016/j.yexcr.2004.09.006. [DOI] [PubMed] [Google Scholar]
- 39.Denko NC, Fontana LA, Hudson KM, Sutphin PD, Raychaudhuri S, Altman R, Giaccia AJ. Investigating hypoxic tumor physiology through gene expression patterns. Oncogene. 2003;22:5907–5914. doi: 10.1038/sj.onc.1206703. [DOI] [PubMed] [Google Scholar]
- 40.Michelson S, Leith JT. Host response in tumor growth and progression. Invasion Metastasis. 1996;16:235–246. [PubMed] [Google Scholar]
- 41.Leo C, Giaccia AJ, Denko NC. The hypoxic tumor microenvironment and gene expression. Semin. Radiat. Oncol. 2004;14:207–214. doi: 10.1016/j.semradonc.2004.04.007. [DOI] [PubMed] [Google Scholar]
- 42.Bardos JI, Ashcroft M. Hypoxia-inducible factor-1 and oncogenic signalling. Bioessays. 2004;26:262–9. doi: 10.1002/bies.20002. [DOI] [PubMed] [Google Scholar]
- 43.Simonnet H, Demont J, Pfeiffer K, Guenaneche L, Bouvier R, Brandt U, Schagger H, Godinot C. Mitochondrial complex I is deficient in renal oncocytomas. Carcinogenesis. 2003;24:1461–1466. doi: 10.1093/carcin/bgg109. [DOI] [PubMed] [Google Scholar]
- 44.Simonnet H, Alazard N, Pfeiffer K, Gallou C, Beroud C, Demont J, Bouvier R, Schagger H, Godinot C. Low mitochondrial respiratory chain content correlates with tumor aggressiveness in renal cell carcinoma. Carcinogenesis. 2002;23:759–768. doi: 10.1093/carcin/23.5.759. [DOI] [PubMed] [Google Scholar]
- 45.Petros JA, Baumann AK, Ruiz-Pesini E, et al. mtDNA mutations increase tumorigenicity in prostate cancer. Proc. Natl Acad. Sci. USA. 2005;102:719–724. doi: 10.1073/pnas.0408894102. [DOI] [PMC free article] [PubMed] [Google Scholar]
- 46.Shidara Y, Yamagata K, Kanamori T, Nakano K, Kwong JQ, Manfredi G, Oda H, Ohta S. Positive contribution of pathogenic mutations in the mitochondrial genome to the promotion of cancer by prevention from apoptosis. Cancer Res. 2005;65:1655–1663. doi: 10.1158/0008-5472.CAN-04-2012. [DOI] [PubMed] [Google Scholar]
- 47.Sliva D. Signaling pathways responsible for cancer cell invasion as targets for cancer therapy. Curr. Cancer Drug Targets. 2004;4:327–336. doi: 10.2174/1568009043332961. [DOI] [PubMed] [Google Scholar]
- 48.Higuchi M, Manna SK, Sasaki R, Aggarwal BB. Regulation of the activation of nuclear factor kappaB by mitochondrial respiratory function: evidence for the reactive oxygen species-dependent and -independent pathways. Antioxid. Redox Signal. 2002;4:945–955. doi: 10.1089/152308602762197489. [DOI] [PubMed] [Google Scholar]
- 49.Wenk J, Brenneisen P, Wlaschek M, Poswig A, Briviba K, Oberley TD, Scharffetter-Kochanek K. Stable overexpression of manganese superoxide dismutase in mitochondria identifies hydrogen peroxide as a major oxidant in the AP-1-mediated induction of matrix-degrading metalloprotease-1. J. Biol. Chem. 1999;274:25869–25876. doi: 10.1074/jbc.274.36.25869. [DOI] [PubMed] [Google Scholar]
- 50.Sliva D, Rizzo MT, English D. Phosphatidylinositol 3-kinase and NF-kappaB regulate motility of invasive MDA-MB-231 human breast cancer cells by the secretion of urokinase-type plasminogen activator. J. Biol. Chem. 2002;277:3150–3157. doi: 10.1074/jbc.M109579200. [DOI] [PubMed] [Google Scholar]
- 51.Vulin AI, Stanley FM. Oxidative stress activates the plasminogen activator inhibitor type 1 (PAI-1) promoter through an AP-1 response element and cooperates with insulin for additive effects on PAI-1 transcription. J. Biol. Chem. 2004;279:25172–25178. doi: 10.1074/jbc.M403184200. [DOI] [PubMed] [Google Scholar]
- 52.Sato T, Koike L, Miyata Y, Hirata M, Mimaki Y, Sashida Y, Yano M, Ito A. Inhibition of activator protein-1 binding activity and phosphatidylinositol 3-kinase pathway by nobiletin, a polymethoxy flavonoid, results in augmentation of tissue inhibitor of metalloproteinases-1 production and suppression of production of matrix metalloproteinases-1 and -9 in human fibrosarcoma HT-1080 cells. Cancer Res. 2002;62:1025–1029. [PubMed] [Google Scholar]
- 53.Andela VB, Gordon AH, Zotalis G, Rosier RN, Goater JJ, Lewis GD, Schwarz EM, Puzas JE, O’Keefe RJ. NFkappaB: a pivotal transcription factor in prostate cancer metastasis to bone. Clin. Orthop. 2003:S75–S85. doi: 10.1097/01.blo.0000093048.96273.aa. [DOI] [PubMed] [Google Scholar]
- 54.Trim JE, Samra SK, Arthur MJ, Wright MC, McAulay M, Beri R, Mann DA. Upstream tissue inhibitor of metalloproteinases-1 (TIMP-1) element-1, a novel and essential regulatory DNA motif in the human TIMP-1 gene promoter, directly interacts with a 30-kDa nuclear protein. J. Biol. Chem. 2000;275:6657–6663. doi: 10.1074/jbc.275.9.6657. [DOI] [PubMed] [Google Scholar]
- 55.Kunz M, Moeller S, Koczan D, Lorenz P, Wenger RH, Glocker MO, Thiesen HJ, Gross G, Ibrahim SM. Mechanisms of hypoxic gene regulation of angiogenesis factor Cyr61 in melanoma cells. J. Biol. Chem. 2003;278:45651–45660. doi: 10.1074/jbc.M301373200. [DOI] [PubMed] [Google Scholar]
- 56.Zhao Y, Xue Y, Oberley TD, Kiningham KK, Lin SM, Yen HC, Majima H, Hines J, St Clair D. Overexpression of manganese superoxide dismutase suppresses tumor formation by modulation of activator protein-1 signaling in a multistage skin carcinogenesis model. Cancer Res. 2001;61:6082–6088. [PubMed] [Google Scholar]
- 57.Hervouet E, Demont J, Pecina P, Vojtiskova A, Houstek J, Simonnet H, Godinot C. A new role for the von Hippel-Lindau tumor suppressor protein: stimulation of mitochondrial oxidative phosphorylation complex biogenesis. Carcinogenesis. 2005;26:531–539. doi: 10.1093/carcin/bgi001. [DOI] [PubMed] [Google Scholar]
Associated Data
This section collects any data citations, data availability statements, or supplementary materials included in this article.