

Abstract
The forkhead DNA-binding protein FOXP3 is critical for the development and suppressive function of CD4+CD25+ regulatory T cells (TREG), which play a key role in maintaining self-tolerance. Functionally, FOXP3 is capable of repressing transcription of cytokine genes regulated by the Nuclear Factor of Activated T cells (NFAT). Various mechanisms have been proposed by which FOXP3 mediates these effects. Using novel cell lines that inducibly express either wild-type (WT) or mutant FOXP3, we have identified NFAT2 as an early target of FOXP3-mediated transcriptional repression. NFAT2 is typically expressed at low levels in resting T cells, but is upregulated by NFAT1 upon cellular activation. We demonstrate that transcription from the NFAT2 promoter is significantly suppressed by FOXP3, and NFAT2 protein expression is markedly diminished in activated CD4+CD25+FOXP3+ TREG compared to CD4+CD25negFOXP3neg T cells. Chromatin immunoprecipitation experiments indicate that FOXP3 competes with NFAT1 for binding to the endogenous NFAT2 promoter. This antagonism of NFAT2 activity by FOXP3 is important for the anergic phenotype of TREG, as ectopic expression of NFAT2 from a retroviral LTR partially restores expression of IL-2 in FOXP3+ TREG. These data suggest that FOXP3 functions not only to suppress the first wave of NFAT-mediated transcriptional responses, but may also affect sustained NFAT-mediated inflammatory gene expression through suppression of inducible NFAT2 transcription.
Keywords: T cells, Transcription Factors, Gene Regulation, Cytokines
INTRODUCTION
FOXP3 is a member of the P-subfamily of forkhead transcription factors. Expression of functional FOXP3 protein is required for the development and suppressive function of CD4+CD25+ regulatory T cells (TREG). Loss-of-function mutations of FOXP3 result in the Immune dysregulation, Polyendocrinopathy, Enteropathy, X-linked (IPEX) syndrome in humans and the Scurfy (SF) phenotype in mice (1). FOXP3+ TREG are notable for their poor proliferative response in vitro and for their lack of effector cytokine production (i.e., IL-2, IFNγ) in response to stimulation (2). Exogenous expression of FOXP3 in T cell lines has been shown to suppress activation-induced transcription from the IL-2, IL-4 and IFNγ promoters (3–5). This transcriptional repression requires the presence of the forkhead domain, leucine zipper, and an N-terminal repressor domain in the FOXP3 protein (5). Evidence suggests that FOXP3 mediates its repressive effect on cytokine production through inhibition of the Nuclear Factor of Activated T Cells (NFAT). The mechanism by which this occurs is still unclear but has been proposed to include direct interaction with NFAT in solution (4), direct interaction with NFAT through binding to adjacent sites on DNA (6), or through inhibition of transcription by competitive binding to overlapping DNA binding sites (3).
The NFAT family of transcription factors plays a significant role in the activation of T cells in response to T cell receptor (TCR) stimulation. Of the 5 NFAT family members (NFAT 1–5), NFAT1 (NFATp/NFATc2) is the predominant member present in resting T cells while NFAT2 (NFATc/NFATc1) is inducibly expressed in response to stimulation (7). Characterization of the NFAT2 promoter has demonstrated that NFAT1 plays a significant role in mediating the inducible expression of NFAT2 as a mechanism of amplifying and enhancing NFAT-mediated responses (8, 9). Others have recently suggested that NFAT2 is also required for CD4+ T cell commitment to effector cell function (10).
We have generated novel cell lines that inducibly express either wild-type (WT) or mutant FOXP3 (▵FKH, lacking the forkhead DNA binding domain) and have used these cell lines to perform microarray analysis to identify genes regulated by FOXP3 at early time points after FOXP3 expression. Using this approach, we determined that FOXP3 suppresses the inducible expression of NFAT2. Because of the important role of NFAT proteins in regulating T cell activation, we have further explored the mechanism by which FOXP3-mediated suppression of NFAT2 affects T cell function. We demonstrate that FOXP3 suppresses activation-induced expression of NFAT2 and that naturally arising FOXP3+ TREG cells induce less NFAT2 expression upon stimulation than FOXP3neg effector T cells. This suppression is mediated by regulation of NFAT1 binding to the NFAT2 promoter and results in decreased cytokine production that can be overcome by expression of NFAT2 from a heterologous promoter. Inhibition of NFAT2 by FOXP3 therefore not only inhibits NFAT-mediated cytokine production but may also play a role in the decision between regulatory and effector cell fates.
MATERIALS AND METHODS
Generation of Tetracycline-inducible HEK293 Cell Lines
Generation of stable HEK 293 cell lines that express amino-terminal V5-tagged wild-type (amino acids 2–431) or mutant (amino acids 2–334, lacking the forkhead domain) FOXP3 in response to tetracycline has been previously described (5).
Microarray Analysis
RNA Sample Preparation
Total RNA was isolated from 293 cell lines expressing WT or mutant (▵FKH) FOXP3 24 hours after the addition of Doxycycline (1μg/ml) to induce expression of the FOXP3 protein. RNA was isolated using Trizol reagent (Invitrogen, Carlsbad, CA) per the manufacturer’s protocol. Six independent experiments were completed for each cell line. After purification, RNA concentration was determined with a Nanodrop scanning spectrophotometer, and then qualitatively assessed for degradation using the ratio of 28:18s rRNA with a capillary gel electrophoresis system (Agilent 2100 Bionalalyzer, Agilent Technologies, Santa Clara, CA). All RNA samples used in these experiments had a 260/280 absorbance ratio > 2.0.
Microarray Slides
The human V2.0 Qiagen Operon genome-scale 70-mer oligonucleotide library was printed in the microarray facility of the Oklahoma Medical Research Foundation as previously described (11).
Labeling and Hybridization
cDNA was synthesized with direct incorporation of Cy3-dUTP from 2 μg of total RNA using Endo-Free reverse transcriptase (Ambion, Austin, TX). RNA was mixed with 500 ng of anchored oligo-dT primer, brought to 20 μl volume with DEPC water, heated to 70°C for 10 min, and then transferred to 50°C for 10 minutes. To this was added a solution containing 2 μl of 10× RT buffer (Ambion), 0.5 nmole Cy3-dUTP, 2.5 mM each of dATP, dCTP, and dGTP, 1.5 mM TTP, 40 units of RNAse inhibitor, and 1 μl reverse transcriptase. cDNA was synthesized at 50°C for 2 hours using a Gene Amp PCR System 9700 (Perkin-Elmer Applied Biosystems, Foster City, CA, USA). Reactions were terminated by adding 5 μl 0.5 M EDTA and 10 μl of 1.0 N NaOH and heating to 60°C for 60 min. The final cDNA solution was neutralized with 25 μl of 1.0 M Tris-HCl. pH 8.0. cDNA was purified with a Montage 96-well format vacuum system (Millipore, Billerica, MA).
The cDNA was added to hybridization buffer containing Cot-1 DNA (0.5 mg/ml final concentration), yeast tRNA (0.2 mg/ml), and poly(dA)40–60 (0.4 mg/ml). Hybridization was performed on a Ventana Discovery (Tucson, AZ) system for 6 hr at 42°C. Microarrays were washed to a final stringency of 0.1× SSC. Fluorescence intensity was determined using Imagene™ software (BioDiscovery, El Segundo, CA).
Normalization
Normalization for differences among experiments was conducted as previously described (11, 12). After data normalization and log-transformation, residuals are created from the control group and the “outliers” (genes with significant variability compared to the group) were excluded with an iterative procedure based on the F-test. The rest, called a “reference group” were used as an internal standard of equity of expression in the associative T-test (see below).
Identification of genes differentially expressed in WT vs. ▵FKH 293 cell lines
Analyses include
-Selection with a Student’s T-test for replicates using the commonly accepted significance threshold of p<0.05. Because of the large number of genes present on microarrays, a significant proportion of genes identified as differentially expressed in this manner are expected to be false positive determinations at this threshold level;
-An associative T-test in which the replicated residuals for each gene of the experimental group are compared with the entire set of residuals from the reference group (defined above). The hypothesis that gene expression in the experimental group, presented as replicated residuals (deviations from averaged control group profile), is distributed similarly to the several thousand members of the normally distributed set of residuals for gene expression in the reference group is tested. The significance threshold is corrected to 1/(number of genes) to make it improbable that false positives arise. Only genes with p-values below the threshold of both the Student t-test and the associative t-test are then presented in tables as differentially expressed genes.
-A distinctive group of selections consisted of uniquely expressed genes. Genes expressed distinctively from background in one group and not distinctively background in another are defined as only in one group expressed genes.
The microarray data discussed in this publication have been deposited in NCBI’s Gene Expression Omnibus (13) and are accessible through GEO Series accession number GSE13798 (http://www.ncbi.nlm.nih.gov/geo/query/acc.cgi?acc=GSE13798).
Human T cell purification and transfection
Primary human CD4+ T cells were purified from whole blood using the StemCell RosetteSep® CD4+ enrichment cocktail per the manufacturer’s protocol. For some experiments, CD4+ T cells were additionally purified into CD25+ and CD25neg fractions using anti-CD25 magnetic beads (Dynal/Invitrogen). Beads were detached from the the cell using the manufacturer’s protocol. Primary CD4+ T cells were transiently transfected either with an empty control vector or with a mammalian expression vector encoding nV5-tagged WT FOXP3. Transfections (~50% efficiency, data not shown) were done using an Amaxa Nucleofector (Amaxa, Cologne, Germany) as previously described (14).
Quantitative RT-PCR
Total RNA was prepared using Trizol reagent as indicated above. First strand complementary DNA (cDNA) synthesis was performed using the Omniscript RT Kit (Qiagen, Valencia, CA) per the manufacturer’s protocol. cDNA levels were quantitated using an iCycler iQ Real-Time PCR System (Bio-Rad, Hercules, CA) and Platinum SYBR Green qPCR Supermix-UDG (Invitrogen). Amplification was carried out in a total volume of 20 μl for 40 cycles with denaturation at 95°C for 15 seconds and annealing/extension at 60°C for 1 minute. Samples were run in triplicate and their relative expression was determined by normalizing to expression of the housekeeping gene HPRT. Primers: FOXP3: F 5′-CTGCCCACACTGCCCCTAGTC-3′, R 5′-CCATTTGCCAGCAGTGGGTAG-3′. NFAT2: F 5′-TTCCGGCGGCACCATGAAG-3′, R 5′-CGGTGTGGAGGTCTGAAG-3′. HPRT: F 5′-GTTGGATACAGGCCAGACTTTGTTG-3′, R 5′-CAAAGGGAACTGATAGTCTATAGGCT-3′.
Luciferase Assays
Unless otherwise indicated, 5 × 10⁶ primary human CD4+ T cells cells were co-transfected with 5μg of the indicated firefly luciferase reporter vector (inducible NFAT2 promoter (8), 3×NFAT, IL-2, or CD154 mRNA stability element (15)), 100ng of the pRL-TK renilla luciferase control vector (Promega, Madison, WI), and 10μg of the indicated FOXP3 expression vector or empty control vector. Two hours after transfection, cells were divided and half were stimulated with PMA (25 ng/ml)/Ionomycin (1.5 μM) while the other half were treated with media alone for 6 hours. Luciferase assays were run using the Dual Luciferase Assay kit (Promega) per manufacturer recommendations. Luminescence was determined in duplicate with a Lumat 9507 luminometer (Berthold Technololgies, Bad Wildbad, Germany).
Detection of intracellular NFAT2
Purified human T cell subsets were resuspended in RPMI complete media at 106 cells/ml and treated either with DMSO (diluent) or PMA (5 nM)/Ionomycin (2 μM) for 2.5 hours at 37°C. Cells were stained with APC anti-CD69 mAb (clone FN50, BD Biosciences, San Jose, CA) for 30 min. followed by incubation in FOXP3 Fix/Perm buffer (Biolegend, San Diego, CA). Cells were washed and resuspended in permeabilization buffer (Biolegend) for 15 min. then intracellular staining performed with AlexaFluor 488 anti-FOXP3 (Clone 259D, Biolegend) and PE anti-NFAT2 (Clone 7A6, Santa Cruz Biotechnology, Santa Cruz, CA) for 35–45 minutes. After washing, flow cytometry was performed on an LSR II flow cytometer (BD Biosciences). Expression of NFAT2 in transduced murine CD4+ T cells was assessed by immunoblot analysis using an Ab against murine NFAT2 (Abcam, Cambridge, MA).
Chromatin immunoprecipitation (ChIP) analysis
ChIP assay used reagents from Upstate Biotechnology, Inc. (Lake Placid, NY) with modifications to the manufacturer protocol as previously described (15, 16). Nuclear proteins and chromatin were crosslinked, sonicated, and extracts from 1–5 million cells were precipitated overnight at 4°C with 10 μg of anti-NFAT1 mAb (clone MA1–025, Affinity Bioreagents, Golden, CO), anti-NFAT2 mAb (clone MA3-024, Affinity Bioreagents), anti-Foxp3 mAb (eBiosciences, San Diego, CA), anti-FLAG Ab (Sigma), anti-V5 mAb (Invitrogen), or control IgG Ab and Protein G agarose. DNA extracted from each precipitate was probed by TaqMan® real time PCR (Applied Biosytems) using primers and a probe specific for the human or mouse NFAT2 proximal promoter region (hu-forward 5′-GGG AGGTGTTTTCCAGCTTTAA-3′, hu-reverse 5′-CGAGTTCGGAGCCTCTGAGT-3′, or mu-forward 5′-CGTTTCGTCCCTGACTGTTT-3′, mu-reverse 5′-GAGGACACAAGGGACTGGAG-3′). Fold differences between specific antibody and isotype control immunoprecipitations were calculated using the formula: 2−ΔCt, where ΔCt = Ct sample − Ctcontrol
Retroviral transduction and detection of IL-2 and IL-2R
Murine Foxp3 and NFAT2 cDNAs were amplified from C57BL/6 thymus and cloned into the MSCV-based MIGR1 (NFAT2) and MINR1 (Foxp3) retroviral vectors, as described previously (16). To generate retrovirus, constructs were co-transfected with the pCLeco (Imgenex) helper plasmid into the Phoenix ecotropic packaging cell line. Purified murine CD4+CD25neg T cells were activated with PMA (3 ng/ml), ionomycin (1 μM) and IL-2 (10 U/ml) for 24 hr, washed, transduced by spinfection with 24 hour Phoenix viral supernatants, and expanded in IL-2 for 1–3 days. For TREG transduction, murine CD4+CD25+ were purified by positive selection (Miltenyi, Auburn, CA), activated on CD3/28-coated plates (1 μg/mL ea.) in the presence of TGFβ (5 ng/mL) and IL-2 (100 U/mL) for 24 hours, subjected to two rounds of spinfection on days 2 and 3, and expanded for an additional 48 hours on CD3/28-coated plates with 2 ng/mL TGFβ and 10 U/mL IL-2. Cells transduced with NFAT2 were identified by expression of GFP, and cells transduced with Foxp3 were identified by expression of NGFR using flow cytometry. Endogenous Foxp3 expression by TREG was detected using a PE-conjugated anti-Foxp3 Ab (eBiosciences, San Diego, CA), and IL-2 receptor expression was detected using an APC-conjugated Ab against CD25 (BD Biosciences). All cells were rested for 18 hours in medium, and restimulated with PMA (3ng/mL) and ionomycin (1 μM) or plate-bound anti-CD3/28 Ab (2 μg/mL). For intracellular detection of IL-2, cultures were restimulated in the presence of monensin for 5 hours, fixed, permeabilized, and stained with an APC-conjugated anti-IL-2 Ab (BD Biosciences). IL-2 protein was quantified by the mean fluorescence intensity (MFI) of the positive cells as a function of GFP (for NFAT2) or NGFR (for Foxp3) reporter gene expression, as previously described by Wu et al. (6). Secretion of IL-2 into the culture supernatant by transduced cells (50,000 per well) activated for 8 hours on CD3/28-coated plates was measured using a standard IL-2 ELISA kit (eBioscience).
RESULTS
Identification of NFAT2 as a Target of FOXP3-Mediated Suppression
To identify genes regulated at early time points after introduction of FOXP3, we generated cell lines that inducibly express either WT or mutant (▵FKH) FOXP3 in response to tetracycline. The ▵FKH mutant is truncated at amino acid 334 and lacks the forkhead DNA-binding domain similar to the non-functional mutant Foxp3 protein expressed by the Scurfy mouse (5, 17). Both HEK 293 and Jurkat T cell lines were generated but despite multiple attempts using various approaches, the Jurkat T cells demonstrated minimal induction of WT FOXP3 mRNA or protein in response to tetracycline and therefore could not be used (data not shown). In contrast, the HEK 293 cell lines expressed no detectable FOXP3 protein at baseline but increased expression as much as 30-fold upon induction with tetracycline (Fig. 1A). As expected, the induced WT FOXP3 protein was constitutively localized to the nucleus whereas a mutant lacking the forkhead DNA-binding domain (▵FKH), which also contains the nuclear localization sequence, was primarily localized in the cytoplasm (Fig. 1B)(3, 5).
Figure 1. Characterization of Inducible FOXP3-Expressing Cell Lines and Results of Array Analysis.
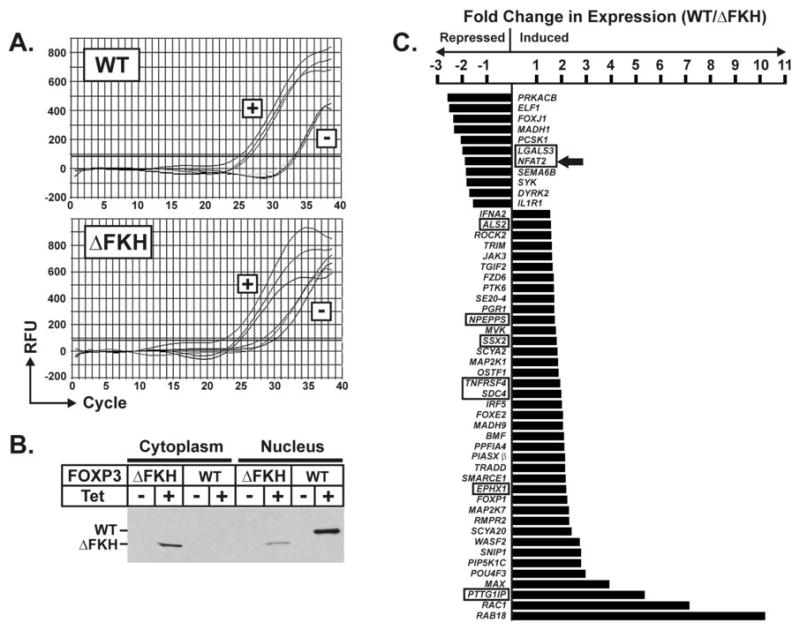
A) Quantitative real-time RT-PCR showing the tetracycline inducibility of wild-type (WT) or mutant (▵FKH) FOXP3 mRNA in the Tet/wtFP3 or Tet/▵fkhFP3 293 cell lines. Each represents 3 independent experiments. B) Western blot showing protein expression in the cytoplasm and nucleus of each cell line in response to tetracycline. Proteins are tagged at the N-terminus with a V5 epitope tag and blot is probed with anti-V5 HRP-labeled antibody. C) Genes differentially expressed in 293 cells expressing wild-type (WT) vs. mutant (▵FKH) FOXP3 protein for 24 hours. Only a subset of genes related to immune function, cell signaling, or transcription are shown. Boxed genes demonstrate those identified by others as being similarly differentially expressed in Foxp3+ TREG cells or CD4+ T cells chronically expressing Foxp3. NFAT2 is denoted by an arrow.
Array analysis was performed as described in Materials and Methods using RNA prepared from HEK 293 cells induced to express either WT or ▵FKH FOXP3 for 24 hours. To identify FOXP3-regulated genes, the gene expression profile of cells expressing WT FOXP3 was compared to those expressing ▵FKH FOXP3. Short-term expression of WT FOXP3 in our cell lines led to more genes being induced than suppressed (900 vs. 338 respectively), similar to recent observations comparing murine T cells stably expressing Foxp3 vs. those lacking Foxp3 expression (18, 19). The relevance of using this non-T cell line to study genes regulated by FOXP3 is demonstrated by the observation that several immune-associated and T cell specific genes are targets of FOXP3 in this system (Fig. 1C). These include several genes recently identified by other investigators as being differentially expressed in Foxp3+ TREG cells vs. Foxp3neg effector T cells (Fig. 1C)(18–23).
One of the most interesting among these gene targets is the transcription factor NFAT2(NFATc/NFATc1) which was suppressed by WT FOXP3 in our cell lines and similarly has been observed to be differentially downregulated in Foxp3+ vs. Foxp3neg T cells by other investigators (18, 23). Since cytokine expression is altered in FOXP3+ TREG cells and NFAT proteins play a significant role in regulating cytokine gene transcription, we focused on regulation of NFAT2 by FOXP3.
FOXP3 Represses Transcription from the NFAT2 Promoter
Quantitative real-time PCR was used to confirm that 24 hours after tetracycline exposure, NFAT2 mRNA expression is down-regulated by 46% in 293 cells expressing WT FOXP3 compared to the ▵FKH mutant (Fig. 2A, left panel). This difference in NFAT2 mRNA expression was observed as early as 6 hours after the induction of FOXP3 expression with tetracycline (data not shown). To determine whether FOXP3 exerts similar suppression of activation-induced NFAT2 expression in T cells, primary human CD4+ T cells were transfected with a plasmid encoding WT FOXP3 or empty vector using an Amaxa nucleofector. Cells transfected with WT FOXP3 demonstrated markedly reduced induction of NFAT2 mRNA in response to PMA/Ionomycin treatment compared to cells transfected with empty vector (Fig. 2A, right panel).
Figure 2. FOXP3 Suppresses the Activation-Induced Expression of NFAT2 in T cells.
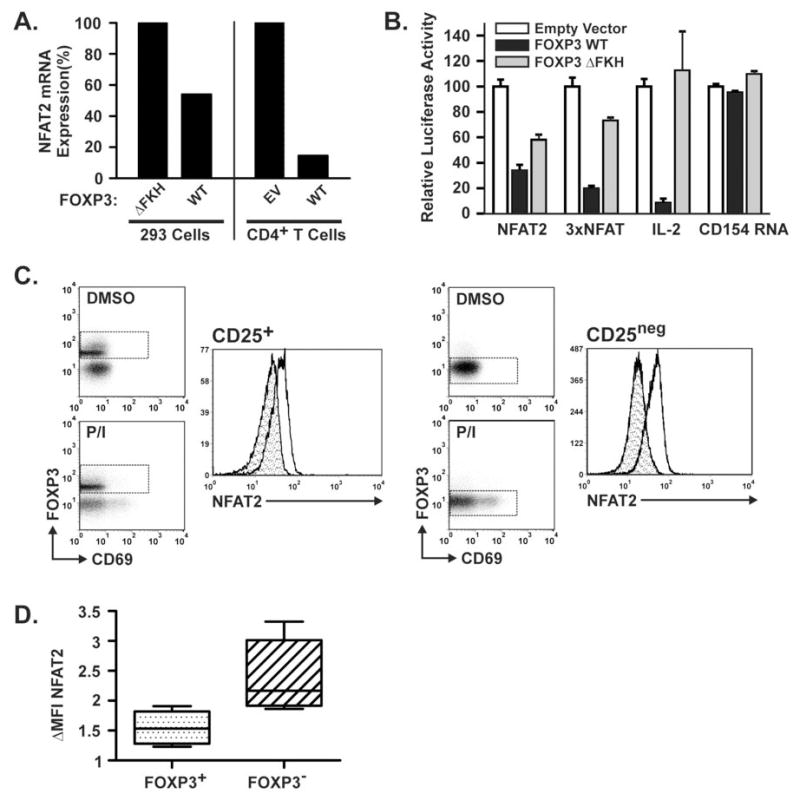
A) Quantitative real-time RT-PCR demonstrating NFAT2 mRNA expression. Left panel: 293 cell lines induced to express wild-type or mutant (▵FKH) FOXP3 for 24 hours. Right panel: Primary human CD4+ T cells transfected with an expression vector encoding WT FOXP3 or empty vector control then activated for 5 hours with PMA/Ionomycin. In each case, the control is normalized to 100%. B) Luciferase assays demonstrating the effect of WT and ▵FKH FOXP3 on transcription from the NFAT2 gene P1 promoter in primary human CD4+ T cells. The 3×NFAT and IL-2 promoter plasmids serve as positive controls and the CD154 mRNA reporter plasmid as a negative control. For each construct results are shown relative to the empty vector control which is normalized to 100%. C) Flow cytometry demonstrating decreased upregulation of NFAT2 protein in freshly isolated human CD25+FOXP3+ TREG cells vs. CD25negFOXP3neg effector T cells. CD4+ T cells isolated by negative selection were separated into CD25+ and CD25neg populations by positive selection for CD25. Diluent only (DMSO = shaded histogram) or PMA/Ionomycin treated cells (clear histogram) were then evaluated by flow cytometry for cell surface CD69 and intracellular FOXP3 and NFAT2 as described in materials and methods. Dashed boxes indicate the cell gate used to generate the NFAT2 histograms. D) Graph demonstrating the fold ΔMFI(MFIP/I/MFIDMSO) in primary CD25+FOXP3+ TREG cells vs. CD25negFOXP3neg T cells. All results are representative of 3 or more independent experiments.
To determine whether FOXP3 exerts its suppressive effect on NFAT2 expression through transcriptional repression of the NFAT2 promoter, primary human CD4+ T cells were transfected with luciferase reporter constructs containing the inducible NFAT2 promoter, a 3x NFAT binding site, the IL-2 promoter, or the CD154 mRNA stability element (used as a transcriptional negative control). For each reporter plasmid, cells were transfected with the indicated expression vectors, stimulated with PMA/ionomycin, and evaluated for induction of luciferase expression. As previously described, WT FOXP3 represses inducible transcription from the IL-2 promoter by more than 90%, whereas the ▵FKH mutant has no effect on transcriptional activation (Fig. 2B)(3–6). Similarly, WT FOXP3 also exerts a marked suppressive effect on transcriptional activation from isolated NFAT DNA-binding sites (3× NFAT) or from the inducible NFAT2 promoter. In contrast to the IL-2 promoter however, ▵FKH FOXP3 led to some repression of the 3× NFAT and NFAT2 promoter constructs (an average of 27.1% and 41.9%, respectively) (Fig. 2B). The reason for these differences may have to do with the complexity (number of binding sites for other transcription factors that may be activated simultaneously, etc.) of the isolated promoter fragment included in the particular luciferase constructs used. PMA/Ionomycin-induced stabilization of luciferase by the CD154 mRNA stability element is not dependent on NFAT and was unaffected by either WT or ▵FKH FOXP3 proteins as predicted. Thus, FOXP3 was capable of inhibiting NFAT2 promoter transcriptional activity.
To determine if the effect of FOXP3 on NFAT2 mRNA production ultimately equates to differences in NFAT2 protein expression in T cells, we studied primary human CD4+FOXP3+ and CD4+FOXP3neg T cells for the ability to induce NFAT2 in response to PMA/Ionomycin treatment. Primary human CD4+ T cells were isolated from whole blood by negative selection, divided into CD25+ and CD25neg populations, and treated for 2.5 hours with PMA/Ionomycin or DMSO (diluent) before measurement of NFAT2 protein by flow cytometry. Cells were simultaneously stained for FOXP3, NFAT2, and for cell-surface expression of the activation marker, CD69. Similar to the observation that cells expressing WT FOXP3 induce less NFAT2 mRNA upon activation, the CD25+FOXP3+ cells express less NFAT2 protein in response to PMA/Ionomycin than the CD25negFOXP3neg cells (Fig. 2C). The FOXP3+ cells consistently had slightly higher basal NFAT2 staining than the FOXP3neg T cells but expressed significantly less NFAT2 than the FOXP3neg cells with PMA/Ionomycin treatment (Fig. 2C). This was consistent based upon the fold change in mean fluorescence intensity (MFI) in 4 experiments using 3 different normal donors (Fig. 2D). In each case, activation of the pooled cells was verified by an increase in CD69 expression in the FOXP3neg population. Due to the early time point, not all of the cells had increased CD69 expression but NFAT2 induction was similar in both CD69+ and CD69neg cells (data not shown) so both populations were included in the analysis (Fig. 2C). Thus, FOXP3 expression represses NFAT2 transcription via the inducible NFAT2 promoter resulting in decreased NFAT2 protein expression.
NFAT Proteins Bind to the Inducible Promoter but not the 1st Intronic Enhancer of the NFAT2 gene in Primary Human CD4+ T Lymphocytes
As previously shown in vitro, NFAT2 transcription following T cell activation is markedly enhanced by the binding of NFAT1 to a promoter region upstream of the first exon of NFAT2, termed the P1 region (8, 9). It has also been shown that in the developing heart, a second region (termed P2) within the first intron acts as a transcriptional enhancer and is required for the expression of an alternative isoform of NFAT2 (24). To confirm that the P1 region contained in the NFAT2 promoter luciferase vector(8) is the primary site of action of NFAT1 in human T cells, in vivo chromatin immunoprecipitation assays were performed in unstimulated and stimulated primary human CD4+ T lymphocytes using either a control antibody or antibodies to NFAT1 or NFAT2. As shown in Figure 3B, stimulation of cells with PMA/ionomycin induces greater than 8-fold binding of NFAT1 protein to the P1 region of the NFAT2 promoter compared to the precipitation done with isotype control IgG. Similarly, NFAT2 binding to this region following activation was also found to be significantly increased (greater than 7-fold) over unstimulated cells, consistent with an auto-regulatory function of NFAT2(9). In contrast, there was no appreciable binding of NFAT1 or NFAT2 to the P2 region within the 1st intron in unstimulated or stimulated cells (data not shown). As a positive control for the ChIP assay, we also quantitated NFAT1 binding to the IL-2 promoter and found it to be significantly increased following T cell activation with PMA/Ionomycin (data not shown). Therefore, NFAT proteins bind to the proximal P1 NFAT2 promoter in vivo following CD4+ T cell activation.
Figure 3. FOXP3 binds the NFAT2 promoter in vivo and disrupts NFAT1 binding.
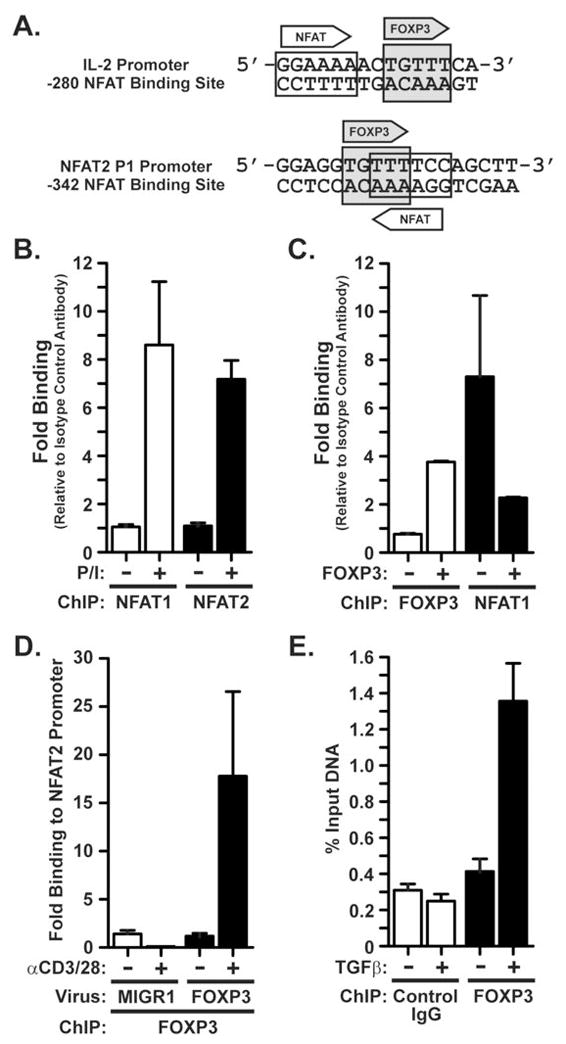
A) The predicted NFAT (plain box) and FOXP3 (grey box) binding sites in the well characterized -280 NFAT site of the human IL-2 promoter [modified from Wu et al (6)] and in the P1 region of the human NFAT2 promoter [modified from Zhou et al (8)]. Numbering of the NFAT2 site is relative to the translation start codon. Arrows indicate the orientation of each binding site. B) Activation-induced binding of NFAT1 and NFAT2 to the NFAT2 P1 promoter region. Chromatin immunoprecipitation (ChIP) was carried out in freshly-isolated primary human peripheral blood CD4+ T cells that were either rested or stimulated with PMA/Ionomycin for 2 hours. Binding is shown relative to that observed by performing ChIP with an isotype control antibody (normalized to 1). C) Displacement of NFAT1 by FOXP3 on the P1 region of the NFAT2 promoter. ChIP was performed in primary human CD4+ T cells transiently transfected with expression vectors encoding V5-epitope tagged WT FOXP3, or empty vector control. Cells were rested for 2 hours post-transfection, then stimulated with PMA/ionomycin for 2.5 hours prior to ChIP. Binding is shown relative to the isotype control antibody as in (B). D) Activation-induced binding of murine FOXP3 to the murine NFAT2 P1 promoter region. Primary murine CD4+ T cells were transduced with empty retrovirus (MIGR1) or retrovirus encoding murine Foxp3 prior to activation with anti-CD3/anti-CD28 Ab and ChIP. E) Binding of endogenous murine Foxp3 to the P1 promoter region of the mNFAT2 gene in activated murine CD4+CD25neg T cells or TGFβ-induced TREG cells. Purified CD4+CD25neg T cells were cultured with plate-bound anti-CD3/anti-CD28 Ab in the presence or absence of TGFβ (5 ng/ml) prior to ChIP analysis. Results are shown as a percentage of the input DNA. Data in B-E are means ± S.E.M. of duplicate samples and are representative of 4–5 individual experiments.
FOXP3 Binds to the P1 Region of the NFAT2 Promoter and inhibits binding of NFAT1
Since NFAT1 is important for activation-induced transcription of the NFAT2 gene(8, 9), we used chromatin immunoprecipitation to determine whether FOXP3 represses NFAT2 gene transcription by modulating the binding of NFAT1 to the NFAT2 P1 promoter. Interestingly, a consensus forkhead binding site like that predicted to be bound by FOXP3 (6, 18) was identified overlapping the NFAT1 site in the P1 region of the NFAT2 promoter (Fig. 3A). V5-tagged WT FOXP3 was introduced into primary human CD4+ T cells by Amaxa transfection of a plasmid encoding this cDNA. Expression of FOXP3 resulted in a marked decrease of activation-induced NFAT1 binding to the NFAT2 proximal promoter (Fig. 3C). Moreover, ChIP with an anti-V5 epitope antibody demonstrated evidence for V5-tagged FOXP3 binding to the proximal NFAT2 promoter in these same cells (Fig. 3C). This suggests that FOXP3 abrogates NFAT1 binding to the proximal NFAT2 promoter, thus inhibiting activation-induced NFAT2 transcription, in human CD4+ T cells. Interestingly, FOXP3 does not affect inducible binding of Egr-1, an unrelated transcription factor that binds to the P1 promoter region following T cell activation (data not shown).
To corroborate the ability of FOXP3 to bind to the NFAT2 promoter, murine FOXP3 was introduced into primary murine CD4+ T cells by retroviral transduction. Since the NFAT1 binding site sequence in the proximal NFAT2 promoter is identical between mouse and man (Fig. 3A), we postulated that the FOXP3 binding site may also be preserved. Following anti-CD3/anti-CD28 mAb activation of murine CD4+ T cells transduced with FOXP3, we observed a marked increase in FOXP3 binding to the proximal mNFAT2 promoter by ChIP assay (Fig. 3D). By comparison, no FOXP3 bound the mNFAT2 promoter in the absence of T cell activation or in T cells transduced with MIGR1 control retrovirus (Fig. 3D).
To ensure that binding of FOXP3 to the NFAT2 promoter is not simply a consequence of ectopic FOXP3 expression, we evaluated binding of native Foxp3 to the NFAT2 promoter using in vitro generated Foxp3-expressing regulatory T cells. We and others have previously shown that TGFβ stimulation results in a population of Foxp3 expressing T cells with regulatory function analogous to natural TREG cells (25–28). Purified CD4+CD25neg murine T cells were cultured in vitro with immobilized anti-CD3 and anti-CD28 Ab for three days in the presence or absence of TGFβ. Foxp3 expression was specifically induced by TGFβ in 50–60% of CD4+ T cells in these cultures (data not shown). ChIP analysis demonstrated a marked increase in Foxp3 binding to the NFAT2 promoter upon stimulation in T cells expanded in the presence of TGFβ (Fig. 3E). By comparison, T cells expanded without TGFβ showed no appreciable increase in Foxp3 binding to the NFAT2 promoter (Fig. 3E). Thus, in generating 3 different FOXP3 expressing populations of primary CD4+ T cells, from both mouse and human, FOXP3 was demonstrated to bind the NFAT2 proximal promoter in vivo upon T cell activation. Moreover, coincident with FOXP3 binding to the NFAT2 proximal promoter in vivo, NFAT1 engagement of the NFAT2 P1 proximal promoter was disrupted.
Ectopic NFAT2 Expression Restores IL-2 Production in Foxp3+ TREG
To determine whether the suppression of NFAT2 plays a causal role in decreased effector cytokine expression by TREG, we expressed murine NFAT2 from a heterologous promoter in CD4+CD25+Foxp3+ TREG using a retroviral transduction approach. Purified CD4+CD25+ TREG were stimulated with CD3/28 Ab in the presence of TGFβ and IL-2 and transduced with empty MIGR1 vector or vector encoding mNFAT2, yielding cultures that were >90% positive for CD4, 70–85% positive for Foxp3, and 70–75% positive for the GFP retroviral reporter gene (Fig. 4A and 4B). As expected, mock- or empty vector-transduced TREG produced very little IL-2 in response to CD3/28 ligation. Only 4–5% of TREG were positive for IL-2 as measured by intracellular staining (Fig 4B, middle two panels) and secreted only ~0.1 ng/mL IL-2 as measured by ELISA (Fig. 4C, left panel). By comparison, over 30% of conventional CD25negFoxp3negCD4+ T cells that had been mock-transduced and restimulated under the same conditions were able to produce IL-2 (Fig. 4B, left middle panel), and secreted more than 15 ng/mL into the supernatant (Fig. 4C, right panel). This differential was even greater in response to PMA/ionomycin stimulation, where 70% of conventional CD4+ T cells were IL-2-positive, but the frequency of IL-2 producers among mock- or empty vector-transduced TREG remained at 4–5% (Fig 4B bottom panels). The frequency of NFAT2-transduced TREG capable of producing IL-2 was increased by 1.4-fold compared to empty vector-transduced TREG stimulated through CD3/28 (Fig. 4B, middle panels), and almost 2-fold in response to P/I stimulation (Fig. 4B, bottom panels). This increase in IL-2 production was only observed in the GFP+ (transduced) cells (Fig. 4B). However, this mild increase in the frequency of IL-2 producers was accompanied by a nearly 20-fold increase in the amount of IL-2 secreted into the supernatant by NFAT2-transduced TREG, suggesting that NFAT2 controls not only the frequency of TREG capable of producing IL-2, but also strongly regulates the amount of IL-2 produced by an individual cell. Simultaneous staining of Foxp3 and intracellular IL-2 confirmed a marked increase in IL-2 production by Foxp3+ TREG transduced with NFAT2 and confirmed that the observed increase in IL-2 production was not simlply derived from contaminating non- TREG cells in the culture (Supplemental Fig. 1). Ectopic expression of NFAT2 did not influence IFNγ gene expression by TREG (data not shown), but did lead to increased expression of IL-2Rα (CD25). This could be a direct effect of NFAT2 on transcription of the il2ra gene, or more likely is the result of enhanced autocrine IL-2:IL-2R signaling in these cells, which is known to augment CD25 expression [ref. here].
Figure 4. Restoration of IL-2 production in murine TREG by ectopic expression of NFAT2.

Purified CD4+CD25negFoxp3neg T cells (first panel on the left in A and B) and CD4+CD25+Foxp3+ TREG (right three panels in A and B) were mock transduced (first and second panels in A and B), transduced with empty MIGR1 vector (third panel in A and B), or transduced with MIGR1 encoding murine NFAT2-IRES-GFP (last panel on right) and rested cultures were stained for Foxp3 (A) and CD25 (not shown). Transduced cells were cultured in medium (top panels in B), or restimulated with plate-bound CD3/28 Ab (middle panels in B and in part C) or PMA and ionomycin (bottom panels in B), and IL-2 production was assessed by intracellular staining as a function of GFP reporter gene expression (B) or by ELISA (C). In a separate approach, murine CD4+CD25neg T cells were transduced with Foxp3-IRES-GFP vector alone (x-axis of left panel in D), NFAT2-IRES-NGFR alone (y-axis of left panel in D), or Foxp3-IRES-GFP plus NFAT2-IRES-NGFR in combination (right panel in D). In the left panel, singly transduced cells were mixed prior to flow cytometry to demonstrate that each population of cells could be spectrally separated. The transduced cells depicted in D were restimulated with plate-bound anti-CD3/28 Ab, and IL-2 production was measured by intracellular staining with an APC-conjugated Ab. The graph in E shows the mean fluorescence intensity (MFI) of IL-2 staining as a function of GFP (NFAT2) or NGFR (Empty vector, Foxp3, and Foxp3 + NFAT2) reporter MFI. Results are representative of 3 experiments.
The results above show that forced expression of NFAT2 can clearly increase IL-2 production by TREG, but not to the levels that are produced by conventional CD4+ T cells. This implies, not surprisingly, that NFAT2-independent mechanisms also exist in these cells to limit inflammatory cytokine gene expression. To address whether NFAT2 can influence Foxp3 function outside of the TREG lineage, conventional CD25negFoxp3negCD4+ T cells were transduced with Foxp3 alone, NFAT2 alone, or co-transduced with Foxp3 and NFAT2. Cells were then activated with anti-CD3/28 Ab, transduced populations were identified by the expression of GFP and/or NGFR reporters (Fig. 4D), and IL-2 production was measured by intracellular staining as above (Fig. 4E). As previously observed, expression of Foxp3 alone caused a dose-dependent inhibition of IL-2 production relative to the empty vector control (Fig. 4E). In contrast, over-expression of NFAT2 alone resulted in a dose-dependent increase in IL-2 production (Fig. 4E). Co-expression of NFAT2 with Foxp3 was sufficient to restore IL-2 production to levels above those observed in cells transduced with an empty vector control or with Foxp3 alone (Fig. 4E). Similar trends were also observed for IL-2 secretion as measured by ELISA (data not shown). Interestingly, IL-2 expression levels in the co-transduced cells remained lower than those observed in cells transduced with NFAT2 alone (Fig. 4E). This suggests that in addition to limiting NFAT2 protein expression, Foxp3 exerts additional suppressive effects on NFAT2 activity (see Fig. 5). Similar to IL-2, we observed that IFNγ production was also repressed in CD4+ T cells transduced with Foxp3 alone, and unlike in natural Treg, was likewise restored by ectopic expression of NFAT2 (data not shown). Therefore, restoration of NFAT2 was sufficient to overcome repression of effector cytokine gene expression mediated by Foxp3.
Figure 5. Model of FOXP3 Mediated Effects on NFAT Transcriptional Regulation.
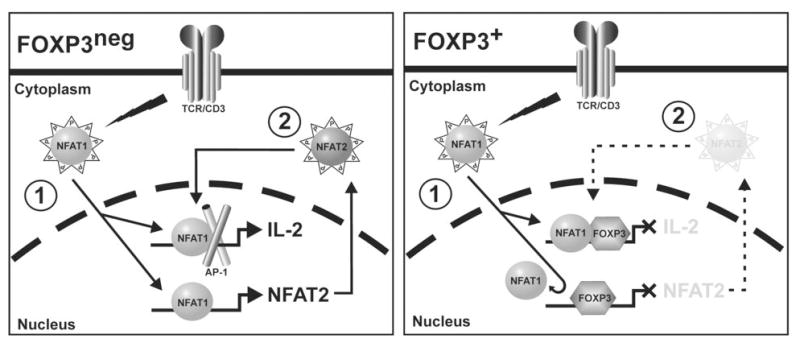
In FOXP3neg cells NFAT1, present in the cytoplasm, is dephosphorylated upon T cell activation targeting it to the nucleus where it up-regulates transcription of numerous genes including cytokines such as IL-2 (Step 1). In addition, it up-regulates transcription of NFAT2 which serves to potentiate and enhance NFAT responses (Step 2). In FOXP3+ cells, FOXP3 binds cooperatively with NFAT proteins on some promoters (including the IL-2 promoter) and represses transcription thereby limiting step 1 of NFAT activation. In addition, as shown here, FOXP3 binds to the P1 region of the NFAT2 promoter and abrogates binding of NFAT1 to this promoter thereby decreasing the amount of NFAT2 produced and limiting step 2 of NFAT activation. Supplying exogenous NFAT2 overcomes inhibition of IL-2 production mediated by step 2 but would not affect the activity of FOXP3 at step 1.
DISCUSSION
The role of FOXP3 as a transcriptional regulator was recognized at the time the gene was cloned due to its notable sequence homology to the forkhead family of DNA binding proteins, many of which play critical roles in developmental processes (29). It was initially implicated exclusively as a transcriptional repressor (3), but recent genome-wide screens demonstrated that among direct binding targets of FOXP3, more genes were induced than repressed (16, 18, 19, 30). The specific factors that determine whether FOXP3 enhances or represses transcription have not yet been identified, but an association has been made with differential chromatin remodeling at targets that are differentially regulated (16).
Since FOXP3 has the unique capacity to confer a regulatory phenotype upon CD4+ T cells, we are interested in the genetic program initiated at early time points after FOXP3 expression. To evaluate immediate early and early gene transcription events regulated by FOXP3, we have used a novel HEK 293-based cell system that offers inducible expression of either WT or mutant (▵FKH) FOXP3. Using this novel cell system, a number of genes regulated by FOXP3 were identified. Despite the use of HEK 293 cells, several T cell-specific genes were identified as targets of FOXP3-mediated regulation and many of these correlate with genes identified by others studying gene expression profiles in CD4+CD25+ TREG vs. CD4+CD25neg T cells (Fig. 1C)(18–22).
One of the genes identified as a target of FOXP3-mediated suppression using our approach was the transcription factor NFAT2, a member of the Nuclear Factor of Activated T cell family of transcriptional regulators (31). This was consistent with the findings of other groups studying differential gene expression profiles in Foxp3+ and Foxp3neg T cells (18, 23). NFAT2 is expressed at only low levels in resting T cells but is markedly induced upon T cell activation, to augment and sustain NFAT-regulated gene transcription, which is important for the development and function of effector T cells(10). Induction of NFAT2 upon T cell activation is mediated primarily by constitutively expressed NFAT1 (8, 9).
We have demonstrated that FOXP3 suppresses the activation-induced expression of NFAT2 mRNA and protein in primary human T cells, and this appears to occur via inhibition of transcription mediated by the proximal NFAT2 P1 inducible promoter (Fig. 2A,B,C). Chromatin immunoprecipitation using antibodies to NFAT1 showed inducible binding of NFAT1 to the NFAT2 P1 promoter upon cellular activation (Fig. 3B). This binding was markedly decreased in the presence of FOXP3 suggesting that expression of FOXP3 abrogates binding of NFAT1 to the NFAT2 promoter (Fig. 3C). Concomitant with the loss of NFAT1 binding, we observed a marked increase in FOXP3 binding to the NFAT2 P1 promoter upon T cell stimulation (Fig. 3C). Enhanced binding of FOXP3 to other promoters upon T cell activation has been recently reported (16, 18). The abrogation of NFAT1 binding in the presence of FOXP3 is however unique compared to the mechanism described for the IL-2 promoter where FOXP3 is thought to bind to DNA immediately adjacent to NFAT, and to directly interact with NFAT1 to modulate transcription (6, 32). There are differences in the NFAT-binding sites present in the NFAT2 P1 promoter and the well characterized −280 site in the IL-2 promoter (Fig. 3A)(6). These sequence variations may account for the differences observed in binding however it is not yet clear that this is the case. In the IL-2 site and other NFAT binding sites identified by Wu et al. (6), the core binding sequences for NFAT and FOX3 are adjacent and in almost all cases separated by ~2–4 base pairs (Fig. 3A). In contrast, the putative FOXP3 binding site in the NFAT2 promoter directly overlaps the core NFAT binding element and is in the opposite orientation (relative to NFAT) compared to the site in the IL-2 promoter (Fig. 3A)(6). This arrangement may prevent both proteins from being able to bind DNA simultaneously or may alter the orientation of interacting surfaces that are important for FOXP3:NFAT cooperation on other promoters. It is unlikely that FOXP3 binds elsewhere within the P1 promoter region since the promoter is highly G/C-rich(8) and there are no other sequences that even loosely match the predicted A/T-rich forkhead consensus sequence bound by FOXP3 (6, 18). Thus, FOXP3 appears to inhibit activation induced NFAT2 transcription via competitive binding with NFAT1 at the proximal NFAT2 P1 promoter.
Along these lines, the restoration of IL-2 and IFNγ production mediated by co-expression of NFAT2 with FOXP3 suggests that NFAT proteins may directly compete with FOXP3 to regulate the NFAT2 P1 promoter, possibly by shifting the balance of promoter occupancy. Alternatively, longstanding evidence obtained by single cell analysis suggests that activated NFAT proteins must exceed a certain threshold level before they can initiate transcription (33). FOXP3 may therefore exert its effects on some NFAT-driven promoters by limiting the amount of activated NFAT available, thereby maintaining levels below the threshold required for transcriptional activation. The 2- to 3-fold over-expression of NFAT2 in this transduction model (data not shown) may breach the threshold level of NFAT proteins required to increase NFAT-driven gene transcription. FOXP3 may act differently on various promoters to modulate transcription and its effect may be dependent on other proteins that bind concurrently with FOXP3. Nevertheless, over-expression of NFAT2 is capable of overcoming the repressive effects of FOXP3 on cytokine production.
Because NFAT proteins are master regulators of CD4+ T cell derived cytokine transcription, it teleologically makes sense for NFAT proteins to be a major target for down-modulating immune responses and for maintaining an anergic state (34). FOXP3 may be particularly effective because of its ability to inhibit NFAT mediated transcription at two levels (Fig. 5): First, FOXP3 inhibits initial NFAT mediated immune responses by cooperatively binding to cytokine promoters with NFAT where it is thought to actively suppress transcription(6). Second, it suppresses the second wave of NFAT activation by inhibiting the upregulation of NFAT2 in response T cell activation thereby maintaining the level of activated NFAT proteins below that required for transcriptional activation(33). NFAT2, in particular, seems to be an attractive target of inhibition in FOXP3-expressing TREG cells since in addition to its role in maintaining cytokine transcription, NFAT2 may also be critical for lineage commitment to CD4+ T cell effector function(10). Thus, by inhibiting NFAT2 transcription directly via the NFAT2 promoter, FOXP3 is able to suppress cytokine expression and effector cell development simultaneously.
Acknowledgments
Supported by NIH grants HD043376-03 (TRT), HD17427 (HDO), P20RR016478 (MC), 5U19AI062629 (MC), P20RR15577 (MC), P20RR17703 (MC), R01AI070807 (ADW) and R01AR48257 (RQC). Also supported by USIDNet grant N01-AI30070 (TRT), the Biesecker Pediatric Liver Center (ADW), and OCAST grant HR04-110 (MC).
Abbreviations
- FOXP3
Forkhead Box P3
References
- 1.Ochs HD, Ziegler SF, Torgerson TR. FOXP3 acts as a rheostat of the immune response. Immunol Rev. 2005;203:156–164. doi: 10.1111/j.0105-2896.2005.00231.x. [DOI] [PubMed] [Google Scholar]
- 2.Sakaguchi S, Ono M, Setoguchi R, Yagi H, Hori S, Fehervari Z, Shimizu J, Takahashi T, Nomura T. Foxp3+ CD25+ CD4+ natural regulatory T cells in dominant self-tolerance and autoimmune disease. Immunol Rev. 2006;212:8–27. doi: 10.1111/j.0105-2896.2006.00427.x. [DOI] [PubMed] [Google Scholar]
- 3.Schubert LA, Jeffery E, Zhang Y, Ramsdell F, Ziegler SF. Scurfin (FOXP3) acts as a repressor of transcription and regulates T cell activation. J Biol Chem. 2001;276:37672–37679. doi: 10.1074/jbc.M104521200. [DOI] [PubMed] [Google Scholar]
- 4.Bettelli E, Dastrange M, Oukka M. Foxp3 interacts with nuclear factor of activated T cells and NF-kappa B to repress cytokine gene expression and effector functions of T helper cells. Proc Natl Acad Sci U S A. 2005;102:5138–5143. doi: 10.1073/pnas.0501675102. [DOI] [PMC free article] [PubMed] [Google Scholar]
- 5.Lopes JE, Torgerson TR, Schubert LA, Anover SD, Ocheltree EL, Ochs HD, Ziegler SF. Analysis of FOXP3 reveals multiple domains required for its function as a transcriptional repressor. J Immunol. 2006;177:3133–3142. doi: 10.4049/jimmunol.177.5.3133. [DOI] [PubMed] [Google Scholar]
- 6.Wu Y, Borde M, Heissmeyer V, Feuerer M, Lapan AD, Stroud JC, Bates DL, Guo L, Han A, Ziegler SF, Mathis D, Benoist C, Chen L, Rao A. FOXP3 controls regulatory T cell function through cooperation with NFAT. Cell. 2006;126:375–387. doi: 10.1016/j.cell.2006.05.042. [DOI] [PubMed] [Google Scholar]
- 7.Macian F. NFAT proteins: key regulators of T-cell development and function. Nat Rev Immunol. 2005;5:472–484. doi: 10.1038/nri1632. [DOI] [PubMed] [Google Scholar]
- 8.Zhou B, Cron RQ, Wu B, Genin A, Wang Z, Liu S, Robson P, Baldwin HS. Regulation of the murine Nfatc1 gene by NFATc2. J Biol Chem. 2002;277:10704–10711. doi: 10.1074/jbc.M107068200. [DOI] [PubMed] [Google Scholar]
- 9.Chuvpilo S, Jankevics E, Tyrsin D, Akimzhanov A, Moroz D, Jha MK, Schulze-Luehrmann J, Santner-Nanan B, Feoktistova E, Konig T, Avots A, Schmitt E, Berberich-Siebelt F, Schimpl A, Serfling E. Autoregulation of NFATc1/A expression facilitates effector T cells to escape from rapid apoptosis. Immunity. 2002;16:881–895. doi: 10.1016/s1074-7613(02)00329-1. [DOI] [PubMed] [Google Scholar]
- 10.Serfling E, Chuvpilo S, Liu J, Hofer T, Palmetshofer A. NFATc1 autoregulation: a crucial step for cell-fate determination. Trends Immunol. 2006;27:461–469. doi: 10.1016/j.it.2006.08.005. [DOI] [PubMed] [Google Scholar]
- 11.Yu X, Tang Y, Li F, Frank MB, Huang H, Dozmorov I, Zhu Y, Centola M, Cao W. Protection against hydrogen peroxide-induced cell death in cultured human retinal pigment epithelial cells by 17beta-estradiol: a differential gene expression profile. Mech Ageing Dev. 2005;126:1135–1145. doi: 10.1016/j.mad.2005.05.005. [DOI] [PubMed] [Google Scholar]
- 12.Dozmorov I, Centola M. An associative analysis of gene expression array data. Bioinformatics. 2003;19:204–211. doi: 10.1093/bioinformatics/19.2.204. [DOI] [PubMed] [Google Scholar]
- 13.Edgar R, Domrachev M, Lash AE. Gene Expression Omnibus: NCBI gene expression and hybridization array data repository. Nucleic Acids Res. 2002;30:207–210. doi: 10.1093/nar/30.1.207. [DOI] [PMC free article] [PubMed] [Google Scholar]
- 14.Cron RQ. CD154 transcriptional regulation in primary human CD4 T cells. Immunol Res. 2003;27:185–202. doi: 10.1385/IR:27:2-3:185. [DOI] [PubMed] [Google Scholar]
- 15.Cron RQ, Bandyopadhyay R, Genin A, Brunner M, Kersh GJ, Yin J, Finkel TH, Crow MK. Early growth response-1 is required for CD154 transcription. J Immunol. 2006;176:811–818. doi: 10.4049/jimmunol.176.2.811. [DOI] [PMC free article] [PubMed] [Google Scholar]
- 16.Chen C, Rowell EA, Thomas RM, Hancock WW, Wells AD. Transcriptional regulation by Foxp3 is associated with direct promoter occupancy and modulation of histone acetylation. J Biol Chem. 2006;281:36828–36834. doi: 10.1074/jbc.M608848200. [DOI] [PubMed] [Google Scholar]
- 17.Brunkow ME, Jeffery EW, Hjerrild KA, Paeper B, Clark LB, Yasayko SA, Wilkinson JE, Galas D, Ziegler SF, Ramsdell F. Disruption of a new forkhead/winged-helix protein, scurfin, results in the fatal lymphoproliferative disorder of the scurfy mouse. Nat Genet. 2001;27:68–73. doi: 10.1038/83784. [DOI] [PubMed] [Google Scholar]
- 18.Marson A, Kretschmer K, Frampton GM, Jacobsen ES, Polansky JK, MacIsaac KD, Levine SS, Fraenkel E, von Boehmer H, Young RA. Foxp3 occupancy and regulation of key target genes during T-cell stimulation. Nature. 2007;445:931–935. doi: 10.1038/nature05478. [DOI] [PMC free article] [PubMed] [Google Scholar]
- 19.Zheng Y, Josefowicz SZ, Kas A, Chu TT, Gavin MA, Rudensky AY. Genome-wide analysis of Foxp3 target genes in developing and mature regulatory T cells. Nature. 2007;445:936–940. doi: 10.1038/nature05563. [DOI] [PubMed] [Google Scholar]
- 20.Ocklenburg F, Moharregh-Khiabani D, Geffers R, Janke V, Pfoertner S, Garritsen H, Groebe L, Klempnauer J, Dittmar KE, Weiss S, Buer J, Probst-Kepper M. UBD, a downstream element of FOXP3, allows the identification of LGALS3, a new marker of human regulatory T cells. Lab Invest. 2006;86:724–737. doi: 10.1038/labinvest.3700432. [DOI] [PubMed] [Google Scholar]
- 21.Pfoertner S, Jeron A, Probst-Kepper M, Guzman CA, Hansen W, Westendorf AM, Toepfer T, Schrader AJ, Franzke A, Buer J, Geffers R. Signatures of human regulatory T cells: an encounter with old friends and new players. Genome Biol. 2006;7:R54.1–R54.18. doi: 10.1186/gb-2006-7-7-r54. [DOI] [PMC free article] [PubMed] [Google Scholar]
- 22.Sugimoto N, Oida T, Hirota K, Nakamura K, Nomura T, Uchiyama T, Sakaguchi S. Foxp3-dependent and -independent molecules specific for CD25+CD4+ natural regulatory T cells revealed by DNA microarray analysis. Int Immunol. 2006;18:1197–1209. doi: 10.1093/intimm/dxl060. [DOI] [PubMed] [Google Scholar]
- 23.Fontenot JD, Rasmussen JP, Williams LM, Dooley JL, Farr AG, Rudensky AY. Regulatory T cell lineage specification by the forkhead transcription factor foxp3. Immunity. 2005;22:329–341. doi: 10.1016/j.immuni.2005.01.016. [DOI] [PubMed] [Google Scholar]
- 24.Zhou B, Wu B, Tompkins KL, Boyer KL, Grindley JC, Baldwin HS. Characterization of Nfatc1 regulation identifies an enhancer required for gene expression that is specific to pro-valve endocardial cells in the developing heart. Development. 2005;132:1137–1146. doi: 10.1242/dev.01640. [DOI] [PubMed] [Google Scholar]
- 25.Chen W, Jin W, Hardegen N, Lei KJ, Li L, Marinos N, McGrady G, Wahl SM. Conversion of peripheral CD4+CD25− naive T cells to CD4+CD25+ regulatory T cells by TGF-beta induction of transcription factor Foxp3. J Exp Med. 2003;198:1875–1886. doi: 10.1084/jem.20030152. [DOI] [PMC free article] [PubMed] [Google Scholar]
- 26.Fantini MC, Becker C, Monteleone G, Pallone F, Galle PR, Neurath MF. Cutting edge: TGF-beta induces a regulatory phenotype in CD4+CD25− T cells through Foxp3 induction and down-regulation of Smad7. J Immunol. 2004;172:5149–5153. doi: 10.4049/jimmunol.172.9.5149. [DOI] [PubMed] [Google Scholar]
- 27.Fu S, Zhang N, Yopp AC, Chen D, Mao M, Zhang H, Ding Y, Bromberg JS. TGF-beta Induces Foxp3 + T-Regulatory Cells from CD4 + CD25 − Precursors. Am J Transplant. 2004;4:1614–1627. doi: 10.1111/j.1600-6143.2004.00566.x. [DOI] [PubMed] [Google Scholar]
- 28.Rao PE, Petrone AL, Ponath PD. Differentiation and Expansion of T Cells with Regulatory Function from Human Peripheral Lymphocytes by Stimulation in the Presence of TGF-{beta} J Immunol. 2005;174:1446–1455. doi: 10.4049/jimmunol.174.3.1446. [DOI] [PubMed] [Google Scholar]
- 29.Carlsson P, Mahlapuu M. Forkhead transcription factors: key players in development and metabolism. Dev Biol. 2002;250:1–23. doi: 10.1006/dbio.2002.0780. [DOI] [PubMed] [Google Scholar]
- 30.Gavin MA, Rasmussen JP, Fontenot JD, Vasta V, Manganiello VC, Beavo JA, Rudensky AY. Foxp3-dependent programme of regulatory T-cell differentiation. Nature. 2007;445:771–775. doi: 10.1038/nature05543. [DOI] [PubMed] [Google Scholar]
- 31.Rao A, Luo C, Hogan PG. Transcription factors of the NFAT family: regulation and function. Annu Rev Immunol. 1997;15:707–747. doi: 10.1146/annurev.immunol.15.1.707. [DOI] [PubMed] [Google Scholar]
- 32.Li B, Samanta A, Song X, Furuuchi K, Iacono KT, Kennedy S, Katsumata M, Saouaf SJ, Greene MI. FOXP3 ensembles in T-cell regulation. Immunol Rev. 2006;212:99–113. doi: 10.1111/j.0105-2896.2006.00405.x. [DOI] [PubMed] [Google Scholar]
- 33.Fiering S, Northrop JP, Nolan GP, Mattila PS, Crabtree GR, Herzenberg LA. Single cell assay of a transcription factor reveals a threshold in transcription activated by signals emanating from the T-cell antigen receptor. Genes Dev. 1990;4:1823–1834. doi: 10.1101/gad.4.10.1823. [DOI] [PubMed] [Google Scholar]
- 34.Macian F, Garcia-Cozar F, Im SH, Horton HF, Byrne MC, Rao A. Transcriptional mechanisms underlying lymphocyte tolerance. Cell. 2002;109:719–731. doi: 10.1016/s0092-8674(02)00767-5. [DOI] [PubMed] [Google Scholar]