Abstract
Background
Examination of the evolutionary dynamics of complete influenza viral genomes reveals that other processes, in conjunction with antigenic drift, play important roles in viral evolution and selection, but there is little biological evidence to support these genomic data. Previous work demonstrated that after the A/Fujian/411/2002-like H3N2 influenza A epidemic during 2003–2004, a preexisting nondominant Fujian-like viral clade gained a small number of changes in genes encoding the viral polymerase complex, along with several changes in the antigenic regions of hemagglutinin, and in a genome-wide selective sweep, it replaced other co-circulating H3N2 clades.
Methods
Representative strains of these virus clades were evaluated in vitro and in vivo.
Results
The newly dominant 2004–2005 A/California/7/2004-like H3N2 clade, which featured 2 key amino acid changes in the polymerase PA segment, grew to higher titers in MDCK cells and ferret tissues and caused more-severe disease in ferrets. The polymerase complex of this virus demonstrated enhanced activity in vitro, correlating directly to the enhanced replicative fitness and virulence in vivo.
Conclusion
These data suggest that influenza strains can be selected in humans through mutations that increase replicative fitness and virulence, in addition to the well-characterized antigenic changes in the surface glycoproteins.
Influenza A viruses are negative-strand segmented RNA viruses of the family Orthomyxoviridae that infect humans and a wide variety of animal species. Although there remains concern about the emergence of a pandemic influenza virus [1, 2], seasonal influenza epidemics consistently cause morbidity and mortality globally. Influenza viruses infect 5%–15% of the global population annually, resulting in ~500,000 deaths [3, 4]. In the United States, influenza is estimated to kill 36,000 people in an average year [5], which is significantly higher than the 15,000 deaths annually associated with AIDS [6]. Every few years, influenza epidemics boost annual mortality above average levels, causing 10,000–15,000 additional deaths [3, 4].
Influenza pandemics occur sporadically, characterized by a change in the viral hemagglutinin (HA) subtype through reassortment or introduction of a new virus (antigenic shift). Interpandemic influenza, in contrast, occurs yearly and has been characterized by acquisition of point mutations in the viral HA1 domain encoding the major antigenic sites of the HA protein, leading to serial antigenic change (antigenic drift) [7–9]. Recent studies have addressed the genomic evolutionary biology of interpandemic influenza [4, 10–13], suggesting that other viral features may play significant roles in strain selection and evolution. Co-circulation of multiple, genetically distinct strains leading to mixed infection and frequent intrasubtypic reassortment events [10, 12–14], as well as periodic “genome-wide selective sweeps’” characterized by the selection of a single clonal strain and the extinction of co-circulating strains [13], represent newly demonstrated evolutionary mechanisms, but biological correlations that lead to these phenomena are not well established.
One important evolutionary event involved the emergence of the A/Fujian/411/2002-like (Fujian-like) viruses associated with the moderately severe epidemic of the 2003–2004 influenza season [16–18]. With diminished protection afforded by the influenza vaccine strains, pneumonia and influenza deaths in the United States during the 2003–2004 season exceeded the epidemic threshold for 9 consecutive weeks [19]. During the 2004–2005 A/California/7/2004-like (California-like) influenza season, the pneumonia and influenza deaths exceeded the epidemic threshold for 10 consecutive weeks [20]. During these seasons, the Centers for Disease Control and Prevention (CDC) reported an increase in deaths among children that was above the epidemic threshold [19–21].
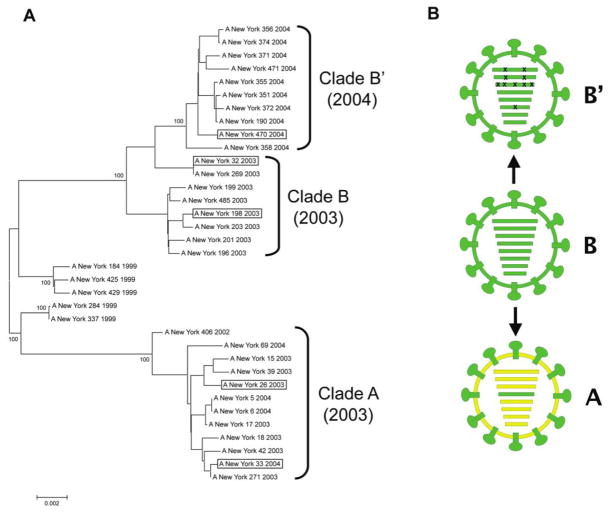
Studies of Fujian-like viruses demonstrated the emergence of a major antigenic variant during the 2003–2004 influenza season that was derived from reassortment of 2 distinct clades of co-circulating H3N2 viruses, rather than by antigenic drift [10, 22]. These reassortant viruses contained the Fujian-like HA gene from a minor co-circulating H3N2 lineage (clade B) and the other 7 gene segments from the major circulating lineage (clade A) [10]. During the next influenza season, 2004–2005, another unexpected evolutionary event occurred. The clade A lineage that made up the majority of the H3N2 viruses during the 2003–2004 season was largely supplanted in 2004–2005 by the unreassorted clade B viruses, which acquired several HA antigenic changes to be become California-like [23, 24], but which also acquired a small number of amino acid mutations in the genes encoding the viral ribonucleoprotein complex (RNP). This derivative clade, termed here clade B′, caused a genome-wide selective sweep; that is, the replacement of the clade A viruses by the clade B′ viruses was so complete that the overall diversity of the circulating H3N2 viruses was dramatically reduced [12–14] (Figure 1).
Figure 1.
Genomic analyses of Fujian-like H3N2 viruses. A, Evolutionary relationships of concatenated major coding regions of influenza A viruses sampled in New York State during the period 1999–2004. The complete genomes of 35 human H3N2 influenza A virus isolates were downloaded from the National Center for Biotechnology Information Influenza Virus Resource [15]. The major open reading frames of 6 of the gene segments (excluding HA and NA) were concatenated as a 9639 base sequence. Sequences were aligned using the neighbor-joining algorithm of Molecular Evolutionary Genetics Analysis software, version 3.1 [31], and were bootstrapped 1000 times. Bootstrap values for key nodes are shown. Boxed viruses indicate the members of each clade selected as representative in this study. B, Diagrammatic representations of the 3 genome constellations of Fujian-like and California-like H3N2 viruses are shown. Gene segments shown in RNA segment order: PB2, PB1, PA, HA, NA, NP, M, NS. The clade A virus (yellow) is shown as a reassortant containing the HA gene segment (green) and HA surface protein derived from clade B viruses, as described elsewhere [10]. The 10 coding mutations contained in the 4 gene segments constituting the viral RNP of the clade B′ viruses are indicated by Xs over the PB2, PB1, PA, and NP segments. (See supplementary figure 3 of Rambaut et al [13] for phylogenetic trees of each gene segment).
In this study, we examined the hypothesis that Fujian-like viruses from the 2003–2004 influenza season (clades A and B) and the derivative California-like strain associated with the dominant selective sweep in 2004–2005 (clade B′) would exhibit different phenotypic properties that correlated with the selection of clade B′ viruses in 2004–2005 [13, 14]. The phenotypic properties of representative viruses from each clade were characterized in both cell culture and ferrets, and the role of the small number of amino acid mutations in the internal segments encoding the viral RNP of the clade B′ viruses was examined using an in vitro reporter assay.
METHODS
Viruses
Representative viruses NY26 [A/New York/26/2003 (H3N2)] and NY33 [A/New York/33/2004 (H3N2)] (clade A); NY32 [A/New York/32/2003 (H3N2)] and NY198 [A/New York/198/2003 (H3N2)] (clade B); and NY470 [A/New York/470/2004 (H3N2)] (clade B′) were provided by Kirsten St. George at the New York State Department of Health (Albany, New York). Viruses were passaged in MDCK cells (ATCC CCL-34) in Dulbecco’s Modified Eagle’s Medium (DMEM; Quality Biological) containing 1 μg/mL TPCK-Trypsin (Sigma-Aldrich). Viral titers were determined by plaque assay and were expressed as plaque forming units per milliliter (pfu/mL) using standard protocols [25]. A hemagglutination inhibition assay was performed on all viruses using standard methods [25]. Anti-A/Fujian/411/02/H3N2 [Fujian411] ferret reference serum was supplied by Maryna Eichelberger at the US Food and Drug Administration, and the A/NY/312/01/H1N1 [NY312] virus was used as control.
Viral growth curves
MDCK cells were infected with 0.01 multiplicity of infection. Plates were incubated for 1 h at 37°C. Cells were washed, and DMEM containing 1 μg/mL TPCK-Trypsin was added. Cells were incubated at 37°C. Every 12 h, 500 μL of supernatant was collected. Titers were determined using standard plaque assays [26]. Mean titers are reported as pfu/mL. Growth curve titrations were performed 3 times for each virus.
Animal experiments
All animal experiments were performed following National Institutes of Health Institutional Animal Care and Use Committee–approved protocols and guidelines in an Animal Biosafety Level 2 facility. Sixteen 5-month-old male ferrets were purchased from Triple F Farms. Animals with no evidence of neutralizing antibodies to A/New Caledonia/20/00/H1N1, A/NY/55/04/H3N2, and B/Jiangsu/10/03 were used. After a 5-day acclimatization period, animals were anesthetized using Ketamine (100 mg/mL; Vedco), Atropine (0.4 mg/mL; Baxter Healthcare), and Xylazine (100 mg/mL; Akom) and were inoculated intranasally with 106 pfu in 1 mL of DMEM. Four ferrets were inoculated with each virus, and 4 were inoculated with DMEM.
Body temperature and weight were assessed and a physical examination was performed daily. A clinical score was assigned from 0–5 by a blinded investigator. One point was assigned for each of the following: decreased activity, decreased eating habits or diarrhea, nasal crusting or discharge, active sneezing, and respiratory distress. The score is a sum of the points assigned.
On day 4 and day 14 after inoculation, 2 ferrets from each group were humanely euthanized. Whole lungs were harvested, one-half of the lung was frozen for virus titration, and the rest was fixed in 10% neutral-buffered formalin for histopathological analysis. Nasal turbinate tissue was stored.
Tissue virus titrations
Frozen tissues were thawed, weighed, and homogenized in sterile cold Leibovitz medium (Gibco L-15; Invitrogen) containing 1 × penicillin, streptomycin, and amphotericin B (Gibco Anti-Anti, Invitrogen). Standard plaque assays were performed [26]. Titers are expressed as pfu per gram of tissue.
Histopathological analysis
Slides were prepared by American HistoLabs (Gaithersburg, MD), and 5-μm sections of lung tissue were placed on positively charged slides. Slides were de-paraffinized and stained with hematoxylin and eosin. The histopathological characteristics of the slides were reviewed by a single pathologist.
Plasmids
The complementary DNA was synthesized as described [27]. Full-length complementary DNA of the PB1, PB2, PA, and NP segments of all viruses were individually cloned into the pCAGGS/MCS protein expression vector [28], supplied by Adolfo García-Sastre at the Mt. Sinai School of Medicine (New York, NY). Three mutant clones were constructed from the NY470 PA using the QuikChange Multi Site Directed Mutagenesis Kit (Stratagene), with 1 clone containing the M62V mutation, 1 clone containing the Q256K mutation, and 1 clone containing both mutations.
The green fluorescent protein (GFP) reporter construct contained the GFP open reading frame flanked by a human polymerase I promoter and mouse RNA polymerase I terminator in the pHH21 vector [29]. This construct was obtained from Andrew Mehle at the University of California (Berkeley, CA) [30].
Transfections
Transfections were performed in human non–small cell lung carcinoma H1299 cells (ATCC CRL-5803) propagated in Roswell Park Memorial Institute 1640 media and 10% fetal bovine serum (Invitrogen). A total of 400 ng of the pHH21-GFP construct and each of the pCAGGS constructs containing 1 of the 4 RNP segments were transfected using the Effectene transfection reagent (Qiagen). Transfections were incubated at 37°C for 48 h. All transfections were performed a minimum of 3 times.
Measurement of GFP
Cells were treated with TrypLE Express (Invitrogen) and analyzed using a FACS Canto II (BD Biosciences). The fluorescein isothiocyanate channel was used to record fluorescence intensity. Data were analyzed using FlowJo, version 8.7.1 (TreeStar).
Statistical analysis
Differences in tissue viral titers and clinical parameters were tested for statistical significance with Student’s t test, and 95% confidence intervals were generated to evaluate differences in mean fluorescence intensity and in vitro wild-type viral titers. Graphpad Prism software was used for analysis.
Phylogenetic analysis
Sequences were downloaded from the National Center for Biotechnology Information Influenza Virus Resource [15]. Alignments and neighbor-joining phylogenetic trees bootstrapped 1000 times were generated using Molecular Evolutionary Genetics Analysis software, version 3.1 [31].
RESULTS
Phylogenetic analysis
A phylogenetic tree derived from the concatenated major open reading frames of the 6 “internal” genes of a representative subset of 35 H3N2 influenza A viruses from New York is shown (Figure 1). The genome constellation of the clade A viruses is distinct from the clade B and derivative clade B′ viruses. A small number of amino acid changes in each gene segment distinguish the clade B and B′ viruses (Figure 2). The isolates in each clade share high levels of identity at the amino acid level. Alignments of the concatenated major “internal” open frames (containing 3212 amino acids) show an intraclade percentage identity range of 99.7%–100%. The range of interclade identity between clade A and clade B is 98.6%–98.9%.
Figure 2.
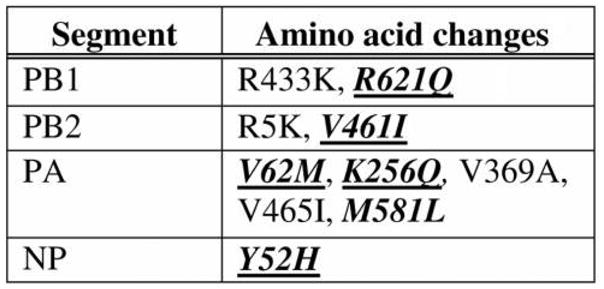
Amino acid sequence changes from clade B (NY32) to clade B′ (NY470) in the 4 ribonucleoprotein proteins. Bold italics indicate amino acid changes that were not found in either NY26 (clade A) or NY32 (clade B). Underlined changes were fixed in subsequent clade B′ progeny viruses. R433K is R in NY32 (clade B) and K in NY470 (clade B′).
Evaluation of the coding sequences from the RNP of each virus reveals 10 amino acid changes between NY32 (clade B) and NY470 (clade B′). Only 6 changes are unique to the clade B′ viruses, compared with clade A. The largest number of unique changes was found in PA. One amino acid change in each of the PB1, PB2, and the NP segments, and 2 of the 3 changes (V62M and K256Q) found in the PA segment of the clade B′ viruses are conserved in progeny H3N2 viruses occurring after the 2004–2005 season. The 2 changes found in the PA segment are unique to clade B′ viruses and their descendants. In an alignment of 929 PA sequences from human H3N2 viruses isolated from 1968 through 2002, none contained these changes. In addition, these changes are not observed in the PA of 748 human H1N1 viruses from 1918–2008 or in the 69 available PA sequences from human H2N2 viruses from 1957–1968. In an alignment of 1565 avian influenza PA sequences, a methionine at position 62 was seen in only 1 sequence, and a glutamine at position 256 was not found. The remaining 3 conserved amino acid changes from the PB1, PB2, and NP segments are found as preexisting polymorphisms in multiple human influenza viruses before 2003.
Despite the NY470 virus HA bearing changes in the antigenic domains associated with the A/California/7/2004-like drift variant, all 3 viruses showed a strong Fujian-like reactivity, with NY470 and NY26 exhibiting a titer of 1:640, and NY32 exhibiting a titer of 1:1280. The A/NY/312/2001 (H1N1) virus showed no inhibition of hemagglutination.
Viral growth curves
Viral growth was evaluated. By 12 h, the NY470 (clade B′) virus had grown to a significantly higher titer than the clade A or clade B viruses, maintaining a 1–2 log higher titer at each time point (Figure 3).
Figure 3.
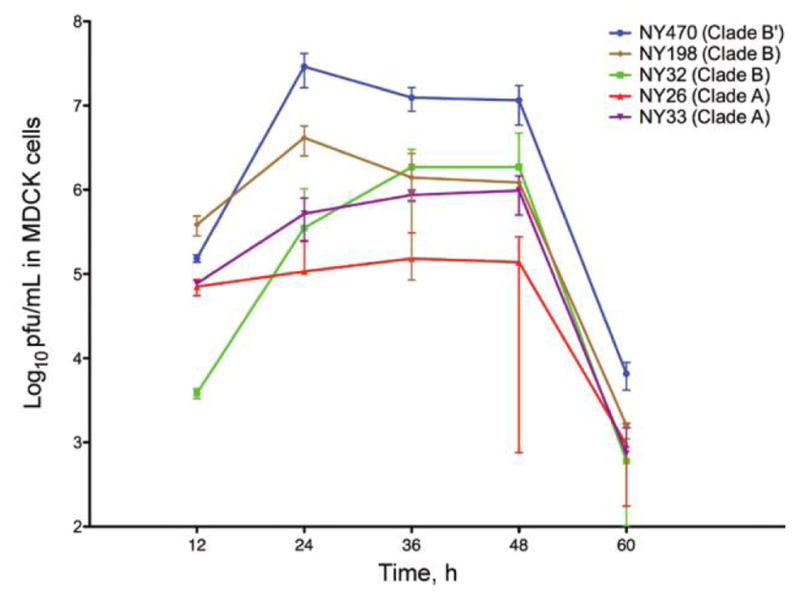
Viral replication kinetics in MDCK cells at 37°C. Cells infected with 0.01 multiplicity of infection of virus. Supernatants from infected MDCK cells were collected at 12 h intervals, and viral titer was determined by plaque assay. Cultures and measurements were performed in triplicate. Error bars represent 95% confidence intervals.
Ferret clinical disease
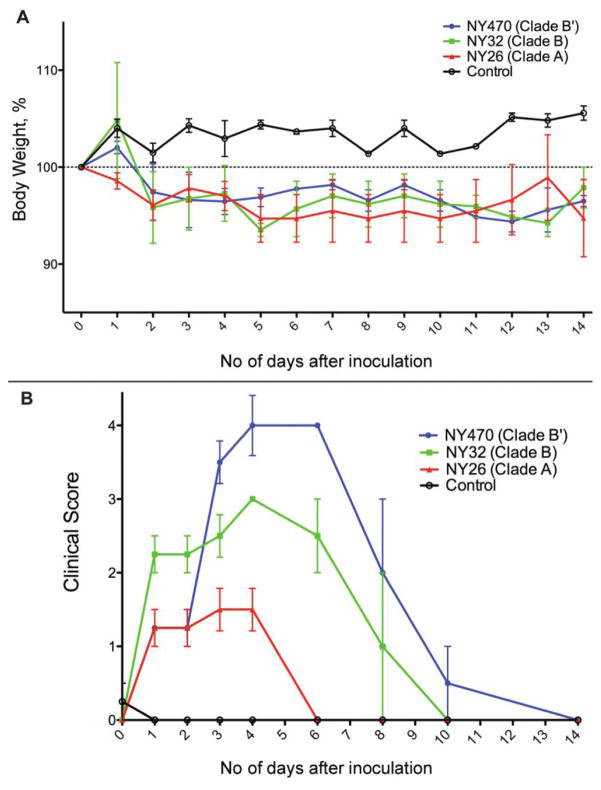
One representative clade A and clade B virus was selected along with the clade B′ virus for evaluation in vivo. Signs of clinical illness were observed after 24 h in all ferrets that were inoculated with virus. Weight loss, from 2%–5% by the end of 14 days, was similar in all 3 virus-inoculated groups. Control ferrets showed consistent weight gain (Figure 4A). Body temperatures varied, and no statistically significant difference was observed (data not shown).
Figure 4.
Clinical course of infection in ferrets. A, Mean percentage weight loss from mean baseline weight of ferrets in each group for 0–14 days after virus inoculation. All 12 inoculated ferrets lost weight during the experiment (4 ferrets were in each virus inoculated group), whereas the 4 ferrets in the control group gained weight. Error bars represent standard error of the mean (SEM). B, Mean clinical score of ferrets in each group for 0–14 days after inoculation. Ferrets were given 1 point for each of 5 clinical illness parameters. The NY470 (clade B′)–inoculated ferrets had statistically significantly higher clinical scores than did ferrets inoculated with either the NY32 (clade B) or NY26 (clade A) viruses. Error bars represent SEM.
Ferrets inoculated with NY470 (clade B′) showed significant illness and on day 4 had a statistically significantly higher clinical score than NY32 (clade B) or NY26 (clade A) virus-inoculated ferrets (P = .049 and P = .003, respectively. These animals had the highest clinical scores after day 2 and exhibited clinical symptoms throughout the 14 days, whereas the other ferrets began to recover by day 8 (Figure 4B). They also exhibited more-severe symptoms, consisting of more-active sneezing and nasal discharge, as well as greater lethargy and dehydration, which prompted the facility veterinarian to provide supportive care consisting of special nutrition and monitoring. NY32 (clade B) virus–inoculated ferrets had a higher clinical score than did NY26 (clade A) virus–inoculated ferrets on day 4 (P = .002); throughout the study, their scores continued to be higher.
Virus growth in ferret tissues
The NY470 (clade B′) virus grew to a 10-fold and 100-fold higher titer than did NY32 (clade B) or NY26 (clade A), respectively (P = .034 and P = .019, respectively) in nasal turbinate tissue. The NY32 virus grew to a statistically significantly higher titer than did NY26 (P = .012) (Figure 5). No virus was detected on day 14 in the nasal turbinates of any animal (data not shown).
Figure 5.
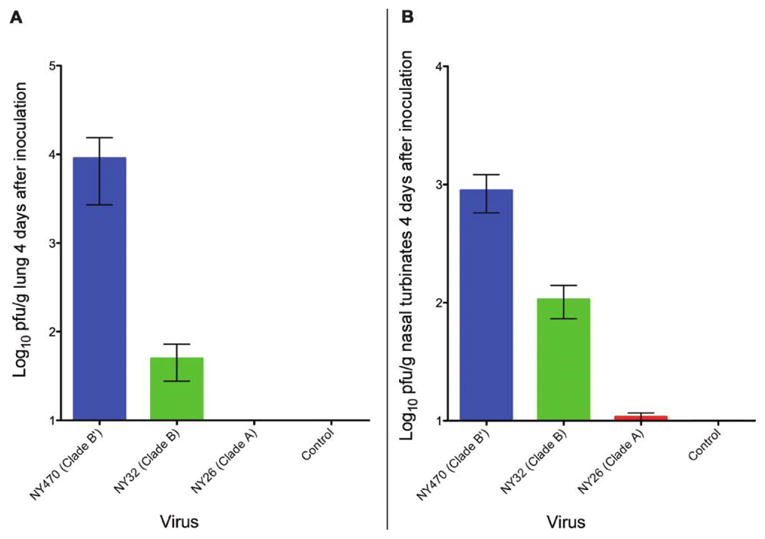
Viral titer in ferret tissues. A, Mean viral titer of the 3 viruses in ferret lungs on day 4 as determined by plaque assay. Data was collected from 2 ferrets in each group, and plaque assays were performed in triplicate. Error bars represent standard error of the mean (SEM). (B) Mean viral titer of the 3 viruses in ferret nasal turbinates on day 4 as determined by plaque assay. Data were collected from 2 ferrets in each group, and assays were performed in triplicate. Error bars represent SEM.
NY470 (clade B′) grew from the lung tissue at a 2 log–higher titer than did NY32 (clade B), a difference that was not statistically significant (P = .187). Both NY470 and NY32 grew to a significantly higher titer than the NY26 (clade A) virus, because it failed to grow from the lung tissue obtained on day 4 (Figure 5). No virus was recovered from the lungs of any animal on day 14 (data not shown).
Ferret lung pathology
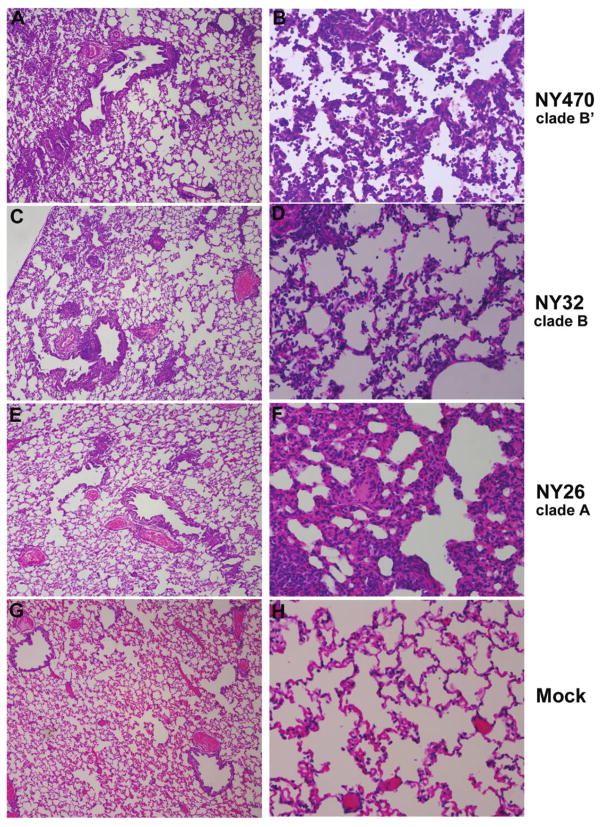
Histopathological examination of lung tissue on day 4 revealed a similar pattern of pathology in the NY470 (clade B′) and NY32 (clade B) inoculated ferrets. There were focal areas throughout the lung of bronchiolitis, alveolitis, and a mixed inflammatory infiltrate consisting of many neutrophils. The pathology was more widespread and more severe among the NY470-inoculated ferrets than it was among those inoculated with NY32 (Figure 6). The lungs of NY26 (clade A)–inoculated ferrets also showed histopathologic changes, but the pathology was more focal, less widespread, and different in nature, consisting of a mild focal bronchiolitis with no alveolitis and a focal interstitial mixed inflammatory infiltrate; predominantly lymphocytes and histiocytes (Figure 6). The control ferrets displayed no histopathologic abnormalities (Figure 6).
Figure 6.
Ferret lung pathology 4 days after inoculation. Lungs from 2 ferrets in each group were evaluated on day 4. Photomicrographs of hematoxylin and eosin–stained 5-μm tissue sections are shown. The lungs of NY470 (clade B′)–inoculated ferrets showed moderate-to-marked alveolitis and bronchiolitis with many neutrophils (A, B). NY32 (clade B) induced a similar pathology, with a mild bronchiolitis and focal alveolitis (C, D). NY26 (clade A) caused a significantly different pattern of pathology with mild focal bronchiolitis and a focal interstitial pneumonitis with a lymphocytic-histiocytic infiltrate (E, F). For figures A, C, E, G: original magnification, ×40; for figures B, D, F, and H: original magnification, ×200.
On day 14, the NY470-infected ferret lung tissue showed widespread interstitial fibrosis and remodeling consistent with healing (data not shown). There were areas of vascular thrombosis and alveolar edema. The NY32-infected ferret lung tissues showed a similar pathology of interstitial fibrosis and remodeling but no evidence of thrombosis or alveolar edema. The NY26-infected ferrets exhibited only very small areas of interstitial fibrosis and repair. No histopathologic abnormalities were seen in controls.
In vitro RNP assay
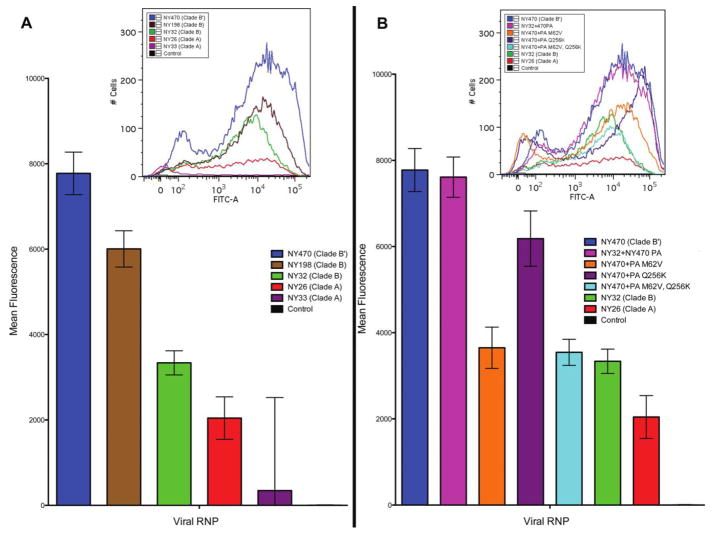
The NY470 (clade B′) RNP produced a statistically significantly higher mean fluorescence, compared with that of the clade B or clade A RNP plasmid sets (Figure 7A). The NY470 PA substituted into the NY32 RNP set (with the PB2, PB1, and NP plasmids being derived from NY32) exhibited a marked increase in fluorescence, similar to that for the NY470 RNP (Figure 7B).
Figure 7.
In vitro ribonucleoprotein (RNP) reporter assay. All transfections and measurements were performed in triplicate. A, Mean fluorescence intensity of GFP -positive cells in transfections measured by flow cytometry. The NY470 (clade B′) virus RNP showed significantly more activity than did the NY198 and NY32 (clade B) RNP, as well as the NY26 and NY33 (clade A) RNP, exhibiting greater GFP expression in H1299 cells. Error bars represent 95% confidence intervals. B, When the NY470 PA segment is substituted for the NY32 PA segment, increased GFP expression is seen, similar to that of the wild-type NY470 RNP. When each of 2 key mutations are made at position 62 and 256 in the NY470 PA segment to revert to a more clade B–like PA, a significant decrease in GFP expression is observed, and when both mutations are present, activity is most similar to that of the wild-type NY32 RNP. Error bars represent 95% confidence intervals.
Introducing the 2 identified back mutations (M62V and Q256K) in the PA evaluated with wild-type NY470 PB2, PB1, and NP plasmids generated a marked reduction in fluorescence. This was statistically significantly lower than that for the wild-type NY470 RNP (Figure 7B) and overlapped the results from the NY32 (clade B) RNP. Both single back mutation–containing PA segments were evaluated in the assay with the wild-type NY470 PB2, PB1, and NP plasmids, and both generated a decrease in fluorescence, compared with the wild type NY470.
DISCUSSION
In this study, 3 contemporary, human, antigenically similar H3N2 influenza viruses varied significantly in their replicative fitness and pathogenicity. The different glycan specificities of the reassortant clade A viruses HA and neuraminidase may have contributed to a reduced fitness [32], but it did not impede this clade from becoming dominant during the 2003–2004 influenza season. The genome-wide selective sweep associated with emergence of the California-like clade B′ viruses in 2004–2005 was associated with the acquisition of a small number of mutations in proteins making up the RNP complex, 2 of which were unique PA gene mutations that have never been identified in avian or human influenza viruses before the 2004–2005 season and were maintained in progeny viruses. In this study, higher growth in MDCK cells in vitro and in H3N2-naive ferrets in vivo suggests that enhanced replicative fitness, in addition to the acquisition of key antigenic changes in HA, may have played a significant role in the selection of these viruses as the dominant clade in 2004–2005 and in future influenza seasons.
The observation that the NY470 clade B′ virus grew to a significantly higher peak titer in vitro, and that it reached a high titer earlier and maintained a higher titer throughout the course of the 60-h culture suggests that replicative fitness may have been an important factor in viral evolution. Having acquired a small number of mutations in the RNP complex encoding genes, increased polymerase activity might account for the observed enhanced replicative fitness of the NY470 clade B′ virus.
An enhanced replicative fitness of the NY470 clade B′ virus was also demonstrated in vivo, because NY470 clade B′ virus, compared with the other viruses, had higher titers in the upper and lower ferret respiratory tract. The NY470 virus produced more-severe clinical illness and more-severe lung pathology. The added supportive veterinary care required to maintain the nutrition of the NY470-inoculated ferrets due to the severity of their illness may have lessened the difference noted in weight loss and clinical illness. The clade A NY26 virus was only recovered from the upper respiratory tract, correlating with the statistically significantly lower clinical scores seen for these animals.
The different and more-severe pathology observed in ferrets that were infected with clade B and B′ virus, compared with that observed in ferrets infected with clade A virus, was unexpected, given that these were co-circulating human influenza A/H3N2 viruses with antigenically similar HA genes. The difference in histopathology directly correlates with the differences in clinical illness observed. Because the ferrets were seronegative for influenza virus and inoculated with viruses that expressed antigenically similar HA proteins, differences in other segments beyond HA must have contributed to the significant differences in pathogenesis and clinical outcomes for these ferrets. The basis for how different genome constellations could induce such a different inflammatory response needs further investigation.
Although the clade B–inoculated and clade B′ –inoculated ferrets exhibited similar pathology, their clinical course was different, with the NY470 clade B′ –inoculated ferrets exhibiting a greater number of significant episodes of active sneezing and more nasal discharge for a longer time period, possibly making this virus more transmissible. This could be one mechanism that allowed the phenotypic differences observed to drive the evolutionary selection of the clade B′ virus in humans (a possibility to be addressed in future studies).
The clade B′ H3N2 viruses arose from clade B viruses without reassortment; thus, a small number of amino acid differences in each of the 8 gene segments made clade B′ unique. Other than the key antigenic changes in HA, the 4 genes of the viral RNP contained the greatest number of unique genotypic differences between the NY470 clade B′ and the NY32 clade B viruses (Figure 2). The role of the 4 gene segments of the RNP complex is highlighted by the NY470 RNP clearly producing higher mean fluorescence than either the clade A or clade B virus RNP’s, demonstrating the enhanced activity of the clade B′ RNP in vitro. We therefore sought to find amino acid changes that could be directly correlated with the enhanced viral clade B′ replication and phenotypic differences. Of the coding differences in the RNP between the clade B and clade B′ viruses (Figure 1), the biological importance of 2 amino acid changes (V62M and K256Q in the PA segment) is emphasized by the fact that these 2 changes were conserved and unique to the H3N2 strains of this clade and its progeny after the 2004–2005 influenza season. V62M was fixed through 2006, whereas K256Q has remained fixed through 2008. The significance of these changes is further suggested by the observation that the NY470 clade B′ PA segment, when substituted into the NY32 clade B RNP in an in vitro reporter assay, produced a mean fluorescence similar to that of the wild-type NY470 RNP. Although amino acid changes in other segments could have contributed, our data suggest that the 2 mutations may be largely responsible for the differential activity between the clade B and clade B′ RNP. This enhanced RNP function may have given the NY470 clade B′ a replicative fitness advantage and may have played a role in evolutionary selection.
Influenza viruses have caused human pandemic and interpandemic outbreaks for centuries [33, 34]. It is clear that influenza viral evolution in humans is not solely influenced by antigenic drift of the HA protein [13]. Further study of how genotypic changes in the internal segments can influence the phenotypic properties of influenza A viruses is therefore important to elucidate the numerous genetic mechanisms by which interpandemic influenza viruses evolve. As we have done in this study, providing biological support and developing a better understanding of new mechanisms of influenza strain evolution and selection that occur, in addition to the long-understood mechanism of HA antigenic drift, may allow for the development of better strategies to mitigate the seasonal burden of influenza A and better prepare for or prevent another pandemic.
Acknowledgments
We thank Dr. Robin Kastenmayer and the National Institute of Allergy and Infectious Diseases Comparative Medicine Branch Staff, for their assistance with animal handling, and Drs. Brian Murphy, John Kash, and David Morens, for their helpful discussion and critical reading of the manuscript.
Financial support. National Institute of Allergy and Infectious Diseases and the National Institutes of Health.
Footnotes
Potential conflicts of interest: none reported.
Presented in part: 48th Interscience Conference on Antimicrobial Agents and Chemotherapy/46th Infectious Diseases Society of America Annual Meeting, Washington, D.C., October 2008.
References
- 1.Peiris JS, de Jong MD, Guan Y. Avian influenza virus (H5N1): a threat to human health. Clin Microbiol Rev. 2007;20:243–67. doi: 10.1128/CMR.00037-06. [DOI] [PMC free article] [PubMed] [Google Scholar]
- 2.Taubenberger JK, Morens DM, Fauci AS. The next influenza pandemic: can it be predicted? JAMA. 2007;297:2025–7. doi: 10.1001/jama.297.18.2025. [DOI] [PMC free article] [PubMed] [Google Scholar]
- 3.Stohr K. Influenza—WHO cares. Lancet Infect Dis. 2002;2:517. doi: 10.1016/s1473-3099(02)00366-3. [DOI] [PubMed] [Google Scholar]
- 4.Russell CA, Jones TC, Barr IG, et al. The global circulation of seasonal influenza A (H3N2) viruses. Science. 2008;320:340–6. doi: 10.1126/science.1154137. [DOI] [PubMed] [Google Scholar]
- 5.Thompson WW, Shay DK, Weintraub E, et al. Mortality associated with influenza and respiratory syncytial virus in the United States. JAMA. 2003;289:179–86. doi: 10.1001/jama.289.2.179. [DOI] [PubMed] [Google Scholar]
- 6.Centers for Disease Control and Prevention (CDC) HIV/AIDS Surveillance Report. Vol. 18. Atlanta, GA: CDC; 2008. Cases of HIV infection and AIDS in the United States and dependent areas, 2006. [Google Scholar]
- 7.Fitch WM, Leiter JM, Li XQ, Palese P. Positive Darwinian evolution in human influenza A viruses. Proc Natl Acad Sci U S A. 1991;88:4270–4. doi: 10.1073/pnas.88.10.4270. [DOI] [PMC free article] [PubMed] [Google Scholar]
- 8.Fitch WM, Bush RM, Bender CA, Subbarao K, Cox NJ. The Wilhelmine E. Key 1999 Invitational lecture: predicting the evolution of human influenza. A J Hered. 2000;91:183–5. doi: 10.1093/jhered/91.3.183. [DOI] [PubMed] [Google Scholar]
- 9.Smith DJ, Lapedes AS, de Jong JC, et al. Mapping the antigenic and genetic evolution of influenza virus. Science. 2004;305:371–6. doi: 10.1126/science.1097211. [DOI] [PubMed] [Google Scholar]
- 10.Holmes EC, Ghedin E, Miller N, et al. Whole-genome analysis of human influenza A virus reveals multiple persistent lineages and reassortment among recent H3N2 viruses. PLoS Biol. 2005;3:e300. doi: 10.1371/journal.pbio.0030300. [DOI] [PMC free article] [PubMed] [Google Scholar]
- 11.Ghedin E, Sengamalay NA, Shumway M, et al. Large-scale sequencing of human influenza reveals the dynamic nature of viral genome evolution. Nature. 2005;437:1162–6. doi: 10.1038/nature04239. [DOI] [PubMed] [Google Scholar]
- 12.Nelson MI, Simonsen L, Viboud C, et al. Stochastic processes are key determinants of short-term evolution in influenza A virus. PLoS Pathog. 2006;2:e125. doi: 10.1371/journal.ppat.0020125. [DOI] [PMC free article] [PubMed] [Google Scholar]
- 13.Rambaut A, Pybus OG, Nelson MI, Viboud C, Taubenberger JK, Holmes EC. The genomic and epidemiological dynamics of human influenza A virus. Nature. 2008;453:615–9. doi: 10.1038/nature06945. [DOI] [PMC free article] [PubMed] [Google Scholar]
- 14.Wolf YI, Viboud C, Holmes EC, Koonin EV, Lipman DJ. Long intervals of stasis punctuated by bursts of positive selection in the seasonal evolution of influenza A virus. Biol Direct. 2006;1:34. doi: 10.1186/1745-6150-1-34. [DOI] [PMC free article] [PubMed] [Google Scholar]
- 15. [Accessed 24 August 2009];National Center for Biotechnology Information Influenza Virus Resource. Available at: http://www.ncbi.nlm.nih.gov/genomes/FLU/FLU.html.
- 16.CDC. Preliminary assessment of the effectiveness of the 2003–04 inactivated influenza vaccine—Colorado, December 2003. MMWR Morb Mortal Wkly Rep. 2004;53:8–11. [PubMed] [Google Scholar]
- 17.CDC. Update: influenza activity—United States, 2003–04 season. MMWR Morb Mortal Wkly Rep. 2004;53:284–7. [PubMed] [Google Scholar]
- 18.Paget WJ, Meerhoff TJ, Meijer A. Epidemiological and virological assessment of influenza activity in Europe during the 2003–2004 season. Euro Surveill. 2005;10:107–11. [PubMed] [Google Scholar]
- 19.Centers for Disease Control and Prevention. [Accessed 17 December 2008];U.S. influenza season summary. 2003–04 Available at: http://www.cdc.gov/flu/weekly/weeklyarchives2003-2004/03-04summary.htm.
- 20.Centers for Disease Control and Prevention. [Accessed 17 December 2008];U.S. influenza season summary. 2004–05 Available at: http://www.cdc.gov/flu/weekly/weeklyarchives2004-2005/04-05summary.htm.
- 21.Guarner J, Paddock CD, Shieh WJ, et al. Histopathologic and immunohistochemical features of fatal influenza virus infection in children during the 2003–2004 season. Clin Infect Dis. 2006;43:132–40. doi: 10.1086/505122. [DOI] [PubMed] [Google Scholar]
- 22.Barr IG, Komadina N, Hurt AC, et al. An influenza A(H3) reassortant was epidemic in Australia and New Zealand in 2003. J Med Virol. 2005;76:391–7. doi: 10.1002/jmv.20374. [DOI] [PubMed] [Google Scholar]
- 23.Bragstad K, Nielsen LP, Fomsgaard A. The evolution of human influenza A viruses from 1999 to 2006: a complete genome study. Virol J. 2008;5:40. doi: 10.1186/1743-422X-5-40. [DOI] [PMC free article] [PubMed] [Google Scholar]
- 24.Pechirra P, Goncalves P, Arraiolos A, Coelho A, Rebelo-de-Andrade H. Characterization of influenza A/Fujian/411/2002(H3N2)-like viruses isolated in Portugal between 2003 and 2005. J Med Virol. 2008;80:1624–30. doi: 10.1002/jmv.21258. [DOI] [PubMed] [Google Scholar]
- 25.Cottey R, Rowe CA, Bender BS. Influenza virus. In: Coico R, editor. Current protocols in immunology. Hoboken, NJ: John Wiley & Sons; 2003. pp. 19.11.6–19.11.9.pp. 19.11.19–19.11.20. [DOI] [PubMed] [Google Scholar]
- 26.Szretter KJ, Balish AL, Katz JM. Influenza: propagation, quantification, and storage. In: Coico R, editor. Current protocols in microbiology. Hoboken, NJ: John Wiley & Sons; 2007. pp. 15G.1.11–15G.1.13. [DOI] [PubMed] [Google Scholar]
- 27.Hoffmann E, Stech J, Guan Y, Webster RG, Perez DR. Universal primer set for the full-length amplification of all influenza A viruses. Arch Virol. 2001;146:2275–89. doi: 10.1007/s007050170002. [DOI] [PubMed] [Google Scholar]
- 28.Niwa H, Yamamura K, Miyazaki J. Efficient selection for high-expression transfectants with a novel eukaryotic vector. Gene. 1991;108:193–9. doi: 10.1016/0378-1119(91)90434-d. [DOI] [PubMed] [Google Scholar]
- 29.Neumann G, Watanabe T, Ito H, et al. Generation of influenza A viruses entirely from cloned cDNAs. Proc Natl Acad Sci U S A. 1999;96:9345–50. doi: 10.1073/pnas.96.16.9345. [DOI] [PMC free article] [PubMed] [Google Scholar]
- 30.Mehle A, Doudna JA. An inhibitory activity in human cells restricts the function of an avian-like influenza virus polymerase. Cell Host Microbe. 2008;4:111–22. doi: 10.1016/j.chom.2008.06.007. [DOI] [PMC free article] [PubMed] [Google Scholar]
- 31.Kumar S, Nei M, Dudley J, Tamura K. MEGA: a biologist-centric software for evolutionary analysis of DNA and protein sequences. Brief Bioinform. 2008;9:299–306. doi: 10.1093/bib/bbn017. [DOI] [PMC free article] [PubMed] [Google Scholar]
- 32.Gulati U, Wu W, Gulati S, Kumari K, Waner JL, Air GM. Mismatched hemagglutinin and neuraminidase specificities in recent human H3N2 influenza viruses. Virology. 2005;339:12–20. doi: 10.1016/j.virol.2005.05.009. [DOI] [PubMed] [Google Scholar]
- 33.Hirsch A. Handbook of geographical and historical pathology. Vol. 1. London: New Sydenham Society; 1883. [Google Scholar]
- 34.Morens DM, Fauci AS. The 1918 influenza pandemic: insights for the 21st century. J Infect Dis. 2007;195:1018–28. doi: 10.1086/511989. [DOI] [PubMed] [Google Scholar]


