

Abstract
Efficient administration of drugs represents a leading challenge in pulmonary medicine. Dry powder aerosols are of great interest compared to traditional aerosolized liquid formulations in that they may offer improved stability, ease of administration, and simple device design. Particles 1–5 µm in size typically facilitate lung deposition. Nanoparticles may be exhaled as a result of their small size; however, they are desired to enhance the dissolution rate of poorly soluble drugs. Nanoparticles of the hypertension drug nifedipine were co-precipitated with stearic acid to form a colloid exhibiting negative surface charge. Nifedipine nanoparticle colloids were destabilized by using sodium chloride to disrupt the electrostatic repulsion between particles as a means to achieve the agglomerated nanoparticles of a controlled size. The aerodynamic performance of agglomerated nanoparticles was determined by cascade impaction. The powders were found to be well suited for pulmonary delivery. In addition, nanoparticle agglomerates revealed enhanced dissolution of the drug species suggesting the value of this formulation approach for poorly water soluble pulmonary medicines. Ultimately, nifedipine powders are envisioned as an approach to treat pulmonary hypertension.
Keywords: drug delivery, nanoparticles, nifedipine, dry powder aerosol
Introduction
Pulmonary formulation of dry powder aerosols represents a rapidly growing sector in the field of drug delivery (Edwards, Ben-Jebria et al. 1998). With characteristically fast onset of action, high bioavailability and relative ease of administration, pulmonary delivery of drugs presents potential advantages to many traditional dosage forms (Patton and Byron 2007). Nifedipine (NIF) is one such drug that bears complicated pharmacodynamics when administered in an oral dosage form. Nifedipine shows limited systemic bioavailability via the oral route due to a combination of enzymatic effects in the stomach and small intestine, primarily from P450 reductase and CYP3A-mediated drug metabolism (Zhang, Kaminsky et al. 2007). Though it is effective in easing symptoms of severe hypertension, it sometimes can be harmful due to aberrant dosing leading to elevated vasodilation and extreme hypotension (Wachter 1987). Nifedipine is particularly useful in treating pulmonary hypertension, but hypotensive side affects hinder the drug in this case (Ricciardi, Bossone et al. 1999). Given orally, the concentrations that are needed to achieve beneficial effects to the heart may cause unwanted side affects, including an increase in mortality rate for patients with coronary heart disease (Furberg, Psaty et al. 1995). For these reasons, current oral formulations of nifedipine bear a largely untapped therapeutic effect that could be harnessed if it were consistently administered at lower dosages. Pulmonary administration of nifedipine is one such strategy that might alleviate the aforementioned difficulties.
Porous microparticles have recently been investigated for their ability to avoid premature deposition due to inertial impaction (Dunbar, Scheuch et al. 2002). Aerodynamic diameter is a very influential parameter for controlling inertial impaction. A geometrically large particle with a small aerodynamic diametper essentially means that the particle moves as if it were a much smaller particle of unit density. An aerodynamically smaller particle carries with it a smaller amount of inertia and so this translates to a lower susceptibility to inertial impaction. The governing equation is shown below.
| (1) |
The variables ρ particle and ρ water are the densities of the particle material and water, respectively, dge is the geometric particle diameter, and γ is a shape factor (1 for a sphere and almost always increasing for irregular shapes) (DeCarlo, Slowik et al. 2004).
Nifedipine is a dihydropyridine and resides in a class of calcium antagonists known as calcium channel blockers (Figure 1). The site of action is at the calcium channels residing on the surface of all cells and it primarily acts upon smooth muscle cells and heart muscle cells. Nifedipine is a weak acid (pKa = 3.93) and is recognized for its photosensitivity and very low solubility in water (~10 µg/mL in water at 37 °C) (Friedrich, Nada et al. 2005). Most drugs in the class of dihydropyridines bear similar physical and chemical properties to nifedipine, such as hydrophobicity and pyridine backbone.
Figure 1.

Chemical structure of nifedipine.
Evidence has shown nifedipine to be effective in the treatment of vasospastic angina, hypertension, aortic regurgitation, and chronic angina but not unstable angina (Kloner 1995). This drug has shown a wide range of therapeutic effect, but often it is abandoned due to side effects such as pronounced hypotension, diarrhea, hepatotoxicity, mental confusion, and even death (Hedner 1986; Kloner 1995). It has also been shown to cause gastritis in the GI tract (Lavy 1999). These side effects, however, are primarily the result of excess drug in the dose as is required for current oral formulation. The common site of action for nifedipine is at the heart or the lungs, in the case of primary pulmonary hypertension. If nifedipine were able to be delivered via the pulmonary route then it may be possible to locally treat the diseased tissue while avoiding many of its most unwanted side affects.
In the present study, the design and characterization of a dry powder aerosol of nifedipine is reported. A pulmonary formulation is envisioned as treatment of hypertension, primary pulmonary hypertension and/or chronic acute angina pectoris. Novel formulations of nifedipine have been investigated due to its poor solubility and limited bioavailability (Sencar-Božic, Srcic et al. 1997; Kamiya, Yamada et al. 2007). Few formulations, however, have employed the pulmonary route for nifedipine administration. To this end, nanoparticle agglomerates were synthesized via the destabilization of a suspension of stable charged nanoparticles (NP). Stearic acid allowed for stabilization of the resulting colloid, and the charge provided by stearic acid facilitated destabilization with the addition of electrolytes. The resulting nanoparticle agglomerates demonstrated excellent aerosol properties and improved dissolution compared to micronized drug.
Materials and Methods
Materials
Nifedipine, stearic acid, and sodium chloride were purchased from Sigma Chemicals Co. USA and used as received in solid form. Ethanol 95% denatured, acetone, and phosphate buffered salts were purchased from Fisher Scientific and used as received. Spectra/Por cellulose dialysis membranes (MWCO = 6–8 kDa) were purchased from Fisher Scientific. DI water was used throughout the study as obtained from a Millipore EasyPure unit present on site.
Preparation of nifedipine nanoparticle suspensions
Since nifedipine can be degraded by light, special care was taken to protect the drug throughout formulation and analysis. Nanoparticles were prepared by the rapid mixing of ethanol with dissolved nifedipine and stearic acid into a larger aqueous volume, known as a solvent/anti-solvent precipitation technique. In a common experiment, 10 mg of nifedipine and 1 mg of stearic acid were completely dissolved in 1 mL of ethanol and allowed to stir overnight. This solution was added to 29 mL of cold deionized water via pipette injection under probe sonication (Fisher Sonic Dismembrator, model 500) at 60% amplitude for 20 seconds. The resulting colloid was then frozen at −20 °C and lyophilized, or stored in a 4 °C refrigerator until further processing into nanoparticle agglomerates. At this time, 3 mL was taken from the solution for sizing and imaging. All solution vials and reaction vessels were kept covered from any light sources, as nifedipine exhibits considerable photosensitivity (~10% in 24 hours) from UV and visible light spectra.(Grundy, Kherani et al. 1912)
Nanoparticle characterization
Nanoparticle size, polydispersity, and zeta potential were all measured in solution directly after synthesis by dynamic light scattering (Brookhaven, ZetaPALS). Zeta potential measurements were performed using 1 mM KCl solution. All measurements were performed in triplicate. Briefly, 1 mL of the solution was added to a standard cuvette and the remaining volume was filled with deionized water. Measurements were taken at 90 degrees to the incident light source while assuming a viscosity and refractive index of pure water. After arriving at a combined size, a second cuvette was filled with 1 mL to determine the zeta potential of the particles in solution using 0.1 M KCl as the running buffer.
Preparation of nanoparticle agglomerates
Nanoparticle colloids were destabilized via ionic force interactions to control the agglomeration of nanoparticles. Briefly, 30 mL of the nanoparticle suspension was taken from refrigeration and solid salt crystals were added to 0.1 M. Directly after addition, the suspensions were subject to vigorous mixing via homogenization at 20,000 RPM. Samples were left to sit at room temperature for ~4 hours, and then transferred to a −20 °C freezer before being lyophilized in a freeze dryer (Labconco, FreeZone 1). Some samples were allowed to settle for 24 hours and excess water was decanted prior to freeze drying. This procedure facilitated the elimination of most of the salt used as an agglomerating agent. Drying continued for 36 to 48 hours to remove residual water. Lyophilized powder was stored in glass vials at room temperature until further characterization. Colloid stability was tested under a range of salt molarities and agglomeration behaviors were observed under all conditions.
Agglomerate characterization
Agglomerated nanoparticles were studied in solution and as a dry powder. After the agglomeration event was complete, a small volume (~3 mL) of the solution was analyzed using a Beckman Coulter Multisizer III with a 100 µm aperture tube. Data were collected until the output graphs showed a stable shape and particle counts were above 10,000. After lyophilization, particle yield was determined using the following equation.
| (2) |
Mpowder is the mass of solids retained after lyophilization, and Minitial is the mass of solids introduced into the initial ethanol solution during nanoparticle fabrication plus the amount of salt added for agglomeration.
Dry powders of the nanoparticle agglomerates were analyzed by time-of-flight measurement using an Aerosizer LD (Amherst Instruments) equipped with a 700 µm aperture operating at 4 psi. For this step, 5 mg of the powder were added to the aerosizer and data were collected until the output graphs showed a stable shape and the particle counts were above 10,000. Measurements were taken under medium shear and no regularization.
A cascade impactor was then used to collect data on powder performance. Briefly, eight filters were weighed and set onto collection plates which were housed within eight airtight stages arranged serially and stacked on a level setting. Air was then pumped through the stages at a rate of 30 liters per minute via a vacuum pump and about 10 mg of sample were introduced at the top of the impactor device. The powders were allowed to deposit amongst the stages for 20 seconds, after which time the air flow was stopped. Filters were then removed from the stages and weighed. Cut-off particle aerodynamic diameters for each stage were provided by the manufacturer as follows: pre-separator – 10.00 µm, stage 0 – 9.00 µm, stage 1 – 5.8 µm, stage 2 – 4.7 µm, stage 3 – 3.3 µm, stage 4 – 2.1 µm, stage 5 – 1.1 µm, stage 6 – 0.7 µm, stage 7 – 0.4 µm and the final stage (stage 8) is intended to collect any remaining particulates. Mass of material deposited on each stage of the impactor was determined by measuring the mass by differences of each of the filters placed on the stages. These respective masses were used to calculate the respirable fraction emitted via the following equation:
| (3) |
Where %RF is the percent of respirable mass in the powder, F and cut-off designate the final and cut-off stage for the calculation, m is the mass on a given stage, and mtot is the sum of mass on all stages. The mass median aerodynamic diameter, MMAD, was obtained by a linear fit of a plot of the cumulative mass plotted as a function of the logarithm of the effective cut-off diameter, and recording the diameter at the midpoint of the curve fit.
Finally, the powders were characterized via a tap density test and a test for angle of repose. The tapped and untapped (bulk) densities were determined by demarcating a small cuvette with known volumes, and then inserting a small mass of powder into the cuvette (bulk density) and tapping it vertically against a padded bench top 50 times (tapped density). The mass was divided by the initial and final volumes. From these values the Hausner ratio (tapped density / bulk density) and Carr’s index (Ci) [(tapped density – bulk density) / tapped density X 100%] were also determined for each of the samples (Aulton 1988; Kumar, Kothari et al. 2001). The angle of repose for each powder was measured via the fixed cone height method. Briefly, a glass funnel with an internal stem diameter of 5 mm was placed 1 cm over a glass slide. Particles were allowed to flow gently through the funnel until a cone was formed which reached the funnel orifice. The angle of the cone to the horizontal was then recorded. This test was performed in triplicate for each sample.
Particle Imaging
Nanoparticles, microparticles and pure drug crystals were imaged via a scanning electron microscope. The samples were deposited onto mica slides in solution (or as received for the crystals) and allowed to evaporate overnight. These samples were then coated with gold palladium under an argon atmosphere using a gold sputter module in a high-vacuum evaporator. Samples were then observed for their surface morphology using a LEO 1550 field-emission scanning electron microscope.
Characterization of Particle Morphology
Dry nanoparticles, microparticles, and stock nifedipine were analyzed using a TA Q1000 differential scanning calorimeter. Samples were weighed out (5 mg) and were deposited into aluminum pans. Pans were sealed and inserted into the device for data collection. A standard empty pan was inserted along with each pan to account for the heating of pure aluminum. Data was collected using a temperature gradient test from 50 to 200 °C at a rate of 10 °C/min under nitrogen. Melting and transition point measurements were performed using the software provided with the device.
All 13C spectra were collected using a Chemagnetics CMX-300 spectrometer using ramped amplitude cross-polarization (RAMP) (Metz, Wu et al. 1994), magic-angle spinning (MAS) (Stejskal, Schaefer et al. 1977), sideband suppression, and SPINAL-64 decoupling (Fung, Khitrin et al. 2000). Samples were packed in 7 mm zirconia rotors using Teflon® end caps, and spun at 4 kHz in a 7 mm spin module from Revolution NMR. All spectra are the sum of 1600–3600 transients collected using a 20–45 s pulse delay, a contact time of 2–7 ms, and a 1H 90° pulse width of 3.1 µs. The free induction decays consisted of 2048–3072 points with a dwell time of 33.3 µs. The spectra were externally referenced to tetramethylsilane using the methyl peak of 3-methylglutaric acid at 18.84ppm (Barich, Gorman et al. 2006).
Dissolution Studies
Dissolution of the nanoparticle agglomerates, nanoparticles, and pure drug was quantified using a Shimadzu SPD-10A UV-Vis detector set for wavelength detection at 240 nm. The HPLC system consisted of a SCL-10A system controller, LC-10AT LC pump, SIL-10A auto injector with a sample controller, and CLASS VP analysis software. 45:55 (water:methanol) mixture buffered to pH = 4.5 was used as mobile phase. Flowrates in the column were adjusted to 2 mL/hr and all injections were taken at 50 µL. All studies were performed via a dialysis method in triplicate and sink conditions were maintained at a 30:1 volume ratio. Solutions were allowed to stir at 200 RPM at room temperature. The equivalent of 4 mg was introduced into dialysis bags with a molecular weight cut off of 6–8 kDa.
Results and Discussion
Stearic acid was used in the formulation of nanoparticles in this study. Stearic acid is found in the surfactant layer that rests above the lung epithelium in small amounts, is solid at room temperature, amphiphilic, and has also exhibited a small penetration enhancing effect for specific drug types (Ilett, Stripp et al. 1974; Rosa and Catalá 1998). Solidity at room temperature is particularly important to ensure solid morphology of the final powders. Also, the amphiphilic nature ensures that the molecule may act as an interface between the nifedipine nanoparticles and water phase. Presumably, stearic acid led to the negative surface charge on the nanoparticles, which increased their stability in water (Table 1). Nifedipine is a characteristically non polar molecule, so any accumulation of charge on the surface of the nanoparticles may be attributed to the stearic acid. In designing the formulation, it was of great importance to control the surface charge of the nanoparticles (Table 1). Charged particles are able to interact across long distances via electrostatic forces (Mendez-Alcaraz, D'Aguanno et al. 1992) and the surface charge may be disrupted as a means to induce nanoparticle assembly.
Table 1.
Particle properties of nifedipine nanoparticles and nanoparticle agglomerates.
| Particle property | Value |
|---|---|
| Effective Diameter (nm) | 470 ± 40 |
| Polydispersity | 0.34 ± 0.1 |
| Zeta Potential (mV) | (24) ± 6 |
| NP Yield (%) | 75 ± 5 |
| Mean Agglomerate Dia. (um) | 11 ± 6 |
| Agglomerate Yield (%) | 91 ± 4 |
It was observed that a main design constraint, nanoparticle size, could not be easily controlled by manipulating operating conditions during the formation of the colloid (data not shown). The rate of particle precipitation was strongly dependent on the relative solubilities of the drug in both phases (water and ethanol), and this effect was observed to dominate other potential factors in particle formation such as mixing energy and mixing time. As long as there was sufficient mixing of these two solvents, which was achieved via ultrasonication at low to moderate amplitudes, the nucleation and growth kinetics led to submicron particle sizes. However, if solutions containing a high concentration of nifedipine were injected, particle size tended to increase and colloidal stability was difficult to maintain.
The yield of the mass recovered for processed nanoparticles and nanoparticle agglomerates was studied (Table 1). The yield of nanoparticles recovered as dry powders were considerably lower than nanoparticle agglomerate yields (~12% lower). This was mainly due to the tendency for nanoparticles to adhere to the surfaces of the collection vessels. Nanoparticles were also more difficult then their agglomerates to transfer to vials after lyophilization, and this may have also contributed to low yields. The presence of small amounts of residual sodium chloride were not considered since yield calculations were based on relative mass of drug recovered.
Basic powder properties for stock nifedipine, nanoparticles and nanoparticle agglomerates were also studied. Flowability and density characterization helped elucidate the bulk powder property differences between samples (Table 2). Interesting points were observed, such as the large angle of repose for the nanoparticles, the decrease in density of the unprocessed drug with respect to the nanoparticles and of the nanoparticles with respect to the nanoparticle agglomerates, and the increasing Carr’s index as a result of the processing steps. A large angle of repose for the nanoparticles was probably the result of strong adhesion forces between nanoparticles and between nanoparticles and larger agglomerates in the bulk mixture.
Table 2.
Flowability parameters stock nifedipine as received, nifedipine/stearic acid nanoparticles and the corresponding nanoparticle agglomerates.
| Sample | Stock Nifedipine | Nif/SA NP | Nif/SA Agglomerates |
|---|---|---|---|
| Bulk Density (g/cm^3) | 0.9 ± 0.2 | 0.10 ± 0.01 | 0.07 ± 0.02 |
| Tapped Density (g/cm^3) | 1.0 ± 0.3 | 0.12± 0.01 | 0.09 ± 0.01 |
| Carr's Index | 10 ± 0.8 | 17 ± 1.0 | 25 ± 2 |
| Hausner Ratio | 1.1 ± 0.01 | 1.2 ± 0.2 | 1.3 ± 0.3 |
| Angle of Repose (deg) | 50 ± 1 | 77 ± 2 | 58 ± 4 |
When testing powder density, nifedipine nanoparticles and agglomerates showed some ability to pack as illustrated by the small difference between bulk and tapped densities. Flowability indices may be calculated from these density differences and the angle of repose. Carr’s flowability index provides a general indication of interparticulate forces (Louey, Van Oort et al. 2004). As the index increases, the differences between bulk and tapped densities increase. This equates to a greater degree of interparticulate forces in the sample and generally poor flowability. The data showed that the nanoparticle agglomerates yielded the highest Carr’s index; however, these indices are not an absolute measure of the performance of a powder. Indeed, good flowability does not equate directly to enhanced aerosolization. The results indicated poor flowability for agglomerates, but further data revealed that the agglomerates were able to sufficiently aerosolize. Hausner ratios were not significantly different.
The decreasing densities were congruent with the particle structures observed in SEM micrographs (Figure 2). The unprocessed drug was composed of large faceted solids resembling crystals with geometries on the order of 100 µm, which presumably led to the high bulk density observed. The agglomerate images indicated a semi-porous structure and this probably led to the lower densities for the processed particles. Also, large arrays of agglomerates were shown to be consistently less than 10 µm (Figure 2b). The similar agglomerate sized indicated a well controlled agglomeration.
Figure 2.

SEM images for (A) nanoparticles, (B) nanoparticle agglomerates with 1:1 salt addition, (C) close up of a single agglomerate, and (D) pure nifedipine as received. Scale bars are 1, 10, 10, and 100 µm, A–D.
To begin characterization of the final powders, particle samples were tested on an Aerosizer LD and a Coulter Multisizer 3 to measure their aerodynamic and geometric diameters, respectively (Figure 3). The multisizer data were collected in solution, and were important to quantify the agglomeration event since it is well known that particles can uncontrollably agglomerate upon lyophilization. The samples revealed a fairly monodisperse distribution of sizes between about 5 to 15 µm, with an average diameter of about 10 µm. More so, the data revealed very stable microstructure in the nanoparticle agglomerates. Their distributions were barely altered after intense homogenization, and the curves maintained their overall shape (data not shown). Aerosizer data revealed a narrower size distribution and a lower mean diameter.
Figure 3.

Aerodynamic and geometric diameter size distributions for nanoparticle agglomerates.
The relationship between aerodynamic diameter and geometric diameter may be recalled from equation (1). The variables are arranged so that if the particle density is lower than that for water, then the aerodynamic diameter will be some fraction of the geometric diameter. Also, irregularly shaped particles yield a shape factor greater than one which will lead to the aerodynamic diameter being some fraction of the geometric diameter. In the case of nifedipine nanoparticle agglomerate samples, the geometric diameters were shown to be much larger than the aerodynamic diameters. For a typical sample, the average geometric diameter was about five times larger than the average aerodynamic diameter (Figure 3). Comparing these graphs offered further confirmed that the particles were porous. The difference between particle distributions for the aerodynamic and geometric measurements suggested that the particles had excellent aerodynamic properties.
SEM micrographs also revealed the morphology of nanoparticles, nanoparticle agglomerates and pure drug (Figure 2). Images helped validate that nanoparticle agglomeration led to microparticle formation, since the images clearly indicated assemblages of nanoparticles. Studies in other disciplines have shown that colloidal particles will agglomerate due to van der Waals forces, and that electrostatic forces are essential to avoiding this agglomeration (Parkville 1990). These studies provide an ample background for gaining insight into colloidal destabilization. The colloids studied here were agglomerated by charge neutralization or “salting out” by employing sodium chloride. Stearic acid/nifedipine nanoparticles exhibited only a weakly negative surface charge to stabilize the nanoparticles. The colloid destabilization mechanism has also been shown to benefit from anion presence (Parkville 1990).
The nanoparticle SEM images showed a somewhat elliptical morphology with an average diameter somewhere below one micron (Figure 2a), but not as small as 100 nm, which was consistent with DLS data. The nanoparticle agglomerate images revealed a highly textured morphology, with many small and similarly shaped protrusions from the surface. These features were indicative of the mechanism behind particle formation, as they were probably the result of nanoparticles grouped together during the agglomeration step. Also, we can see a somewhat porous assembly (Figure 2c). In comparison, the stock drug was shown to bear a highly faceted structure, and particles resembling crystals larger than 100 µm were observed. This faceted morphology was not observed in any of the other images, thus suggesting a possible change in overall crystallinity.
DSC thermographs were used to investigate the effects of processing on drug morphology, and to verify the overall content in each of the formulations. Both stearic acid and nifedipine exhibited sharp endothermic peaks where they underwent a melting phenomenon upon heating (Figure 4). Endothermic peaks at the nifedipine and stearic acid location appear in all the graphs. Firstly, it can be seen that the area decreased for all processed samples, which could possibly result from the increased surface area and corresponding increase in surface imperfections of smaller particulates. Overall peak areas were calculated using a peak integration method (Table 3). Processed samples all showed lower peak areas on a per mass basis compared to the stock materials. The data showed peak locations close to the original locations in the stock material, thus, verifying sample compositions.
Figure 4.

Differential scanning calorimetry thermograms for stearic acid, nifedipine, pure nifedipine nanoparticles, nifedipine/stearic acid nanoparticles, and nanoparticle agglomerates that contain nifedipine, stearic acid, and NaCl.
Table 3.
DSC peak integrations for stock nifedipine, stock stearic acid, nifedipine nanoparticles, nifedipine/stearic acid nanoparticles and corresponding agglomerates.
| Sample | Peak location (°C) | Peak area (J/g) |
|---|---|---|
| Nifedipine | 174 | 121 |
| Stearic acid | 76 | 245 |
| NIF nanoparticles | 150 | 30 |
| 156 | 28.8 | |
| NIF/SA nanoparticles | 67 | 24.2 |
| 152 | 32 | |
| 160 | 38.8 | |
| NIF/SA agglomerates | 67 | 9.1 |
| 163 | 36.3 | |
The 13C spectra of nifedipine as received and as nanoparticles was acquired to further study drug morphology (Figure 5). Both the as received nifedipine and the nanoparticles exhibited relatively narrow lines (several tens of hertz), indicating that these samples were crystalline. Harris and coworkers have previously studied the crystalline and amorphous forms of nifedipine, including the assignment of the 13C MAS NMR spectrum of crystalline nifedipine (Apperley, Forster et al. 2005). The spectra of nifedipine were identical to that of form 1 in the Harris paper.
Figure 5.

13C CP/MAS spectra of as-received nifedipine (bottom) and nanoparticle nifedipine (top). Stars in the nanoparticle nifedipine indicate those peaks due to stearic acid.
The spectra of the as-received nifedipine and the nifedipine nanoparticles were practically identical, indicating that the crystalline form of nifedipine did not change upon nano-sizing. The only difference in the appearance of the spectra was that in the nanoparticle spectrum there was a slight broadening of the nifedipine lines (~2 Hz) and the presence of stearic acid. Line broadening can be caused by smaller particle size (Barich, Davis et al. 2006), and the broadening was consistent with nanoparticles being smaller in size compared to the as-received material. Although the nanoparticle crystallite size was much smaller than the as-received crystallite size, the nanoparticles were primarily single crystals, whereas the as-received crystallites were agglomerated. This helps to explain the reason the nanoparticle line widths were close to that of the as-received material, despite the fact that the average particle size was more than two orders of magnitude smaller than the as-received material. The 1H T1 NMR relaxation times were also measured. The as-received material had a 1H T1 of 37 s, while the nanoparticle formulation had a 1H T1 of 16 s. This was also consistent with the smaller size of the nifedipine nanoparticle (Lubach, Xu et al. 2007).
Dissolution studies were conducted to measure the rate of nifedipine dissolution from the various forms of processed drug (Figure 6). Drug was mostly dissolved from nanoparticle and nanoparticle agglomerate samples within 10 hours. In the case of stock nifedipine, the kinetics were significantly slower and less total drug was dissolved throughout the duration of the experiment. The nanoparticles liberated the most drug content in the allotted time. This is to be expected as their smaller size allows for a greater surface area and faster dissolution to take place. The nanoparticle agglomerates dissolved faster than the stock drug by a considerable margin, but not as quickly as the nanoparticle suspension. The comparative dissolution rates indicated that dissolution rate increased for decreasing particle sizes. This behavior may also allude to improved dissolution characteristics of the agglomerates in the deep lung, though it should be noted that the aqueous solutions used in the dissolution study may not sufficiently represent the environment within the lungs.
Figure 6.
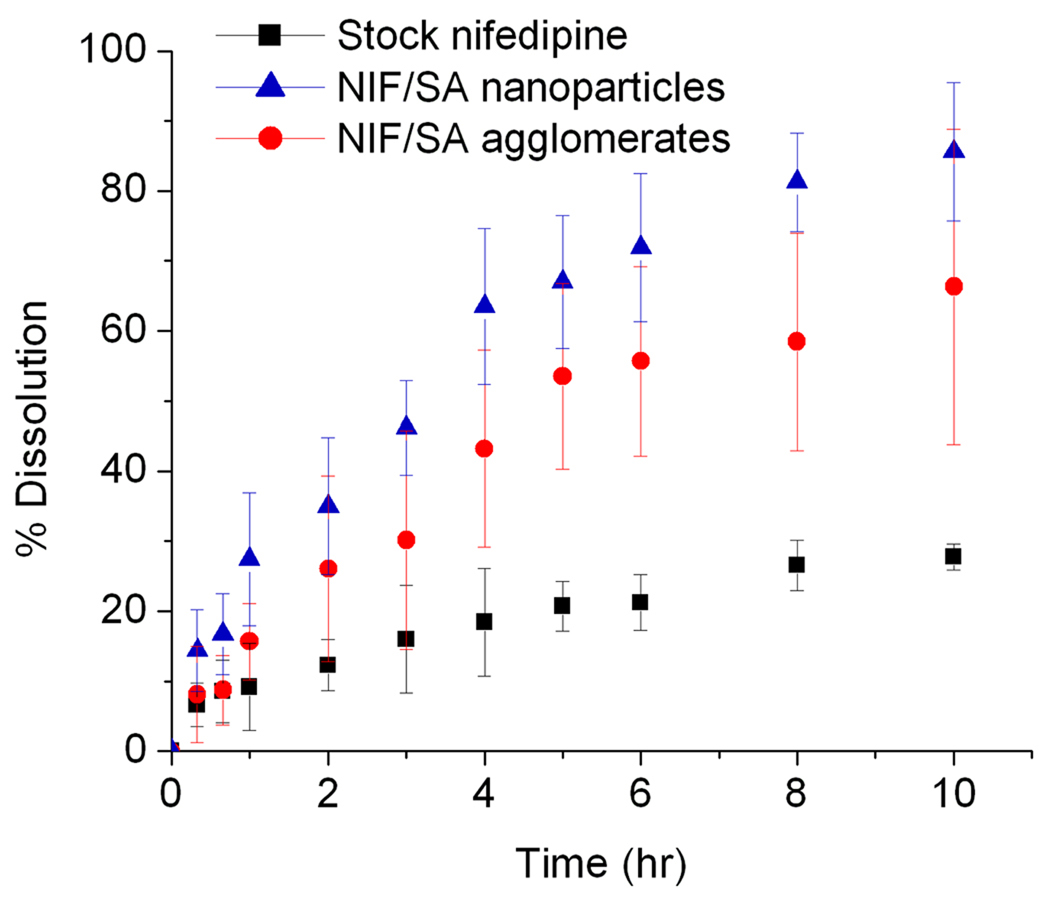
Percent drug dissolution versus time for the nifedipine nanoparticles, nanoparticle agglomerates, and stock nifedipine as received.
Particle size was shown to affect the overall rate of particle dissolution. Dissolution data was fit for first order kinetics, using a generalized first order rate equation shown below.
| (3) |
Where C is the concentration of undissolved drug, k is a rate constant and t is time. The equation can be solved for the single boundary condition where no drug is present in solution at t = 0 to yield an exponential function. This function was fit against all dissolution data to get rate constants for each sample. The data revealed that dissolution rate was inversely proportional to particle size (Figure 7). The rate was linear to the log of particle size, which was expected since the increasing size has an exponential effect on the available surface area for particle dissolution. The results confirm that stearic acid was not significantly affecting the release of nifedipine, but drug loss from the particles was driven by dissolution and diffusion.
Figure 7.

First order rate constants versus the logarithm of particle diameter for stock nifedipine, nanoparticles, and agglomerates.
Nifedipine is photosensitive, and has also shown to degrade spontaneously in solution (el Walily 1997; Kawabe, Nakamura et al. 2008). Although careful precautions were taken during sample preparation and dissolution studies, degradation of the drug was still observed. Alternate peaks aside from the characteristic peak of native nifedipine were observed and identified as the byproducts of nifedipine degradation. These peaks increased in area as the studies reached their final time points (data not shown); however, aberrant peaks only represented a small fraction of the dissolved drug at any given time point (~1–5%). Degradation products were included in computing the overall concentration of drug in solution; however, these byproducts never exceeded ~10% of the total dissolved sample. This was done to ensure that all dissolved drug was accounted for, and that kinetic data was minimally skewed due to species degradation throughout the experiment.
Finally, cascade impaction studies were performed to formalize powder characterization for pharmacological formulation characterization. The cascade impactor is a well known instrument initially designed in the 1950’s for simulating aerosol performance in the human lung. The stages are set up so that each of them (0–8) represents deeper penetration into the lung. Particles of smaller sizes are not able to maintain their trajectories as the flowrate increases between stages. As a result, they impact upon the filter set on top of the next stage. Data are summarized in Figure 8 and Table 4.
Figure 8.

Cascade impactor mass distributions for nifedipine nanoparticles, nanoparticle agglomerates, and drug as received. Data is represented as a percentage of mass deposited on each stage number within the cascade impactor.
Table 4.
Cascade impaction results of stock nifedipine as received, nifedipine/stearic acid nanoparticles and the corresponding nanoparticle agglomerates. EF% is the emitted fraction percent, RF% is the respirable fraction percent, and MMAD is the mass median aerodynamic diameter.
| Cascade impaction data | Formulatio ns | |||
|---|---|---|---|---|
| Pure | NP | Floc | ||
| EF% | 85 ± 12 | 93 ± 6 | 91 ± 4 | |
| RF% | 5.7 < | 48 ± 4.1 | 84 ± 0.1 | 94 ± 1 |
| 3.3 < | 2.5 ± 1.5 | 84 ± 0.7 | 84 ± 4 | |
| MMAD | 4.8 ± 0.6 | 1.8 ± 0.2 | 1.4 ± 0.1 | |
The mass separation onto different stages revealed different behaviors for each of the dry powders. The pure drug mostly deposited in the earlier stages, 1–3. These stages represent the pharynx and primary bronchi and so it may be assumed that these powders would minimally penetrate the lungs. The dried nanoparticles showed the bulk of their deposition between stages 5–7 and these stages represent the terminal bronchiolar and alveolar regions. A significant sub-population of the nanoparticle sample deposited in stages 1–3, suggesting the presence of large nanoparticle agglomerates resulting from the drying process. The nanoparticle agglomerates showed similar deposition patterns, but deposited more strongly at the terminal bronchioles. Studies have indicated that this may be an effective region for local or systemic drug delivery (Katz, Adatia et al. 2006).
From the data, it appeared that both the nanoparticle samples and their corresponding nanoparticle agglomerates were able to deposit efficiently to the lungs. The primary reason for this similarity, given different processing steps, was that the stearic acid-modified nanoparticles uncontrollably agglomerated upon lyophilization and hence revealed similar deposition behaviors. Also, the nanoparticles appeared to be depositing in the deepest regions of the impactor, but these particles may be quickly exhaled in a clinical setting, since deposition in the alveolus often requires breath holding to achieve deposition (Byron 1986). The agglomerated particles may bear further advantages to the nanoparticle formulation simply because of the ability to harvest them directly from solution. Via a combination of particle separation and drying, nanoparticle agglomerates may be purified as a dry powder at a fraction of the cost of nanoparticles via lyophilization. Finally, the cascade impaction data (Table 4) showed the nanoparticle agglomerates outperforming both the pure drug and the nanoparticle powders in all fields except for fraction emitted, where differences were not statistically significant. The nanoparticle agglomerates showed an exceptional respirable fraction above 5.7 µm at 94.5% while the nanoparticles only presented 84.4% at or below this cutoff diameter. Nanoparticle agglomerates showed a smaller mass median aerodynamic diameter, which, again, likely results from the controlled agglomeration of the nanoparticles.
Conclusions
Stearic acid-stabilized nanoparticles of nifedipine were synthesized via solvent precipitation in an aqueous solution. These colloids were destabilized using salt to induce particle agglomeration in a controlled fashion. Nanoparticles and nanoparticle agglomerates revealed enhanced dissolution kinetics when compared to the stock drug. The nanoparticle agglomerate dry powders exhibited aerosol characteristics and size distributions well suited for pulmonary drug delivery. This research suggests that agglomerated nanoparticles of nifedipine may serve as a unique drug delivery approach for treating pulmonary hypertension or more acute diseases such as angina pectoris.
Acknowledgements
The authors would like to acknowledge support for this work from the Cystic Fibrosis Foundation, the Coulter Foundation, and the Higuchi Biosciences Center. Lab support from the American Heart Association, the NIH (R03 AR054035, P20 RR016443 and T32 GM08359-11), the NSF (CHE 0719464), and the Department of Defense is also appreciated. Prof. C. Russ Middaugh and The Microscopy Lab are acknowledged for providing necessary equipment and expertise.
Footnotes
Publisher's Disclaimer: This is a PDF file of an unedited manuscript that has been accepted for publication. As a service to our customers we are providing this early version of the manuscript. The manuscript will undergo copyediting, typesetting, and review of the resulting proof before it is published in its final citable form. Please note that during the production process errors may be discovered which could affect the content, and all legal disclaimers that apply to the journal pertain.
References
- Apperley DC, Forster AH, et al. Characterization of indomethacin and nifedipine using variable-temperature solid-state NMR. Magnetic Resonance in Chemistry. 2005;43(11):881–892. doi: 10.1002/mrc.1643. [DOI] [PubMed] [Google Scholar]
- Aulton ME. Pharmaceutics: the science of dosage form design. New York: Churchill Livingstone, Edinburgh; 1988. [Google Scholar]
- Barich DH, Davis JM, et al. Investigation of solid-state NMR line widths of ibuprofen in drug formulations. Journal of Pharmaceutical Sciences. 2006;95(7):1586–1594. doi: 10.1002/jps.20564. [DOI] [PubMed] [Google Scholar]
- Barich DH, Gorman EM, et al. 3-Methylglutaric acid as a 13C solid-state NMR standard. Solid State Nuclear Magnetic Resonance. 2006;30(3–4):125–129. doi: 10.1016/j.ssnmr.2006.06.001. [DOI] [PubMed] [Google Scholar]
- Byron PR. Prediction of Drug Residence Times in Regions of the Human Respiratory Tract Following Aerosol Inhalation. Sciences. 1986;75(5) doi: 10.1002/jps.2600750502. [DOI] [PubMed] [Google Scholar]
- DeCarlo P, Slowik JG, et al. Particle Morphology and Density Characterization by Combined Mobility and Aerodynamic Diameter Measurements. Part 1: Theory. Aerosol Science and Technology. 2004;38(12):1185–1205. [Google Scholar]
- Dunbar C, Scheuch G, et al. In vitro and in vivo dose delivery characteristics of large porous particles for inhalation. International Journal of Pharmaceutics. 2002;245(1–2):179–189. doi: 10.1016/s0378-5173(02)00349-6. [DOI] [PubMed] [Google Scholar]
- Edwards DA, Ben-Jebria A, et al. Recent advances in pulmonary drug delivery using large, porous inhaled particles. Am Physiological Soc. 1998;85:379–385. doi: 10.1152/jappl.1998.85.2.379. [DOI] [PubMed] [Google Scholar]
- el Walily AF. Simultaneous determination of the binary mixture of nifedipine and mefruside using derivate spectroscopy, capillary gas-liquid chromatography and high performance liquid chromatography. Acta Pharm Hung. 1997;67(2–3):89–97. [PubMed] [Google Scholar]
- Friedrich H, Nada A, et al. Solid State and Dissolution Rate Characterization of Co-Ground Mixtures of Nifedipine and Hydrophilic Carriers. Drug Development and Industrial Pharmacy. 2005;31(8):719–728. doi: 10.1080/03639040500216097. [DOI] [PubMed] [Google Scholar]
- Fung BM, Khitrin AK, et al. An improved broadband decoupling sequence for liquid crystals and solids. Journal of Magnetic Resonance. 2000;142(1):97–101. doi: 10.1006/jmre.1999.1896. [DOI] [PubMed] [Google Scholar]
- Furberg CD, Psaty BM, et al. Nifedipine Dose-Related Increase in Mortality in Patients With Coronary Heart Disease. Circulation. 1995;92(5):1326–1331. doi: 10.1161/01.cir.92.5.1326. [DOI] [PubMed] [Google Scholar]
- Grundy JS, Kherani R, et al. Photostability determination of commercially available nifedipine oral dosage formulations. J Pharm Biomed Anal. 1912;1994:1529–1535. doi: 10.1016/0731-7085(94)00100-6. [DOI] [PubMed] [Google Scholar]
- Hedner T. Calcium channel blockers: spectrum of side effects and drug interactions. Acta Pharmacol Toxicol (Copenh) 1986;58(2):119–130. doi: 10.1111/j.1600-0773.1986.tb02527.x. [DOI] [PubMed] [Google Scholar]
- Ilett KF, Stripp B, et al. Studies on the mechanism of the lung toxicity of paraquat: Comparison of tissue distribution and some biochemical parameters in rats and rabbits. Toxicology and Applied Pharmacology. 1974;28(2):216–226. doi: 10.1016/0041-008x(74)90007-6. [DOI] [PubMed] [Google Scholar]
- Kamiya S, Yamada M, et al. Preparation and stabilization of nifedipine lipid nanoparticles. International Journal of Pharmaceutics. 2007 doi: 10.1016/j.ijpharm.2007.10.049. [DOI] [PubMed] [Google Scholar]
- Katz SL, Adatia I, et al. Nebulized therapies for childhood pulmonary hypertension: An in vitro model. Pediatr Pulmonol. 2006;41(7):666–673. doi: 10.1002/ppul.20431. [DOI] [PubMed] [Google Scholar]
- Kawabe Y, Nakamura H, et al. Photochemical stabilities of some dihydropyridine calcium-channel blockers in powdered pharmaceutical tablets. Journal of Pharmaceutical and Biomedical Analysis. 2008 doi: 10.1016/j.jpba.2008.01.042. [DOI] [PubMed] [Google Scholar]
- Kloner RA. Nifedipine in Ischemic Heart Disease. Circulation. 1995;92(5):1074–1078. doi: 10.1161/01.cir.92.5.1074. [DOI] [PubMed] [Google Scholar]
- Kumar V, Kothari SH, et al. Compression, compaction, and disintegration properties of low crystallinity celluloses produced using different agitation rates during their regeneration from phosphoric acid solutions. AAPS PharmSciTech. 2001;2(2):7. doi: 10.1208/pt020207. [DOI] [PubMed] [Google Scholar]
- Lavy A. Corrosive Effect of Nifedipine in the Upper Gastrointestinal Tract. Diagnostic and Therapeutic Endoscopy. 1999;6(1):39–41. doi: 10.1155/DTE.6.39. [DOI] [PMC free article] [PubMed] [Google Scholar]
- Louey MD, Van Oort M, et al. Aerosol Dispersion of Respirable Particles in Narrow Size Distributions Using Drug-Alone and Lactose-Blend Formulations. Pharmaceutical Research. 2004;21(7):1207–1213. doi: 10.1023/b:pham.0000032991.74736.3e. [DOI] [PubMed] [Google Scholar]
- Lubach JW, Xu D, et al. Investigation of the effects of pharmaceutical processing upon solid-state NMR relaxation times and implications to solid-state formulation stability. Journal of Pharmaceutical Sciences. 2007;96(4):777–787. doi: 10.1002/jps.20684. [DOI] [PubMed] [Google Scholar]
- Mendez-Alcaraz JM, D'Aguanno B, et al. Structure of binary colloidal mixtures of charged and uncharged spherical particles. Langmuir. 1992;8(12):2913–2920. [Google Scholar]
- Metz G, Wu X, et al. Ramped-amplitude cross polarization in magic-angle-spinning NMR. Journal of Magnetic Resonance, Series A. 1994;110(2):219–227. [Google Scholar]
- Parkville V. Peter R. Hutchison1 and Thomas W. Healy2 Chemicals Division Tioxide Australia Pty. Ltd. Burnie, Tasmania Department of Physical Chemistry. Surface and Colloid Chemistry in Natural Waters and Water Treatment. 1990 [Google Scholar]
- Patton JS, Byron PR. Inhaling medicines: delivering drugs to the body through the lungs. Nat Rev Drug Discov. 2007;6(1):67–74. doi: 10.1038/nrd2153. [DOI] [PubMed] [Google Scholar]
- Ricciardi MJ, Bossone E, et al. Echocardiographic Predictors of an Adverse Response to a Nifedipine Trial in Primary Pulmonary Hypertension* Diminished Left Ventricular Size and Leftward Ventricular Septal Bowing. Am Coll Chest Phys. 1999;116:1218–1223. doi: 10.1378/chest.116.5.1218. [DOI] [PubMed] [Google Scholar]
- Rosa D, Catalá A. Fatty Acid Profiles and Non Enzymatic Lipid Peroxidation of Microsomes and Mitochondria from Bovine Liver, Kidney, Lung and Heart. Archives Of Physiology And Biochemistry. 1998;106(1):33–37. doi: 10.1076/apab.106.1.33.4398. [DOI] [PubMed] [Google Scholar]
- Sencar-Božic P, Srcic S, et al. Improvement of nifedipine dissolution characteristics using supercritical CO2. International Journal of Pharmaceutics. 1997;148(2):123–130. [Google Scholar]
- Stejskal EO, Schaefer J, et al. Magic-angle spinning and polarization transfer in proton-enhanced NMR. Journal of Magnetic Resonance. 1977;28(1):105–112. [Google Scholar]
- Wachter RM. Symptomatic hypotension induced by nifedipine in the acute treatment of severe hypertension. Archives of Internal Medicine. 1987;147(3):556–558. [PubMed] [Google Scholar]
- Zhang QY, Kaminsky LS, et al. Role of Small Intestinal Cytochromes P450 in the Bioavailability of Oral Nifedipine. Drug Metabolism and Disposition. 2007;35(9):1617–1623. doi: 10.1124/dmd.107.016543. [DOI] [PubMed] [Google Scholar]