

Abstract.
Genomic profiling was performed on explants of late proliferative phase human endometrium after 24-h treatment with progesterone (P) or oestradiol and progesterone (17β-E2+P) and on explants of menstrual phase endometrium treated with 17β-E2+P. Gene expression was validated with real-time PCR in the samples used for the arrays, in endometrium collected from early and mid-secretory phase endometrium, and in additional experiments performed on new samples collected in the menstrual and late proliferative phase. The results show that late proliferative phase human endometrium is more responsive to progestins than menstrual phase endometrium, that the expression of several genes associated with embryo implantation (i.e. thrombomodulin, monoamine oxidase A, SPARC-like 1) can be induced by P in vitro, and that genes that are fully dependent on the continuous presence of 17β-E2 during P exposure can be distinguished from those that are P-dependent to a lesser extent. Therefore, 17β-E2 selectively primes implantation-related genes for the effects of P.
Keywords. human endometrium, explant cultures, global gene expression, oestradiol, progesterone
Introduction
Optimal development of the endometrium is an essential prerequisite for successful blastocyst implantation. Progesterone (P) is essential for secretory differentiation of endometrium, and the need for oestrogen in cooperation with P in regulating the implantation process is species-specific [1]. Our current knowledge of the cellular and molecular events orchestrating endometrial growth and differentiation prior to implantation is limited.
In the natural cycle, the human endometrium is receptive during a short period, approximately 19 to 24 days after the onset of menstruation [2–6]. Prior to and during this period, the endometrium undergoes extensive morphological and physiological changes to facilitate implantation of the embryo [2, 6, 7]. These changes are tightly controlled by oestrogen and P [6, 8, 9]. The responsiveness of the endometrium to P is partly dependent upon the pre-ovulatory changes that have occurred under the influence of oestrogen. This is illustrated by the fact that high oestrogen levels and/or prolonged oestrogen exposure accelerates endometrial maturation, thus disturbing the synchrony of embryo and endometrial development and subsequent implantation [10, 11]. Currently, there is no clear definition and understanding of human endometrial maturation and only limited knowledge about the cellular mechanisms involved. We define mature endometrial tissue as the physiological state of the human endometrium that allows a correct response to the luteal P, resulting in implantation of the embryo and maintenance of pregnancy.
Our limited understanding of the processes underlying endometrial maturation and P-controlled differentiation prior to and during implantation is largely due to the lack of relevant model systems to evaluate endometrial responses under physiologically relevant conditions. Previous work has demonstrated that explant culture of human endometrial tissue is a suitable model to study the response to oestrogen and P, most likely due to the preservation of the tissue context [12–14]. Using this model we showed previously that the responsiveness of the endometrium to oestrogen changes throughout the proliferative phase with regard to the regulation of gene expression and proliferation [12].
The present study was designed to gain more insight into the responses of human endometrium to P with regard to gene expression and into the influence of 17β-oestradiol (17β-E2) on this process. To this end, global gene expression analysis was performed on human endometrial tissue fragments collected from the menstrual and late proliferative phases after short-term culture in the presence of P and 17β-E2.
Materials and methods
Human endometrial tissue. Endometrial tissue was collected from 26 women (20–45 years of age) with regular menstrual cycles who underwent surgery for benign indications. The tissue was collected from hysterectomy specimens for benign indications or by pipelle biopsies during laparoscopy for sterilisation (Pipelle catheter, Unimar Inc., Prodimed, Neuilly-Enthelle, France). It was documented that the women were not on any kind of steroid medication. All women who agreed to participate in the study signed an informed consent form according to a protocol approved by the Medical Ethical Committee of the Academic Hospital Maastricht. Tissue was transported to the laboratory in DMEM/Ham’s F12 medium on ice. A portion of each sample was fixed in 10% buffered formalin for evaluation by histology. The endometrium was dated according to clinical information with respect to the start of the last menstrual period, which was reconfirmed by histological examination of the tissue [15]. Of the 26 biopsy specimens, 11 were collected in the proliferative phase [menstrual phase, cycle day (CD)1–5, n=6; late proliferative phase, CD11–14, n=5], and 15 were collected in the secretory phase [early secretory (ES), CD15–18, n=7; mid-secretory (MS), CD19–24, n=8]. Of the 11 biopsy specimens collected from the proliferative phase, 4 were used for microarray studies, and 7 were used for validation purposes with real-time PCR analysis. The biopsy specimens collected from the secretory phase were used for validation only.
Explant cultures. Human endometrium explant cultures were prepared from menstrual phase and late proliferative phase endometrium as described by Punyadeera et al. [16]. In brief, human endometrial tissue was cut into 2–3 mm3 pieces. A total of 24 explants were placed in Millicell-CM culture inserts (0.4 µm pore size, 30 mm diameter; Millipore, France) in 6-well plates containing 1.2 ml phenol red-free DMEM/Ham’s F12 medium (Life Technologies, Grand Island, NY), supplemented with L-glutamine (1%), penicillin and streptomycin (1%, P/S). Cultures were performed for 24 h. Previous experiments have shown that collagenase activity remains very low in proliferative endometrial tissue during the first 24 h of culture [17] and that the tissue viability is not affected after 24 h of culture [13].
The explants prepared from late proliferative phase endometrium were cultured in the presence of vehicle (0.1% ethanol), 17β-E2 and P (1 nM each), or P alone (1 nM). The 17β-E2 was included to maintain the in vivo oestrogen support. In order to make inferences with regard to the responsiveness of the endometrium before and after prolonged in vivo oestrogen exposure, we also treated explant cultures prepared from menstrual phase endometrium (CD3 and CD4) with 17β-E2 and P. To test the importance of 17β-E2 in the response of late proliferative phase endometrium to P, 17β-E2 was also omitted from some cultures. The steroid hormones were provided by Organon N.V. (Oss, The Netherlands).
Total RNA extraction and cDNA synthesis. Total cellular RNA from explants was extracted using the SV total RNA isolation kit (Promega, USA) according to the manufacturer’s protocol, with slight modifications: The concentration of DNase-1 during DNase treatment of the RNA samples was doubled, and the incubation time was extended by 15 min in order to completely remove genomic DNA. Total RNA was eluted from the column in 50 µl RNase-free water and stored at −70°C until further analysis. The quality of the RNA samples was determined with the Agilent bioanalyzer 2100 lab-on-a-chip (Agilent, USA). All the samples analysed gave 28S to 18S ratios higher than 1.5. PCR for a housekeeping gene, GAPDH, was performed to confirm that the RNA samples were free of genomic DNA.
Total RNA (1 µg) was incubated with random hexamers (1 µg/µl, Promega) at 70°C for 10 min. The samples were chilled on ice for 5 min. To this mixture, a reverse transcriptase (RT) mix consisting of 5× RT buffer (4 µl), 10 mM dNTP mix (1 µl; Pharmacia, Uppsala, Sweden), 0.1 M DTT (2 µl; Invitrogen, CA, USA), and superscript II reverse transcriptase (200 U/µl; Invitrogen) was added, and the samples were incubated at 42°C for 1 h, after which the reverse transcriptase was inactivated by heating the samples at 95°C for 5 min. The cDNA was stored at −20°C until further use. In each real-time PCR reaction, 50 ng cDNA template was used.
Affymetrix gene chip microarrays. Pooling of the RNA samples was performed according to the phase of the menstrual cycle and treatment conditions, i.e. two RNA samples from the menstrual phase (CD3 and CD4) and two RNA samples from the late proliferative phase (CD12 and CD13) were pooled. cRNA was generated from the pooled RNA and was labelled with biotin according to the Affymetrix protocol (Santa Clara, USA). cDNA was hybridised to the Affymetrix HU-133A chips, which contains approximately 22 000 human oligonucleotide probe sets, including 68 controls. The chip hybridisations were carried out in triplicate. After washing, the chips were scanned and analysed using the MicroArray suite MAS5. A detail description of the Affymetrix chip content is available at the NetAffy analysis web page (http://www.affymetrix.com/analysis/index.affx).
Microarray data analysis. Following gene chip data quality control, data files (.EXP, .DAT, .CEL) generated by MAS5 were transferred by FTP to the server housing the Rosetta Resolver Gene Expression Data Analysis System. Rosetta Resolver uses Affymetrix gene chip error models to transform the raw data into a processed form that can be used in various expression analyses and allows normalization of sample data of triplicate hybridizations using one-way analysis of variance (ANOVA) [18]. Changes in expression levels between the control and the treated samples were calculated using two criteria: (1) the absolute fold change (>2-fold) (e.g. the ratio between treated and control samples) and (2) a corresponding p-value less than 0.01.
The use of microarrays results in a massive amount of data, which requires special tools to filter and extract relevant information. By combining the fold changes or log ratios and the p-value, we generated a so-called significance code, which simplifies the selection and extraction of genes of interest, especially when analyzing various conditions. The significance code assigned to the genes was based on ANOVA-retrieved p-values and up- or down-regulation compared to the untreated samples. A significance code of 1 (increased or up-regulated) was used for genes with p<0.01 and a log ratio >0; a significance code of −1 (decreased or down-regulated) was used for genes with p<0.01 and log ratio <0. For genes that didn’t show significant regulation, the significance code was 0 (log ratio =0 and p>0.01 independent of log ratio).
Data were then exported from Rosetta Resolver to the Spotfire decision site 7.1 (Spotfire,Göteborg, Sweden), in which gene sets of interest were visualized and subsequently selected. Data were analyzed through the use of Ingenuity Pathways Analysis (IPA, Ingenuity® Systems, www.ingenuity.com). The data set containing the significantly up- and down-regulated genes and the corresponding expression values were uploaded into the application. Each gene identifier was mapped to its corresponding gene object in the Ingenuity Pathways Knowledge Base. These genes, called focus genes, were overlaid onto a global molecular network developed from information contained in the Ingenuity Pathways Knowledge Base. Networks of these focus genes were then algorithmically generated based on their connectivity.
A network is a graphical representation of the molecular relationships between gene products. The gene products are represented as nodes, and the biological relationship between two nodes is represented as a line. All lines are supported by at least one reference in literature, textbook, or canonical information stored in the Ingenuity Pathways Knowledge Base. The intensity of the node colour indicates the degree of up- (red) or down- (green) regulation. Nodes are displayed using various shapes that represent the functional class of the gene product.
Validation of array data using real-time PCR analysis. A selection of genes was validated with q-PCR to confirm expression in the samples used for microarray analysis. In addition, the expression of these genes was evaluated in an independent series of experiments. To confirm that the genes induced by P in vitro are indeed up-regulated during the implantation window, we also assessed their expression levels in endometrial tissue collected in the ES and MS phases of the cycle.
Primers and probes were purchased from Perkin-Elmer Applied Biosystems as pre-developed assays. Human cyclophilin A was selected as an endogenous RNA control in order to normalize for differences in the amount of total RNA added to each reaction. Uncultured human endometrial tissue was included as a positive control. All PCR reactions were performed using an ABI Prism 7700 sequence detection system (Perkin-Elmer Applied Biosystems). The thermal cycling conditions comprised an initial decontamination step at 50°C for 2 min, a denaturation step at 958C for 10 min, and 40 cycles of 15 s at 95°C, followed by 1 min at 60°C. Experiments were performed for each sample in duplicate. Quantitative values were obtained from the threshold cycle number (Ct), at which the increase in the signal associated with exponential growth of PCR products was first detected with the ABI Prism 7700 sequence detector software (Perkin-Elmer, Foster city, CA) The fold-change in expression was calculated using the δδ Ct method, with cyclophilin A mRNA as an internal control [19]. For a detailed description of the procedure, please refer to the ABI user manual (http://www.uk1.unifreiburg.de/core/facility/tagman/user_bulletin_2.pdf).
Statistical analysis of real-time PCR results. Statistical tests were carried out using the SPSS 11 (SPSS Inc., Chicago, IL) statistical analysis package. The effects of 17β-E2+P and P alone on cultured explants were analysed using the nonparametric paired Wilcoxon signed rank test at a confidence level of 95%. The nonparametric unpaired Mann-Whitney U test at a confidence level of 95% was employed to analyse the real-time PCR data generated from uncultured ES phase endometrial tissue and uncultured MS phase endometrial tissue.
Results
Validation of array data with quantitative real-time PCR. Eight genes were selected from the initial dataset on the basis of fold-change (≥2-fold) and on literature-documented expression during the implantation window: (1) four genes previously described in literature to be up-regulated during the implantation window and selectively stimulated by 17β-E2+P in late proliferative phase but not menstrual phase endometrium (Dickkopf homolog 1, DDK1; thrombomodulin, THBD; monoamine oxidase A, MAOA; gastrin, GAS) [2, 20, 21]; (2) two genes not yet reported that were selectively stimulated by 17β-E2+P in late proliferative phase explants but not in menstrual phase explants (cytidine deaminase, CDA; SPARC-like 1, SPARCL1); and (3) two genes that were selectively stimulated by 17β-E2+P in menstrual phase explants but not in late proliferative phase explants (trefoil factor 1, TFF1; mammaglobin 1).
The real-time PCR results corroborated well with the array data (Table 1). We performed additional independent experiments to validate the observed effects of treatment with 17β-E2+P and P alone (Fig. Fig1). From the validated genes, DKK1, MAOA and SPARCL1 were significantly stimulated by P in late proliferative and menstrual phase explants both in the presence and absence of 17β-E2. The induction of SPARCL1 expression by P was significantly decreased in the presence of 17β-E2 in both menstrual and late proliferative phase explants.
Table 1.
Validation results of the microarray findings for selected genes.
| Gene | Real-time PCR individual samples | Pooled array samples | |||||||||
|---|---|---|---|---|---|---|---|---|---|---|---|
| E2+P | M phase | E2+P | LP phase | P alone | M phase | P alone | LP phase | E2+P | E2+P | P alone | |
| CD3 | CD4 | CD12 | CD13 | CD3 | CD4 | CD12 | CD13 | M phase | LP phase | LP phase | |
| DKK1 | 1.80 | 1.93 | 2.67 | 12.68 | 3.20 | 2.96 | 4.27 | 13.69 | 1.58 | 6.03 | 5.01 |
| THBD | 1.11 | 1.14 | 2.72 | 4.08 | 2.24 | 3.59 | 2.67 | 3.48 | 1.30 | 2.95 | 2.43 |
| MAOA | 0.97 | 1.19 | 5.64 | 1.85 | 1.82 | 1.80 | 6.36 | 1.19 | 1.10 | 2.59 | 2.00 |
| GAS | 0.69 | 0.26 | 1.07 | 3.07 | 1.51 | 0.57 | 1.95 | 2.49 | 1.00 | 2.19 | 1.58 |
| CDA | 1.27 | 0.62 | 1.97 | 4.01 | 1.09 | 1.34 | 1.02 | 3.61 | 0.32 | 2.82 | 1.86 |
| SPARCL1 | 1.47 | 2.43 | 6.96 | 3.02 | 1.11 | 1.87 | 4.07 | 2.36 | 1.29 | 2.00 | 2.04 |
Gene transcript levels of DKK1, THBD, MAOA, GAS, CDA and SPARCL1 were assessed with quantitative real-time PCR in the individual samples used for microarray hybridization. Data are presented as fold change [P, progresterone; E2, 17/gb-oestradiol; CD, cycle day; M, menstrual (n=2); LP, late proliferative (n=2)].
Figure 1.
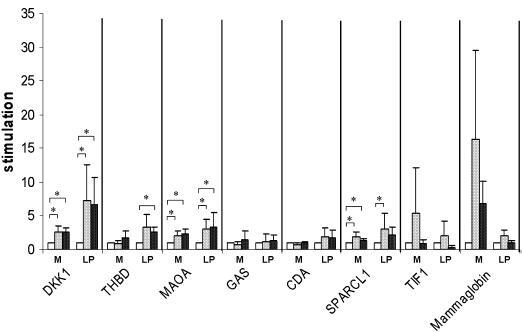
Mean fold changes found for DKK1, THBD, MAOA, GAS, CDA and SPARCL1 in menstrual phase (M, n=4) and late proliferative phase (LP, n=3) explants treated with 17β-oestradiol and progesterone (17β-E2+P, dark grey bars) or P alone (light grey bars). Controls (open bars) were cultured with vehicle alone. Data are presented as fold changes (*p<0.05).
The response of DKK1 to P was higher in the late proliferative phase explants than in the menstrual phase explants, whereas the induction of mammaglobin expression by 17β-E2+P and P alone was more pronounced in menstrual phase than in late proliferative phase endometrium. Thrombomodulin expression was induced only by P in late proliferative phase explants.
The expression of DKK1, THBD, MAOA, GAS, CDA and SPARCL1 was also assessed in an independent series of ES and MS endometrial samples to confirm selective up-regulation in the implantation window. The expression levels are presented in Fig. 2. The expression of DKK1, MAOA, CDA and SPARCL1 was significantly higher in MS endometrium compared to ES endometrium.
Figure 2.
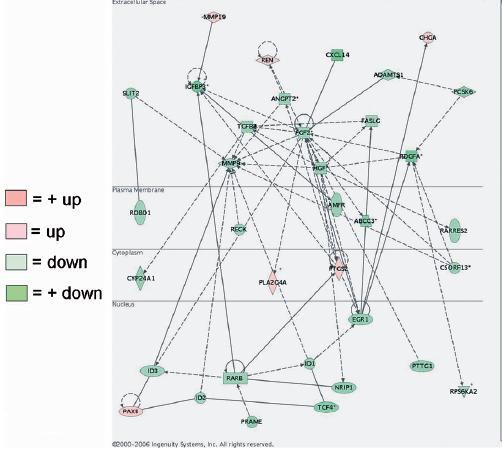
Example of a highly significant network identified in the gene expression profile of menstrual phase endometrium treated with 17β-oestradiol and progesterone (17β-E2+P) as determined by the Ingenuity Pathways Analysis program.
Gene expression in menstrual and late proliferative phase endometrial tissue explants after 17β-E 2 +P or P treatment. Treatment of late proliferative phase endometrial tissue with 17β-E2+P up-regulated (≥2-fold) the expression of 110 gene transcripts and down-regulated (≥2-fold) the expression of 109 gene transcripts when compared to the control (vehicle) (Table 2). Treating late proliferative phase explants with P alone up-regulated (≥2-fold) the expression of 107 gene transcripts and down-regulated (≥2-fold) the expression of 54 gene transcripts when compared to the control (vehicle) (Table 3). A total of 77/107 up-regulated and 42/54 down-regulated genes were also modulated by 17β-E2+P treatment in late proliferative phase explants (Table 3).
Table 2.
Genes affected by 17β-oestradiol and progesterone (17/gb−E2+P) in explants of late proliferative phase endometrium.
| Gene | Gene Symbol | fold change | Accession # | Function |
|---|---|---|---|---|
| cytochrome P450, family 26, subfamily A, polypeptide 1 | CYP26A1 | 33.11 | NM_000783.1 | metabolism |
| hemoglobin, alpha 2 | – | 28.18 | V00489 | – |
| calpain 6 | CAPN6 | 19.05 | NM_014289.2 | metabolism |
| heart and neural crest derivatives expressed 2 | HAND2 | 10.47 | NM_021973.1 | transcription factor |
| secretoglobin, family 1D, member 2 | SCGB1D2 | 10.00 | NM_006551.2 | extracellular matrix |
| hemoglobin, alpha 1 | HBA1 | 9.55 | AF105974.1 | transport |
| FK506 binding protein 5 | FKBP5 | 7.76 | NM_004117.1 | metabolism |
| chemokine (C-X-C motif) ligand 11 | CXCL11 | 7.59 | AF030514.1 | signal transduction |
| carbohydrate (N-acetylglucosamine 6-O) sulfotransferase 7 | CHST7 | 7.08 | NM_019886.1 | metabolism |
| glycine-N-acyltransferase | GLYAT | 6.17 | AW024233 | metabolism |
| hemoglobin, beta | HBB | 6.17 | M25079.1 | transport |
| dickkopf homolog 1 (Xenopus laevis) | DKK1 | 6.03 | NM_012242.1 | growth factor |
| Homo sapiens mutant beta-globin (HBB) gene, complete cds. | – | 5.50 | AF059180 | – |
| neuronal pentraxin II | NPTX2 | 5.50 | U26662.1 | cell adhesion |
| PDZ domain containing 3 | PDZK3 | 5.50 | AF338650.1 | signal transduction |
| apolipoprotein D | APOD | 4.90 | NM_001647.1 | transport |
| alkaline phosphatase, placental (Regan isozyme) | ALPP | 4.79 | NM_001632.2 | metabolism |
| keratin 6A | KRT6A | 4.68 | J00269.1 | structural protein |
| G protein-coupled receptor 105 | GPR105 | 4.47 | NM_014879.1 | signal transduction |
| solute carrier family 7, member 8 | SLC7A8 | 4.37 | NM_012244.1 | transport |
| hypothetical protein FLJ11539 | FLJ11539 | 4.17 | NM_024748.1 | – |
| a disintegrin-like and metalloprotease with thrombospondin type 1 mtif, 8 | ADAMTS8 | 3.98 | NM_007037.1 | cell growth |
| integrin, beta-like 1 | ITGBL1 | 3.80 | NM_004791.1 | cell adhesion |
| potassium inwardly-rectifying channel, subfamily J, member 8 | KCNJ8 | 3.80 | NM_004982.1 | transport |
| RGC32 protein | RGC32 | 3.80 | NM_014059.1 | cell growth |
| prostaglandin-endoperoxide synthase 1 | PTGS1 | 3.72 | NM_000962.1 | metabolism |
| regulator of G-protein signalling 2, 24kDa | RGS2 | 3.72 | NM_002923.1 | signal transduction |
| cannabinoid receptor 1 (brain) | CNR1 | 3.55 | U73304 | signal transduction |
| hemoglobin, delta | HBD | 3.39 | NM_000519.2 | transport |
| keratin 6B | KRT6B | 3.39 | L42612.1 | structural protein |
| sushi-repeat-containing protein, X-linked | SRPX | 3.24 | NM_006307.1 | cell adhesion |
| thrombomodulin | THBD | 3.24 | NM_000361.1 | membrane protein |
| delta sleep inducing peptide, immunoreactor | DSIPI | 3.16 | AL110191.1 | transcription factor |
| cytochrome P450, family 4, subfamily B, polypeptide 1 | CYP4B1 | 3.09 | J02871.1 | metabolism |
| hemoglobin, gamma A | HBG1 | 3.09 | NM_000559.1 | transport |
| paired basic amino acid cleaving system 4 | PACE4 | 3.09 | NM_002570.1 | signal transduction |
| insulin receptor substrate 2 | IRS2 | 3.02 | BF700086 | signal transduction |
| metallothionein 1K | MT1K | 2.95 | R06655 | transport |
| amylase, alpha 1A; salivary | AMY1A | 2.88 | NM_004038.1 | metabolism |
| fibrinogen-like 2 | FGL2 | 2.88 | NM_006682.1 | extracellular matrix |
| latent transforming growth factor beta binding protein 1 | LTBP1 | 2.88 | NM_000627.1 | protein binding |
| monoamine oxidase A | MAOA | 2.88 | NM_000240.1 | transport |
| retinol binding protein 4, plasma | RBP4 | 2.88 | NM_006744.2 | transport |
| cytidine deaminase | CDA | 2.82 | NM_001785.1 | metabolism |
| potassium voltage-gated channel, subfamily G, member 1 | KCNG1 | 2.82 | AI332979 | transport |
| mitogen-activated protein kinase kinase 6 | MAP2K6 | 2.82 | NM_002758.1 | signal transduction |
| solute carrier family 15 (H+/peptide transporter), member 2 | SLC15A2 | 2.82 | BF223679 | transport |
| hemoglobin, gamma G | HBG2 | 2.75 | AI133353 | transport |
| protein kinase, X-linked | PRKX | 2.75 | NM_005044.1 | metabolism |
| suppressor of cytokine signaling 1 | SOCS1 | 2.75 | AB005043.1 | signal transduction |
| KIAA0924 protein | KIAA0924 | 2.69 | NM_014897.1 | nuclear |
| secretoglobin, family 1D, member 1 | SCGB1D1 | 2.69 | NM_006552.1 | extracellular matrix |
| serine (or cysteine) proteinase inhibitor, clade E, member 1 | SERPINE1 | 2.69 | NM_000602.1 | metabolism |
| chloride channel 4 | CLCN4 | 2.63 | AA071195 | transport |
| fatty-acid-Coenzyme A ligase, long-chain 2 | FACL2 | 2.63 | NM_001995.1 | metabolism |
| monoamine oxidase B | MAOB | 2.63 | NM_000898.1 | transport |
| secretoglobin, family 2A, member 1 | SCGB2A1 | 2.63 | NM_002407.1 | hormone binding |
| ATPase, H+ transporting, lysosomal 70kDa, V1 subunit A | ATP6V1A | 2.57 | NM_001690.1 | transport |
| dipeptidylpeptidase 4 | DPP4 | 2.57 | M80536.1 | metabolism |
| nuclear factor I/B | NFIB | 2.57 | AI186739 | transcription factor |
| creatine kinase, brain | CKB | 2.51 | NM_001823.1 | metabolism |
| cytokine receptor-like factor 1 | CRLF1 | 2.51 | NM_004750.1 | signal transduction |
| iroquois homeobox protein 4 | IRX4 | 2.51 | NM_016358.1 | transcription factor |
| Homo sapiens mRNA; cDNA DKFZp586B0220 | – | 2.45 | AL049435.1 | – |
| chemokine (C-X-C motif) ligand 10 | CXCL10 | 2.45 | NM_001565.1 | signal transduction |
| hypothetical protein FLJ20701 | FLJ20701 | 2.45 | NM_017933.1 | – |
| insulin-like growth factor binding protein 1 | IGFBP1 | 2.45 | NM_000596.1 | signal transduction |
| Norrie disease (pseudoglioma) | NDP | 2.45 | NM_000266.1 | signal transduction |
| zinc finger protein 145 | ZNF145 | 2.45 | NM_006006.1 | protein binding |
| hypothetical protein FLJ20366 | FLJ20366 | 2.40 | NM_017786.1 | – |
| peroxisome proliferative activated receptor, gamma, coactivator 1 | PPARGC1 | 2.40 | NM_013261.1 | DNA binding |
| S100 calcium binding protein A2 | S100A2 | 2.40 | NM_005978.2 | transport |
| Arg/Abl-interacting protein ArgBP2 | ARGBP2 | 2.34 | NM_021069.1 | structural protein |
| interleukin 1 receptor-like 1 | IL1RL1 | 2.34 | NM_003856.1 | signal transduction |
| NPD009 protein | NPD009 | 2.34 | AF237813.1 | – |
| Cbp/p300-interacting transactivator, with Glu/Asp-rich carboxy-terminal domain, 2 | CITED2 | 2.29 | NM_006079.1 | transcription factor |
| colony stimulating factor 2 receptor, alpha, low-affinity | CSF2RA | 2.29 | BC002635.1 | immune response |
| secreted and transmembrane 1 | SECTM1 | 2.29 | BF939675 | membrane protein |
| H.sapiens mRNA for interleukin-15 | – | 2.24 | Y09908.1 | – |
| GREB1 protein | GREB1 | 2.24 | NM_014668.1 | – |
| adiponectin receptor 2 | ADIPOR2 | 2.19 | NM_024551.1 | membrane protein |
| hypothetical protein DKFZp434B044 | DKFZP434B044 | 2.19 | AL136861.1 | extracellular matrix |
| gastrin | GAS | 2.19 | NM_000805.2 | signal transduction |
| alkaline phosphatase, liver/bone/kidney | ALPL | 2.14 | X14174.1 | metabolism |
| chromosome 1 open reading frame 29 | C1orf29 | 2.14 | NM_006820.1 | – |
| Fas apoptotic inhibitory molecule | FAIM | 2.14 | NM_018147.1 | – |
| KIAA0089 protein | KIAA0089 | 2.14 | AA135522 | metabolism |
| POU domain, class 5, transcription factor 1 | POU5F1 | 2.14 | NM_002701.1 | transcription factor |
| serum amyloid A2 | SAA2 | 2.14 | M23699.1 | immune response |
| SEC14-like 1 (S. cerevisiae) | SEC14L1 | 2.14 | AV748469 | transport |
| solute carrier family 26 (sulfate transporter), member 2 | SLC26A2 | 2.14 | AI025519 | transport |
| CDC14 cell division cycle 14 homolog B (S. cerevisiae) | CDC14B | 2.09 | AU145941 | metabolism |
| hypothetical protein FLJ11795 | FLJ11795 | 2.09 | NM_024669.1 | – |
| likely ortholog of mouse tumor necrosis-alpha-induced adipose-related protein | FLJ23153 | 2.09 | NM_024636.1 | transport |
| KIAA0960 protein | KIAA0960 | 2.09 | BF447246 | – |
| oxysterol binding protein-like 11 | OSBPL11 | 2.09 | NM_022776.1 | transport |
| protein tyrosine phosphatase, receptor type, R | PTPRR | 2.09 | NM_002849.1 | signal transduction |
| fibrinogen, A alpha polypeptide | FGA | 2.04 | NM_021871.1 | cell adhesion |
| interleukin 6 signal transducer (gp130, oncostatin M receptor) | IL6ST | 2.04 | AB015706.1 | signal transduction |
| KIAA0367 protein | KIAA0367 | 2.04 | AL138349 | – |
| KIAA0711 gene product | KIAA0711 | 2.04 | NM_014867.1 | protein binding |
| ADP-ribosyltransferase 3 | ART3 | 2.00 | U47054.1 | metabolism |
| cut-like 2 (Drosophila) | CUTL2 | 2.00 | AB006631.1 | transcription factor |
| dual specificity phosphatase 1 | DUSP1 | 2.00 | AA530892 | metabolism |
| eukaryotic translation initiation factor 2, subunit 3 gamma, 52kDa | EIF2S3 | 2.00 | NM_001415.1 | translation |
| interleukin 20 receptor, alpha | IL20RA | 2.00 | NM_014432.1 | signal transduction |
| PRO2000 protein | PRO2000 | 2.00 | NM_014109.1 | DNA binding |
| solute carrier family 7, member 2 | SLC7A2 | 2.00 | NM_003046.1 | transport |
| SPARC-like 1 (mast9, hevin) | SPARCL1 | 2.00 | NM_004684.1 | – |
| toll-like receptor 2 | TLR2 | 2.00 | NM_003264.1 | immune response |
| coagulation factor XIII, A1 polypeptide | F13A1 | −2.00 | NM_000129.2 | metabolism |
| protein kinase (cAMP-dependent, catalytic) inhibitor alpha | PKIA | −2.00 | NM_006823.1 | metabolism |
| glutaminyl-peptide cyclotransferase (glutaminyl cyclase) | QPCT | −2.00 | NM_012413.2 | metabolism |
| TGF2_HUMAN Transforming growth factor beta 2 precursor (TGF-beta 2) | – | −2.04 | BF061658 | – |
| cadherin 5, type 2, VE-cadherin (vascular epithelium) | CDH5 | −2.04 | NM_001795.1 | cell adhesion |
| cellular retinoic acid binding protein 2 | CRABP2 | −2.04 | NM_001878.2 | signal transduction |
| drebrin 1 | DBN1 | −2.04 | NM_004395.1 | structural protein |
| dimethylarginine dimethylaminohydrolase 2 | DDAH2 | −2.04 | AJ012008 | metabolism |
| early growth response 1 | EGR1 | −2.04 | NM_001964.1 | transcription factor |
| hypothetical protein FLJ11082 | FLJ11082 | −2.04 | NM_018317.1 | – |
| matrix metalloproteinase 1 (interstitial collagenase) | MMP1 | −2.04 | NM_002421.2 | metabolism |
| matrix metalloproteinase 3 (stromelysin 1, progelatinase) | MMP3 | −2.04 | NM_002422.2 | metabolism |
| matrix metalloproteinase 9 | MMP9 | −2.04 | NM_004994.1 | metabolism |
| reticulon 3 | RTN3 | −2.04 | NM_023941.1 | membrane protein |
| stanniocalcin 1 | STC1 | −2.04 | U46768.1 | signal transduction |
| Thy-1 cell surface antigen | THY1 | −2.04 | AL558479 | membrane protein |
| tumor necrosis factor receptor superfamily, member 21 | TNFRSF21 | −2.04 | NM_016629.1 | signal transduction |
| basic helix-loop-helix domain containing, class B, 3 | BHLHB3 | −2.09 | BE857425 | transcription factor |
| chromosome 21 open reading frame 7 | C21orf7 | −2.09 | NM_020152.1 | – |
| glycoprotein A repetitions predominant | GARP | −2.09 | NM_005512.1 | – |
| regulator of G-protein signalling 3 | RGS3 | −2.09 | NM_021106.1 | signal transduction |
| trefoil factor 1 | TFF1 | −2.09 | NM_003225.1 | growth factor |
| ATP-binding cassette, sub-family A (ABC1), member 8 | ABCA8 | −2.14 | NM_007168.1 | transport |
| hypothetical gene BC008967 | BC008967 | −2.14 | BE299456 | – |
| solute carrier family 14 (urea transporter), member 1 | SLC14A1 | −2.14 | NM_015865.1 | transport |
| a disintegrin and metalloproteinase domain 12 (meltrin alpha) | ADAM12 | −2.19 | NM_003474.2 | metabolism |
| aquaporin 3 | AQP3 | −2.19 | AB001325 | transport |
| carcinoembryonic antigen-related cell adhesion molecule 6 | CEACAM6 | −2.19 | BC005008.1 | signal transduction |
| chloride channel, calcium activated, family member 4 | CLCA4 | −2.19 | NM_012128.2 | transport |
| chloride intracellular channel 2 | CLIC2 | −2.19 | AI768628 | transport |
| DVS27-related protein | DVS27 | −2.19 | AB024518.1 | – |
| hypothetical protein FLJ31737 | FLJ31737 | −2.19 | N91149 | – |
| fascin homolog 1, actin-bundling protein | FSCN1 | −2.19 | NM_003088.1 | structural protein |
| synuclein, alpha interacting protein (synphilin) | SNCAIP | −2.19 | NM_005460.1 | protein binding |
| embryonal Fyn-associated substrate | EFS | −2.24 | NM_005864.1 | cell adhesion |
| integral membrane protein 2C | ITM2C | −2.24 | NM_030926.1 | – |
| keratin 23 (histone deacetylase inducible) | KRT23 | −2.24 | NM_015515.1 | – |
| matrix metalloproteinase 27 | MMP27 | −2.24 | NM_022122.1 | metabolism |
| pre-B-cell leukemia transcription factor 1 | PBX1 | −2.24 | BF967998 | transcription |
| suppression of tumorigenicity | ST7 | −2.24 | NM_013437.1 | – |
| Homo sapiens mRNA, chromosome 1 specific transcript KIAA0509. | – | −2.29 | AB007978.1 | – |
| apolipoprotein B mRNA editing enzyme, catalytic polypeptide-like 3B | APOBEC3B | −2.29 | NM_004900.1 | metabolism |
| ARF-GAP, RHO-GAP, ankyrin repeat and plekstrin homology domains-containing protein 3 | ARAP3 | −2.29 | NM_022481.1 | signal transduction |
| carboxypeptidase Z | CPZ | −2.29 | BC006393.1 | metabolism |
| melanoma antigen, family D, 4 | MAGED4 | −2.29 | NM_030801.1 | – |
| matrilin 4 | MATN4 | −2.29 | NM_003833.2 | extracellular matrix |
| regulator of G-protein signalling 4 | RGS4 | −2.29 | AL514445 | signal transduction |
| chromosome 6 open reading frame 59 | C6orf59 | −2.34 | NM_020133.1 | – |
| aldo-keto reductase family 1, member B10 (aldose reductase) | AKR1B10 | −2.40 | NM_020299.1 | metabolism |
| angiopoietin 2 | ANGPT2 | −2.40 | AF187858.1 | signal transduction |
| dapper homolog 1, antagonist of beta-catenin (xenopus) | DACT1 | −2.40 | NM_016651.2 | nuclear |
| G protein-coupled receptor 17 | GPR17 | −2.40 | NM_005291.1 | signal transduction |
| glutathione peroxidase 2 (gastrointestinal) | GPX2 | −2.40 | NM_002083.1 | metabolism |
| microfibrillar-associated protein 2 | MFAP2 | −2.40 | NM_017459.1 | extracellular matrix |
| transforming growth factor, beta 3 | TGFB3 | −2.40 | J03241.1 | growth factor |
| WNT1 inducible signaling pathway protein 2 | WISP2 | −2.40 | NM_003881.1 | signal transduction |
| hepatocyte growth factor (hepapoietin A; scatter factor) | HGF | −2.45 | M77227.1 | growth factor |
| KIAA1277 protein | KIAA1277 | −2.45 | AA127623 | – |
| matrix metalloproteinase 14 (membrane-inserted) | MMP14 | −2.45 | AU149305 | metabolism |
| Ras family member Ris | RIS | −2.45 | NM_016563.1 | signal transduction |
| thymosin, beta, identified in neuroblastoma cells | TMSNB | −2.45 | NM_021992.1 | structural protein |
| latexin protein | LXN | −2.51 | NM_020169.1 | – |
| serine (or cysteine) proteinase inhibitor, clade B (ovalbumin), member 2 | SERPINB2 | −2.51 | NM_002575.1 | cell growth |
| carbonic anhydrase II | CA2 | −2.57 | M36532.1 | metabolism |
| deleted in malignant brain tumors 1 | DMBT1 | −2.57 | NM_004406.1 | cell growth |
| fibronectin leucine rich transmembrane protein 2 | FLRT2 | −2.57 | NM_013231.1 | cell adhesion |
| orosomucoid 1 | ORM1 | −2.57 | NM_000608.1 | transport |
| stathmin-like 2 | STMN2 | −2.57 | BF967657 | signal transduction |
| synaptojanin 2 | SYNJ2 | −2.57 | AF318616.1 | metabolism |
| carcinoembryonic antigen-related cell adhesion molecule 5 | CEACAM5 | −2.63 | NM_004363.1 | membrane protein |
| ectodermal-neural cortex (with BTB-like domain) | ENC1 | −2.63 | NM_003633.1 | protein binding |
| mucin 4, tracheobronchial | MUC4 | −2.63 | AJ242547.1 | signal transduction |
| protocadherin 16 dachsous-like (Drosophila) | PCDH16 | −2.63 | BF222893 | cell adhesion |
| interleukin 24 | IL24 | −2.69 | NM_006850.1 | signal transduction |
| transforming growth factor, beta 2 | TGFB2 | −2.69 | NM_003238.1 | growth factor |
| integrin, beta 3 (platelet glycoprotein IIIa, antigen CD61) | ITGB3 | −2.75 | M35999.1 | cell adhesion |
| plasminogen activator, urokinase | PLAU | −2.75 | NM_002658.1 | metabolism |
| chromosome 20 open reading frame 42 | C20orf42 | −2.82 | NM_017671.1 | – |
| four jointed box 1 (Drosophila) | FJX1 | −2.82 | NM_014344.1 | – |
| ephrin-B2 | EFNB2 | −2.88 | BF001670 | cell growth |
| parathyroid hormone-like hormone | PTHLH | −2.88 | BC005961.1 | signal transduction |
| tribbles homolog 2 | TRB2 | −2.88 | NM_021643.1 | metabolism |
| twist homolog 1 | TWIST1 | −2.88 | X99268.1 | DNA binding |
| gap junction protein, alpha 4, 37kDa (connexin 37) | GJA4 | -2.95 | NM_002060.1 | transport |
| integrin, beta 6 | ITGB6 | −2.95 | NM_000888.3 | cell adhesion |
| bradykinin receptor B1 | BDKRB1 | −3.02 | NM_000710.1 | signal transduction |
| solute carrier family 21 (organic anion transporter), member 11 | SLC21A11 | −3.02 | NM_013272.2 | transport |
| myristoylated alanine-rich protein kinase C substrate | MARCKS | −3.09 | M68956.1 | membrane protein |
| angiopoietin-like 2 | ANGPTL2 | −3.16 | NM_012098.1 | signal transduction |
| tumor necrosis factor receptor superfamily, member 11b (osteoprotegerin) TNFRSF11B | −3.16 | NM_002546.1 | signal transduction | |
| acid phosphatase, prostate | ACPP | −3.24 | NM_001099.2 | metabolism |
| homeo box A11 | HOXA11 | −3.24 | NM_005523.3 | transcription factor |
| hypothetical protein FLJ38993 | FLJ38993 | −3.31 | AF070524.1 | signal transduction |
| matrix metalloproteinase 11 (stromelysin 3) | MMP11 | −3.31 | AI761713 | metabolism |
| pleckstrin 2 | PLEK2 | −3.31 | NM_016445.1 | signal transduction |
| SRY (sex determining region Y)-box 9 | SOX9 | −3.31 | NM_000346.1 | DNA binding |
| lymphocyte-specific protein tyrosine kinase | LCK | −3.39 | NM_005356.1 | signal transduction |
| BDG-29 proten | BDG29 | −3.47 | AL117532.1 | DNA binding |
| deiodinase, iodothyronine, type II | DIO2 | −3.47 | U53506.1 | metabolism |
| SRY (sex determining region Y)-box 4 | SOX4 | −3.47 | AI989477 | transcription factor |
| cysteine knot superfamily 1, BMP antagonist 1 | CKTSF1B1 | −3.63 | AF154054.1 | – |
| chromogranin A (parathyroid secretory protein 1) | CHGA | −3.72 | NM_001275.2 | transport |
| cystic fibrosis transmembrane conductance regulator, ATP-binding cassette | CFTR | −4.07 | NM_000492.2 | transport |
| Ras-induced senescence 1 | RIS1 | −4.07 | BF062629 | – |
| hypothetical protein FLJ10640 | FLJ10640 | −4.17 | NM_024703.1 | metabolism |
| ribosomal protein S20 | RPS20 | −4.27 | AF113008.1 | protein biosynthesis |
| SRY (sex determining region Y)-box 11 | SOX11 | −4.68 | AB028641.1 | transcription factor |
| platelet-derived growth factor beta polypeptide | PDGFB | −5.75 | NM_002608.1 | growth factor |
| ribosomal protein L27a | RPL27A | −5.75 | BE737027 | protein biosynthesis |
Gene transcripts regulated (≥2-fold) by 17β-E2+P in late proliferative phase explants when compared to the vehicle-treated controls. Data are presented as fold changes.
Table 3.
Genes affected by progesterone alone in explants of late proliferative phase endometrium.
| Gene | Gene Symbol | fold change | Accession # | Function |
|---|---|---|---|---|
| cytochrome P450, family 26, subfamily A, polypeptide 1 | CYP26A1 | 28.84 | NM_000783.1 | metabolism |
| calpain 6 | CAPN6 | 19.50 | NM_014289.2 | metabolism |
| hemoglobin, alpha 2 | – | 12.88 | V00489 | – |
| heart and neural crest derivatives expressed 2 | HAND2 | 10.96 | NM_021973.1 | transcription factor |
| secretoglobin, family 1D, member 2 | SCGB1D2 | 9.55 | NM_006551.2 | extracellular matrix |
| carbohydrate (N-acetylglucosamine 6-O) sulfotransferase 7 | CHST7 | 7.59 | NM_019886.1 | metabolism |
| glycine-N-acyltransferase | GLYAT | 7.08 | AW024233 | metabolism |
| FK506 binding protein 5 | FKBP5 | 6.31 | NM_004117.1 | metabolism |
| PDZ domain containing 3 | PDZK3 | 6.17 | AF338650.1 | signal transduction |
| neuronal pentraxin II | NPTX2 | 6.03 | U26662.1 | cell adhesion |
| chemokine (C-X-C motif) ligand 11 | CXCL11 | 5.50 | AF030514.1 | signal transduction |
| solute carrier family 7, member 8 | SLC7A8 | 5.25 | NM_012244.1 | transport |
| a disintegrin-like and metalloprotease with thrombospondin type 1 motif, 8 | ADAMTS8 | 5.01 | NM_007037.1 | metabolism |
| dickkopf homolog 1 (Xenopus laevis) | DKK1 | 5.01 | NM_012242.1 | growth factor |
| keratin 6A | KRT6A | 4.90 | J00269.1 | structural protein |
| alkaline phosphatase, placental (Regan isozyme) | ALPP | 4.79 | NM_001632.2 | metabolism |
| apolipoprotein D | APOD | 4.68 | NM_001647.1 | transport |
| G protein-coupled receptor 105 | GPR105 | 4.68 | NM_014879.1 | signal transduction |
| prostaglandin-endoperoxide synthase 1 | PTGS1 | 4.68 | NM_000962.1 | metabolism |
| TU3A protein | TU3A | 4.68 | AL050264.1 | – |
| hemoglobin, alpha 1 | HBA1 | 4.57 | AF105974.1 | transport |
| mitogen-activated protein kinase kinase 6 | MAP2K6 | 4.27 | NM_002758.1 | signal transduction |
| keratin 6B | KRT6B | 4.07 | L42612.1 | structural protein |
| claudin 5 | CLDN5 | 3.98 | NM_003277.1 | structural protein |
| regulator of G-protein signalling 2, 24kDa | RGS2 | 3.98 | NM_002923.1 | signal transduction |
| RGC32 protein | RGC32 | 3.89 | NM_014059.1 | cell growth |
| integrin, beta-like 1 | ITGBL1 | 3.80 | NM_004791.1 | cell adhesion |
| solute carrier family 15, member 2 | SLC15A2 | 3.72 | BF223679 | transport |
| delta sleep inducing peptide, immunoreactor | DSIPI | 3.55 | AL110191.1 | transcription factor |
| myosin heavy chain Myr 8 | MYR8 | 3.55 | AI522028 | metabolism |
| potassium inwardly-rectifying channel, subfamily J, member 8 | KCNJ8 | 3.31 | NM_004982.1 | transport |
| paired basic amino acid cleaving system 4 | PACE4 | 3.31 | NM_002570.1 | signal transduction |
| cannabinoid receptor 1 (brain) | CNR1 | 3.24 | U73304 | signal transduction |
| hypothetical protein FLJ11539 | FLJ11539 | 3.24 | NM_024748.1 | – |
| protein kinase, X-linked | PRKX | 3.24 | NM_005044.1 | metabolism |
| latent transforming growth factor beta binding protein 1 | LTBP1 | 3.16 | NM_000627.1 | protein binding |
| KIAA0960 protein | KIAA0960 | 3.09 | BF447246 | – |
| nuclear factor I/B | NFIB | 3.02 | AI186739 | transcription factor |
| sushi-repeat-containing protein, X-linked | SRPX | 3.02 | NM_006307.1 | cell adhesion |
| cytochrome P450, family 4, subfamily B, polypeptide 1 | CYP4B1 | 2.95 | J02871.1 | metabolism |
| insulin receptor substrate 2 | IRS2 | 2.95 | BF700086 | signal transduction |
| potassium voltage-gated channel, subfamily G, member 1 | KCNG1 | 2.95 | AI332979 | transport |
| Arg/Abl-interacting protein ArgBP2 | ARGBP2 | 2.88 | NM_021069.1 | structural protein |
| hemoglobin, beta | HBB | 2.88 | M25079.1 | transport |
| Homo sapiens mutant beta-globin (HBB) gene, complete cds. | – | 2.82 | AF059180 | – |
| RAR-related orphan receptor B | RORB | 2.82 | NM_006914.1 | transcription factor |
| S100 calcium binding protein A2 | S100A2 | 2.75 | NM_005978.2 | transport |
| serum amyloid A2 | SAA2 | 2.75 | NM_030754.1 | immune response |
| absent in melanoma 1-like | AIM1L | 2.69 | NM_017977.1 | – |
| RIM binding protein 2 | KIAA0318 | 2.69 | AB002316.1 | transport |
| thrombomodulin | THBD | 2.69 | NM_000361.1 | signal transduction |
| cytokine receptor-like factor 1 | CRLF1 | 2.63 | NM_004750.1 | signal transduction |
| v-maf musculoaponeurotic fibrosarcoma oncogene homolog (avian) | MAF | 2.51 | NM_005360.2 | transcription factor |
| monoamine oxidase B | MAOB | 2.51 | NM_000898.1 | transport |
| secretoglobin, family 1D, member 1 | SCGB1D1 | 2.51 | NM_006552.1 | extracellular matrix |
| interleukin 15 | IL15 | 2.45 | NM_000585.1 | signal transduction |
| hypothetical protein FLJ20701 | FLJ20701 | 2.45 | NM_017933.1 | – |
| secretoglobin, family 2A, member 1 | SCGB2A1 | 2.45 | NM_002407.1 | hormone binding |
| dipeptidylpeptidase 4 | DPP4 | 2.40 | M80536.1 | metabolism |
| immunoglobulin kappa constant | IGKC | 2.40 | BC005332.1 | immune response |
| immunoglobulin heavy constant gamma 3 (G3 m marker) | IGHG3 | 2.34 | M87789.1 | immune response |
| iroquois homeobox protein 4 | IRX4 | 2.34 | NM_016358.1 | transcription factor |
| killer cell immunoglobulin-like receptor, two domains, short cytoplasmic tail, 1 | KIR2DS1 | 2.34 | NM_014512.1 | immune response |
| metallothionein 1K | MT1K | 2.34 | R06655 | transport |
| amylase, alpha 1A; salivary | AMY1A | 2.29 | NM_004038.1 | metabolism |
| creatine kinase, brain | CKB | 2.29 | NM_001823.1 | metabolism |
| cut-like 2 (Drosophila) | CUTL2 | 2.29 | AB006631.1 | transcription factor |
| fatty-acid-Coenzyme A ligase, long-chain 2 | FACL2 | 2.29 | NM_001995.1 | metabolism |
| PRO2000 protein | PRO2000 | 2.29 | NM_014109.1 | DNA binding |
| serine (or cysteine) proteinase inhibitor, clade E , member 1 | SERPINE1 | 2.29 | NM_000602.1 | metabolism |
| adiponectin receptor 2 | ADIPOR2 | 2.24 | NM_024551.1 | membrane protein |
| alkaline phosphatase, liver/bone/kidney | ALPL | 2.24 | X14174.1 | metabolism |
| N-acylsphingosine amidohydrolase (acid ceramidase)-like | ASAHL | 2.24 | AK024677.1 | metabolism |
| hypothetical protein FLJ20366 | FLJ20366 | 2.24 | NM_017786.1 | – |
| Norrie disease (pseudoglioma) | NDP | 2.24 | NM_000266.1 | signal transduction |
| zinc finger, BED domain containing 2 | ZBED2 | 2.24 | NM_024508.1 | DNA binding |
| zinc finger protein 145 | ZNF145 | 2.24 | NM_006006.1 | protein binding |
| Fas apoptotic inhibitory molecule | FAIM | 2.19 | NM_018147.1 | – |
| insulin-like growth factor binding protein 1 | IGFBP1 | 2.19 | NM_000596.1 | signal transduction |
| interleukin 20 receptor, alpha | IL20RA | 2.19 | NM_014432.1 | signal transduction |
| mesothelin | MSLN | 2.19 | NM_005823.2 | – |
| secreted and transmembrane 1 | SECTM1 | 2.19 | BF939675 | membrane protein |
| CDC14 cell division cycle 14 homolog B | CDC14B | 2.14 | AU145941 | metabolism |
| cathepsin E | CTSE | 2.14 | NM_001910.1 | metabolism |
| LIM and cysteine-rich domains 1 | LMCD1 | 2.14 | NM_014583.1 | – |
| monoamine oxidase A | MAOA | 2.14 | NM_000240.1 | transport |
| toll-like receptor 2 | TLR2 | 2.14 | NM_003264.1 | signal transduction |
| Homo sapiens mRNA; cDNA DKFZp586B0220 | – | 2.09 | AL049435.1 | – |
| hypothetical protein DKFZp434B044 | DKFZP434B044 | 2.09 | AL136861.1 | extracellular matrix |
| glutamyl aminopeptidase | ENPEP | 2.09 | L12468.1 | metabolism |
| epithelial V-like antigen 1 | EVA1 | 2.09 | NM_005797.1 | cell adhesion |
| fibulin 2 | FBLN2 | 2.09 | NM_001998.1 | extracellular matrix |
| KIAA0924 protein | KIAA0924 | 2.09 | NM_014897.1 | nuclear |
| KIAA1609 protein | KIAA1609 | 2.09 | AA195017 | – |
| neuroligin 4 | NLGN4 | 2.09 | AI338338 | cell adhesion |
| peroxisome proliferative activated receptor, gamma, coactivator 1 | PPARGC1 | 2.09 | NM_013261.1 | DNA binding |
| solute carrier family 26, member 2 | SLC26A2 | 2.09 | AI025519 | transport |
| CDC42 effector protein 3 | CDC42EP3 | 2.04 | AI754416 | – |
| GREB1 protein | GREB1 | 2.04 | NM_014668.1 | – |
| interleukin 1 receptor-like 1 | IL1RL1 | 2.04 | NM_003856.1 | signal transduction |
| leucine-rich repeat-containing 1 | LRRC1 | 2.04 | NM_018214.1 | – |
| protein kinase, AMP-activated, gamma 2 non-catalytic subunit | PRKAG2 | 2.04 | NM_016203.1 | metabolism |
| SPARC-like 1 (mast9, hevin) | SPARCL1 | 2.04 | NM_004684.1 | – |
| chromosome 18 open reading frame 1 | C18orf1 | 2.00 | NM_004338.1 | membrane protein |
| choline phosphotransferase 1 | CHPT1 | 2.00 | AF195624.1 | metabolism |
| endothelial differentiation, lysophosphatidic acid G-protein-coupled receptor, 7 | EDG7 | 2.00 | NM_012152.1 | signal transduction |
| retinol binding protein 4, plasma | RBP4 | 2.00 | NM_006744.2 | transport |
| carcinoembryonic antigen-related cell adhesion molecule 5 | CEACAM5 | −2.00 | NM_004363.1 | membrane protein |
| chromosome condensation 1 | CHC1 | 2.00 | NM_001269.1 | cell growth |
| cytochrome P450, family 27, subfamily B, polypeptide 1 | CYP27B1 | 2.00 | NM_000785.1 | metabolism |
| DVS27-related protein | DVS27 | 2.00 | AB024518.1 | – |
| four jointed box 1 (Drosophila) | FJX1 | −2.00 | NM_014344.1 | – |
| interleukin 24 | IL24 | −2.00 | NM_006850.1 | cell growth |
| matrix metalloproteinase 11 (stromelysin 3) | MMP11 | −2.00 | AI761713 | metabolism |
| synaptojanin 2 | SYNJ2 | −2.00 | AF318616.1 | metabolism |
| aldo-keto reductase family 1, member B10 (aldose reductase) | AKR1B10 | −2.04 | NM_020299.1 | metabolism |
| neuromedin B | NMB | 2.04 | NM_021077.1 | signal transduction |
| pleckstrin 2 | PLEK2 | −2.04 | NM_016445.1 | structural protein |
| transmembrane protease, serine 3 | TMPRSS3 | 2.04 | NM_024022.1 | metabolism |
| twist homolog 1 | TWIST1 | −2.04 | X99268.1 | DNA binding |
| hypothetical protein FLJ38993 | FLJ38993 | −2.09 | AF070524.1 | signal transduction |
| somatostatin | SST | 2.09 | NM_001048.1 | signal transduction |
| chromosome 21 open reading frame 7 | C21orf7 | −2.14 | NM_020152.1 | – |
| carboxypeptidase M | CPM | 2.14 | NM_001874.1 | metabolism |
| glutathione peroxidase 2 (gastrointestinal) | GPX2 | −2.14 | NM_002083.1 | metabolism |
| orosomucoid 1 | ORM1 | −2.14 | NM_000607.1 | transport |
| serine (or cysteine) proteinase inhibitor, clade B (ovalbumin), member 2 | SERPINB2 | −2.14 | NM_002575.1 | cell growth |
| solute carrier family 14 (urea transporter), member 1 | SLC14A1 | −2.14 | NM_015865.1 | transport |
| SRY (sex determining region Y)-box 4 | SOX4 | −2.14 | AI989477 | transcription factor |
| tribbles homolog 2 | TRB2 | −2.14 | NM_021643.1 | metabolism |
| chromosome 20 open reading frame 42 | C20orf42 | −2.19 | NM_017671.1 | – |
| dapper homolog 1, antagonist of beta-catenin (xenopus) | DACT1 | −2.19 | NM_016651.2 | nuclear |
| ectodermal-neural cortex | ENC1 | 2.24 | AF010314.1 | protein binding |
| keratin 23 | KRT23 | −2.24 | NM_015515.1 | – |
| deiodinase, iodothyronine, type II | DIO2 | −2.29 | U53506.1 | metabolism |
| plasminogen activator, urokinase | PLAU | −2.29 | NM_002658.1 | metabolism |
| NY-REN-7 antigen | NY-REN-7 | 2.34 | AL117630.1 | – |
| stanniocalcin 1 | STC1 | −2.40 | U46768.1 | signal transduction |
| carbonic anhydrase II | CA2 | −2.45 | M36532.1 | metabolism |
| G protein-coupled receptor 17 | GPR17 | −2.45 | NM_005291.1 | signal transduction |
| high mobility group AT-hook 1 | HMGA1 | 2.45 | AF176039.1 | transcription |
| Ras-induced senescence 1 | RIS1 | −2.45 | BF062629 | – |
| trefoil factor 1 | TFF1 | −2.45 | NM_003225.1 | growth factor |
| WNT1 inducible signaling pathway protein 2 | WISP2 | −2.45 | NM_003881.1 | signal transduction |
| aquaporin 3 | AQP3 | −2.51 | AB001325 | transport |
| SRY (sex determining region Y)-box 9 | SOX9 | −2.51 | NM_000346.1 | transcription |
| bradykinin receptor B1 | BDKRB1 | −2.57 | NM_000710.1 | signal transduction |
| ephrin-B2 | EFNB2 | −2.57 | U16797.1 | signal transduction |
| gap junction protein, alpha 4, 37kDa (connexin 37) | GJA4 | −2.57 | NM_002060.1 | transport |
| myristoylated alanine-rich protein kinase C substrate | MARCKS | −2.88 | AW163148 | structural protein |
| tumor necrosis factor receptor superfamily, member 11b (osteoprotegerin) | TNFRSF11B | −2.88 | NM_002546.1 | signal transduction |
| small proline-rich protein 2B | SPRR2B | 2.95 | NM_006945.1 | structural protein |
| chromogranin A (parathyroid secretory protein 1) | CHGA | −3.02 | NM_001275.2 | transport |
| Homo sapiens non-functional folate binding protein (HSAF000381), mRNA | – | 3.16 | NM_013307.1 | – |
| acid phosphatase, prostate | ACPP | −3.31 | NM_001099.2 | metabolism |
| integrin, beta 3 | ITGB3 | −3.47 | M35999.1 | cell adhesion |
| platelet-derived growth factor beta polypeptide | PDGFB | −3.47 | NM_002608.1 | growth factor |
| SRY (sex determining region Y)-box 11 | SOX11 | −3.72 | AB028641.1 | transcription factor |
| cysteine knot superfamily 1, BMP antagonist 1 | CKTSF1B1 | −3.89 | AF154054.1 | – |
| ribosomal protein S20 | RPS20 | −6.17 | AF113008.1 | protein biosynthesis |
| ribosomal protein L27a | RPL27A | −7.59 | BE737027 | protein biosynthesis |
Gene transcripts regulated (≥2-fold) by progesterone alone in late proliferative phase explants when compared to the vehicle-treated controls. Data are presented as fold changes. The genes in bold were not found to be modulated by 17β-oestradiol and progesterone (17β-E2+P).
The response of menstrual phase endometrium to 17β-E2+P was less pronounced than that of late proliferative phase endometrium. Treatment of menstrual phase endometrial tissue with 17β-E2+P up-regulated (≥2-fold) the expression of only 38 gene transcripts and down-regulated (≥2-fold) the expression of 79 gene transcripts when compared to the control sample (vehicle) (Table 4).
Table 4.
Genes affected by 17β-oestradiol and progesterone (17β−E2+P) in explants of menstrual phase endometrium.
| Gene | Gene Symbol | fold change | Accession # | function |
|---|---|---|---|---|
| secretoglobin, family 1D, member 2 | SCGB1D2 | 60.26 | NM_006551.2 | extracellular matrix |
| alkaline phosphatase, placental (Regan isozyme) | ALPP | 10.00 | NM_001632.2 | metabolism |
| hypothetical protein FLJ10847 | FLJ10847 | 7.08 | NM_018242.1 | transport |
| secretoglobin, family 2A, member 1 | SCGB2A1 | 6.92 | NM_002407.1 | hormone binding |
| secretoglobin, family 2A, member 2 | SCGB2A2 | 6.03 | NM_002411.1 | hormone binding |
| trefoil factor 1 | TFF1 | 5.13 | NM_003225.1 | growth factor |
| cytochrome P450, family 26, subfamily A, polypeptide 1 | CYP26A1 | 4.68 | NM_000783.1 | transport |
| carbohydrate (N-acetylglucosamine 6-O) sulfotransferase 7 | CHST7 | 4.57 | NM_019886.1 | metabolism |
| hypothetical protein FLJ10640 | FLJ10640 | 3.47 | NM_024703.1 | metabolism |
| hydroxysteroid (17-beta) dehydrogenase 2 | HSD17B2 | 3.39 | NM_002153.1 | metabolism |
| paired box gene 5 (B-cell lineage specific activator protein) | PAX5 | 3.31 | NM_016734.1 | transcription factor |
| apolipoprotein D | APOD | 3.09 | NM_001647.1 | transport |
| solute carrier family 7 (cationic amino acid transporter, y+ system), member 8 | SLC7A8 | 2.75 | NM_012244.1 | transport |
| DNA segment on chromosome 4 (unique) 234 expressed sequence | D4S234E | 2.69 | NM_014392.1 | nuclear |
| GREB1 protein | GREB1 | 2.69 | NM_014668.1 | – |
| anthrax toxin receptor 1 | ANTXR1 | 2.63 | NM_018153.1 | membrane protein |
| histone 1, H2bd | HIST1H2BD | 2.63 | AL353759 | DNA binding |
| prostaglandin-endoperoxide synthase 2 | PTGS2 | 2.63 | NM_000963.1 | metabolism |
| heat shock 70kDa protein 6 (HSP70B’) | HSPA6 | 2.57 | NM_002155.1 | metabolism |
| cyclin A1 | CCNA1 | 2.45 | NM_003914.1 | cell growth |
| asparaginase like 1 | ASRGL1 | 2.40 | NM_025080.1 | metabolism |
| apolipoprotein B mRNA editing enzyme, catalytic polypeptide-like 3B | APOBEC3B | 2.34 | NM_004900.1 | metabolism |
| hypothetical protein FLJ20152 | FLJ20152 | 2.34 | AI816291 | – |
| histone 1, H2bh | HIST1H2BH | 2.34 | NM_003524.1 | DNA binding |
| Homo sapiens mRNA; cDNA DKFZp564G112 | – | 2.24 | AA053967 | – |
| crystallin, alpha B | CRYAB | 2.19 | AF007162.1 | structural protein |
| colony stimulating factor 3 (granulocyte) | CSF3 | 2.19 | NM_000759.1 | signal transduction |
| histone 1, H1c | HIST1H1C | 2.19 | BC002649.1 | DNA binding |
| insulin-like growth factor binding protein 1 | IGFBP1 | 2.19 | NM_000596.1 | signal transduction |
| serine (or cysteine) proteinase inhibitor, clade A, member 3 | SERPINA3 | 2.19 | NM_001085.2 | immune respons |
| apolipoprotein M | APOM | 2.14 | NM_019101.1 | transport |
| piggyBac transposable element derived 5 | PGBD5 | 2.14 | NM_024554.1 | – |
| trefoil factor 3 (intestinal) | TFF3 | 2.14 | NM_003226.1 | immune respons |
| histone 1, H2bi | HIST1H2BI | 2.04 | NM_003525.1 | DNA binding |
| H2B histone family, member S | H2BFS | 2.00 | NM_017445.1 | DNA binding |
| putative chemokine receptor | HM74 | 2.00 | NM_006018.1 | signal transduction |
| metallothionein 1X | MT1X | 2.00 | NM_002450.1 | transport |
| TUWD12 | TUWD12 | 2.00 | NM_003774.2 | – |
| hyaluronan binding protein 2 | HABP2 | −2.00 | NM_004132.1 | metabolism |
| interleukin 2 receptor, beta | IL2RB | −2.00 | NM_000878.1 | immune respons |
| myosin, light polypeptide kinase | MYLK | −2.00 | NM_005965.1 | signal transduction |
| SAM and SH3 domain containing 1 | SASH1 | −2.00 | AK025495.1 | cell growth |
| transglutaminase 2 | TGM2 | −2.00 | BC003551.1 | metabolism |
| adipose specific 2 | APM2 | −2.04 | NM_006829.1 | – |
| Microfibril-associated glycoprotein-2 | MAGP2 | −2.04 | AW665892 | extracellular matrix |
| 3-phosphoinositide dependent protein kinase-1 | PDPK1 | −2.04 | NM_002613.1 | signal transduction |
| polymerase (RNA) II (DNA directed) polypeptide J, 13.3kDa | POLR2J | −2.04 | AI738591 | DNA binding |
| preferentially expressed antigen in melanoma | PRAME | −2.04 | NM_006115.1 | – |
| transmembrane protein 5 | TMEM5 | −2.04 | BF224146 | membrane protein |
| leucine-rich repeat-containing 5 | LRRC5 | −2.09 | NM_018103.1 | – |
| parathyroid hormone receptor 2 | PTHR2 | −2.09 | NM_005048.1 | signal transduction |
| retinoblastoma binding protein 6 | RBBP6 | −2.09 | NM_006910.1 | cell growth |
| cadherin 6, type 2, K-cadherin (fetal kidney) | CDH6 | −2.14 | AU151483 | cell adhesion |
| v-myc myelocytomatosis viral related oncogene, neuroblastoma derived (avian) | MYCN | −2.14 | BC002712.1 | transcription factor |
| SRY (sex determining region Y)-box 4 | SOX4 | −2.14 | AI989477 | transcription |
| zinc finger, BED domain containing 2 | ZBED2 | −2.14 | NM_024508.1 | DNA binding |
| ATP-binding cassette, sub-family C (CFTR/MRP), member 3 | ABCC3 | −2.19 | AF009670.1 | transport |
| hypothetical protein LOC339290 | LOC339290 | −2.19 | H49382 | – |
| hypothetical protein MGC29643 | MGC29643 | −2.19 | AL567376 | – |
| transcription factor 4 | TCF4 | −2.19 | AU118026 | transcription factor |
| nudix (nucleoside diphosphate linked moiety X)-type motif 6 | NUDT6 | −2.24 | NM_007083.1 | growth factor |
| ribosomal protein S6 kinase, 90kDa, polypeptide 5 | RPS6KA5 | −2.24 | AF074393.1 | metabolism |
| heme oxygenase (decycling) 1 | HMOX1 | −2.29 | NM_002133.1 | metabolism |
| killer cell lectin-like receptor subfamily B, member 1 | KLRB1 | −2.29 | NM_002258.1 | signal transduction |
| PTPRF interacting protein, binding protein 2 (liprin beta 2) | PPFIBP2 | −2.29 | AI692180 | DNA binding |
| ubiquitin D | UBD | −2.29 | NM_006398.1 | – |
| laminin, alpha 3 | LAMA3 | −2.34 | NM_000227.1 | structural protein |
| ribonucleotide reductase M2 polypeptide | RRM2 | −2.34 | BE966236 | metabolism |
| Rho guanine nucleotide exchange factor (GEF) 17 | ARHGEF17 | −2.40 | NM_014786.1 | – |
| N-myristoyltransferase 1 | NMT1 | −2.40 | AI570834 | metabolism |
| Homo sapiens cDNA: FLJ22812 fis, clone KAIA2955 | – | −2.45 | AK026465.1 | – |
| solute carrier family 16 (monocarboxylic acid transporters), member 6 | SLC16A6 | −2.45 | NM_004694.1 | transport |
| spondin 1, (f-spondin) extracellular matrix protein | SPON1 | −2.45 | AI885290 | extracellular matrix |
| ATP synthase, H+ transporting, mitochondrial F0 complex, subunit s (factor B) | ATP5S | −2.51 | NM_015684.1 | – |
| chemokine (C-C motif) ligand 5 | CCL5 | −2.51 | M21121 | signal transduction |
| CD96 antigen | CD96 | −2.51 | NM_005816.1 | cell adhesion |
| growth associated protein 43 | GAP43 | −2.51 | NM_002045.1 | cell growth |
| histone H2A.F/Z variant | H2AV | −2.51 | BF343852 | DNA binding |
| tumor necrosis factor receptor superfamily, member 4 | TNFRSF4 | −2.51 | AJ277151 | immune respons |
| chemokine (C motif) ligand 1 | XCL1 | −2.57 | U23772.1 | signal transduction |
| Homo sapiens transcribed sequences | – | −2.63 | BE045982 | – |
| C-terminal binding protein 1 | CTBP1 | −2.63 | AA053830 | metabolism |
| fibroblast growth factor 9 (glia-activating factor) | FGF9 | −2.63 | NM_002010.1 | growth factor |
| latexin protein | LXN | −2.63 | NM_020169.1 | – |
| protocadherin gamma subfamily C, 3 | PCDHGC3 | −2.63 | AB002325.1 | transport |
| cathepsin W (lymphopain) | CTSW | −2.75 | NM_001335.1 | metabolism |
| dual-specificity tyrosine-(Y)-phosphorylation regulated kinase 2 | DYRK2 | −2.75 | NM_006482.1 | metabolism |
| integrin, beta 6 | ITGB6 | −2.75 | NM_000888.3 | signal transduction |
| hypothetical protein LOC284266 | LOC284266 | −2.75 | AK025833.1 | – |
| platelet-derived growth factor alpha polypeptide | PDGFA | −2.75 | X03795.1 | growth factor |
| chromosome 14 open reading frame 117 | C14orf117 | −2.82 | NM_018678.1 | – |
| chromosome 20 open reading frame 42 | C20orf42 | −2.82 | NM_017671.1 | – |
| insulin-like growth factor binding protein 3 | IGFBP3 | −2.82 | BF340228 | signal transduction |
| chloride intracellular channel 3 | CLIC3 | −2.88 | NM_004669.1 | signal transduction |
| hypothetical protein FLJ11082 | FLJ11082 | −2.88 | NM_018317.1 | – |
| glutathione S-transferase theta 1 | GSTT1 | −2.88 | NM_000853.1 | metabolism |
| B/K protein | LOC51760 | −2.95 | NM_016524.1 | transport |
| retinoic acid receptor responder (tazarotene induced) 1 | RARRES1 | −2.95 | AI669229 | cell growth |
| Homo sapiens, clone IMAGE:4866926, mRNA | – | −3.09 | AA631242 | – |
| chemokine (C-X-C motif) ligand 14 | CXCL14 | −3.09 | NM_004887.1 | signal transduction |
| chemokine (C motif) ligand 2 | XCL2 | −3.09 | NM_003175.1 | signal transduction |
| cytidine deaminase | CDA | −3.16 | NM_001785.1 | metabolism |
| erythrocyte membrane protein band 4.1 like 4A | EPB41L4A | −3.39 | NM_022140.1 | structural protein |
| zinc finger protein 426 | ZNF426 | −3.39 | NM_024106.1 | transcription factor |
| regulator of G-protein signalling 5 | RGS5 | −3.63 | AI183997 | signal transduction |
| KIAA0924 protein | KIAA0924 | −3.72 | NM_014897.1 | nuclear |
| serine (or cysteine) proteinase inhibitor, clade B (ovalbumin), member 5 | SERPINB5 | −4.07 | NM_002639.1 | cell adhesion |
| killer cell lectin-like receptor subfamily C, member 3 | KLRC3 | −4.17 | NM_002260.2 | immune response |
| calcium channel, voltage-dependent, alpha 1G subunit | CACNA1G | −4.27 | NM_018896.1 | transport |
| protein phosphatase 1, regulatory (inhibitor) subunit 16B | PPP1R16B | −4.47 | AB020630 | signal transduction |
| Homo sapiens mRNA; cDNA DKFZp564N1116 | – | −4.68 | BF344237 | – |
| integral membrane protein 2A | ITM2A | −4.79 | NM_004867.1 | membrane protein |
| phosphoribosylformylglycinamidine synthase (FGAR amidotransferase) | PFAS | −4.90 | AL044326 | metabolism |
| major histocompatibility complex, class II, DR beta 3 | HLA-DRB3 | −5.13 | BC005312.1 | immune response |
| immunoglobulin lambda joining 3 | IGLJ3 | −5.62 | X57812.1 | – |
| fibroblast growth factor 18 | FGF18 | −6.92 | BC006245.1 | growth factor |
| cystic fibrosis transmembrane conductance regulator, ATP-binding cassette | CFTR | −8.32 | NM_000492.2 | transport |
Gene transcripts regulated (≥2-fold) by 17β-E2+P in menstrual phase explants when compared to vehicle-treated controls. Data are presented as fold changes.
Almost all genes modulated by 17β-E2+P in late proliferative phase endometrium were specific for that phase of the cycle. Of the 110 up-regulated (≥2- fold) gene transcripts, 100 were expressed in late proliferative phase explants and not menstrual phase explants; of these, 10 gene transcripts were documented to be up-regulated during the window of implantation (Table 5). Of the 107 down-regulated (≥2-fold) gene transcripts, 102 were selective for late proliferative phase explants; of these, 7 genes were documented to be down-regulated during the implantation window (Table 5). The genes regulated by 17β-E2+P in both menstrual and late proliferative phase explants are presented in Table 6.
Table 5.
Genes affected by 17β-E2+P and reported to be altered in the implantation window.
| Gene | Symbol | fold change | Accession # | Kao et al. | Riesewijk et al. | Carson et al. |
|---|---|---|---|---|---|---|
| dickkopf homolog 1 | DKK1 | 6.03 | NM_012242.1 | 12.1 | 7 | 12.6 |
| thrombomodulin | THBD | 3.24 | NM_000361.1 | 10 | ||
| fibrinogen-like 2 | FGL2 | 2.88 | NM_006682.1 | 5 | ||
| monoamine oxidase A | MAOA | 2.88 | NM_000240.1 | 7.5 | 15 | |
| retinol binding protein 4, plasma | RBP4 | 2.88 | NM_006744.2 | 6 | ||
| dipeptidylpeptidase 4 | DPP4 | 2.57 | M80536.1 | 15 | ||
| nuclear factor I/B | NFIB | 2.57 | AI186739 | 10 | ||
| H.sapiens mRNA for interleukin-15 | – | 2.24 | Y09908.1 | 3.7 | 3 | 2.2 |
| gastrin | GAS | 2.19 | NM_000805.2 | 11 | ||
| KIAA0367 protein | KIAA0367 | 2.04 | AL138349 | 4 | ||
| coagulation factor XIII, A1 polypeptide | F13A1 | −2.00 | NM_000129.2 | −4.1 | ||
| microfibrillar-associated protein 2 | MFAP2 | −2.40 | NM_017459.1 | − | ||
| transforming growth factor, beta 3 | TGFB3 | −2.40 | J03241.1 | −2.44 | ||
| gap junction protein, alpha 4, 37kDa (connexin 37) | GJA4 | −2.95 | NM_002060.1 | −20 | ||
| myristoylated alanine-rich protein kinase C substrate | MARCKS | −3.09 | M68956.1 | −2.2 | ||
| matrix metalloproteinase 11 (stromelysin 3) | MMP11 | −3.31 | AI761713 | −10 | ||
| deiodinase, iodothyronine, type II | DIO2 | −3.47 | U53506.1 | −2.4 |
Table 6.
Genes affected by 17β-E2+P in explants of both menstrual and late proliferative phase endometrium.
| Gene | Gene Symbol | fold change M | fold change LP | Accession # | Function |
|---|---|---|---|---|---|
| alkaline phosphatase, placental (Regan isozyme) | ALPP | 10.00 | 4.79 | NM_001632.2 | metabolism |
| apolipoprotein D | APOD | 3.09 | 4.90 | NM_001647.1 | transport |
| carbohydrate (N-acetylglucosamine 6-O) sulfotransferase 7 | CHST7 | 4.57 | 7.08 | NM_019886.1 | metabolism |
| cytochrome P450, family 26, subfamily A, polypeptide 1 | CYP26A1 | 4.68 | 33.11 | NM_000783.1 | transport |
| GREB1 protein | GREB1 | 2.69 | 2.24 | NM_014668.1 | unknown |
| insulin-like growth factor binding protein 1 | IGFBP1 | 2.19 | 2.45 | NM_000596.1 | signal transduction |
| secretoglobin, family 1D, member 2 | SCGB1D2 | 60.26 | 10.00 | NM_006551.2 | unknown |
| secretoglobin, family 2A, member 1 | SCGB2A1 | 6.92 | 2.63 | NM_002407.1 | signal transduction |
| solute carrier family 7 (cationic amino acid transporter, y+ system), member 8 | SLC7A8 | 2.75 | 4.37 | NM_012244.1 | transport |
| chromosome 20 open reading frame 42 | C20orf42 | −2.82 | −2.82 | NM_017671.1 | unknown |
| cystic fibrosis transmembrane conductance regulator | CFTR | −8.32 | −4.07 | NM_000492.2 | transport |
| hypothetical protein FLJ11082 | FLJ11082 | −2.88 | −2.04 | NM_018317.1 | unknown |
| integrin, beta 6 | ITGB6 | 2.75 | −2.95 | NM_000888.3 | cell adhesion |
| latexin protein | LXN | −2.63 | −2.51 | NM_020169.1 | unknown |
Gene transcripts regulated (≥2-fold) by 17∇-oestradiol and progesterone (17β-E2+P) in both menstrual (M) and late proliferative (LP) phase explants when compared to their respective vehicle-treated controls. Data are presented as fold changes.
Ingenuity Pathways Analysis. Ingenuity Pathways Analysis revealed various significant networks of interconnected focus genes after treatment with 17β-E2+P. In late proliferative phase endometrium, five highly significant networks were identified. Network 1 connected nodes IL1B, PLAU, MMP1, MMP3, MMP7, MMP9, SERPINE1 and EDN1; network 2 connected IL8, MMP14, FGF2, PDGFB, ITGB3, PDGFRA, PDGFRB, PTGS2 and EGR1; network 3 related TGFβ2, TGFβ3, INHBA, PTHLH, JUN, SMAD3 and SMAD7; network 4 linked IGF1, TNFSF11 and HOXA9; and network 5 coupled ICAM1, CXCL10, IL15, SOCS1, RARα and ARNT2. Network 1 is illustrated in Figure 3.
Figure 3.
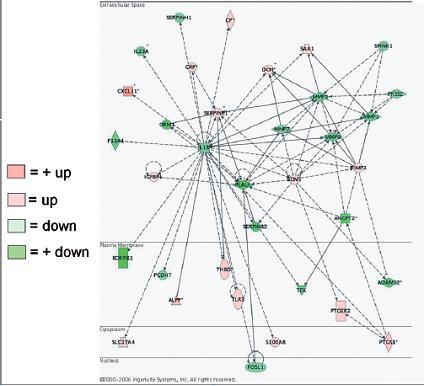
Example of a highly significant network identified in the gene expression profile of late proliferative phase endometrium treated with 17β-oestradiol and progesterone (17β-E2+P) as determined by the Ingenuity Pathways Analysis program. Green indicates down=regulated genes, and pink indicates up-regulated genes.
In contrast, in menstrual phase endometrium only two highly significant networks were extracted from the data. One network connected CCL5, TNFS11, INTGB3, MAPK8 and ESR1. The second network linked IFGBP3, TGFβ2, FGF2, HGF, PDGFA, MMP9, PTGS2, RARβ and EGR1. The latter network is presented in Figure 2.
Discussion
Previous work in our laboratory has shown that explant cultures of human endometrial tissue are biologically relevant in vitro models to investigate oestrogen regulation of gene expression and proliferation [12, 16]. With regard to progestins, it has been shown that tissue cultures of human endometrium are also responsive, as evidenced by the suppressive effects on the production and activation of MMPs [12–14]. The present study was designed to gain more insight into the responses of human endometrium to P with regard to gene expression and the influence of 17β-E2. The results show that in explant cultures of human endometrium, the expression of genes that have been implicated in the process of embryo implantation can be modulated by 17β-E2 and P.
Figure 4.
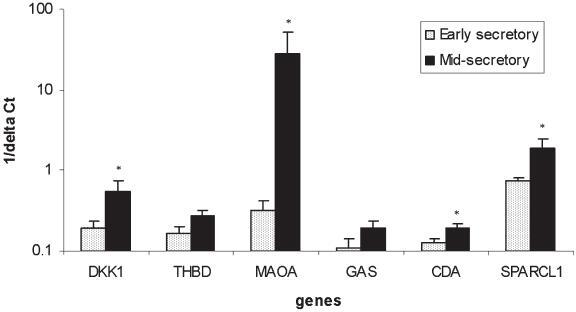
Relative expression levels of gene transcripts for DKK1, THBD, MAOA, GAS, CDA and SPARCL1 in early secretory (n=7) and mid-secretory (n=8) endometrium, which represent endometrial tissues exposed to low (pre-implantation window) and high (implantation window) progesterone concentrations, respectively (*p<0.05).
The number of gene transcripts regulated by P in late proliferative phase explants was almost twice the number regulated in menstrual phase explants, indicating that oestrogen priming sensitizes the endometrium for P regulation, most likely by induction of P receptor gene expression [16]. In addition, most of these genes were specifically modulated in the late proliferative phase endometrium. Of these genes (n=100), at least 17 were previously described to be regulated in the implantation window (Table 5) [2, 20, 21]. Three examples of such genes areDKK1, MAOA and SPARCL1. Regulation of expression by 17β-E2+P and P alone was confirmed with real-time PCR in both explant cultures and endometrium biopsy specimens collected during the implantation window and ES phase. These findings demonstrate that the expression of genes associated with the implantation window can be modulated in explant cultures of human endometrium and that for most of these genes, prolonged in vivo exposure to 17β-E2 is required for adequate P regulation. These findings also support the hypothesis that variations in the duration of 17β-E2 priming can affect the response of the endometrium to P and therefore the subsequent implantation process [11, 22].
The number of implantation-associated gene transcripts, however, was rather low. This could be because the culturing of explants alters the physiology of the tissue and therefore its steroid responsiveness or because, as shown for prolactin and IGFBP1, in some cases prolonged exposure to P is required for genes to respond [23]; the latter finding is supported by a report from Kao and coworkers showing that many genes up-regulated in the implantation window are not yet regulated in ES endometrium, at which time the endometrium has been exposed to P for only a short time [21]. Explant cultures are therefore appropriate models to study immediate responses of human endometrium to oestrogens and progestins ex vivo but do not allow investigation of the entire spectrum of implantation-associated genes.
The low number of implantation-related genes identified may also be a result of the relatively low number of samples used for the initial microarray hybridizations, which increases the likelihood of missing relevant genes and the chance of generating false positives. At the time the microarray experiments were performed, we opted to carry out a limited number of array hybridizations so that we could apply rigorous statistical procedures and perform extensive validation of selected genes for both the array samples and samples from additional independent experiments. Rockett and Hellmann asked the questions: how many genes should we pick for validation, and which genes should we pick? The authors argue that genes can be selected to ensure successful confirmation, i.e. by selecting genes that have changed more than 4-fold [24] or by selecting genes that have been reported to be changed in similar models or conditions [25].We selected six genes primarily based on the fact that their expression is altered during the implantation window. In addition, we selected two genes that have not yet been reported in the endometrium. With the exception of DKK1 (more than 5-fold induction), the expression of the selected genes changed less than 3- fold. We could confirm steroid regulation for four of eight genes in independent experiments, which justifies our approach.
Rockett and Hellmann also questioned the additive value of corroborating the findings of microarray experiments with alternative means of quantitating the mRNA abundance of a limited number of genes of the array [25]. The vast majority of studies published state that the DNA array data can be corroborated, indicating that the array data are reliable as long as the experimental design and statistical analysis is sound. Even in high-impact journals, studies that have not been validated are being published; Goodman illustrated this by showing that our of 28 microarray papers in Science, Cell and Nature published in 2002, only 11 reported corroborative studies [26]. It is evident that clear standards, such as the guideline Minimal Information about a Microarray Experiment (MIAME), in the confirmatory studies area are necessary [25].
A clear distinction could be made between genes that are regulated by P irrespective of the presence of 17β-E2 and genes for which the expression is clearly influenced by the continuous presence of 17β-E2. Many genes modulated by P alone were similarly modulated in the 17β-E2+P-treated explants (119/161 P-modulated genes), however, 42 of the P-modulated genes were not affected in the 17β-E2+P-treated explants. Also, of the 219 17β-E2+P-modulated genes, 117 were not modulated by treatment with P alone. This clearly indicates that the expression of a subset of genes is sensitive to the continuing presence of 17β-E2. It also indicates that in vivo priming of CD12 and CD13 endometrium is remembered by the tissue in vitro, leading to similar expression patterns for certain genes induced both in the absence and presence of 17β-E2.
A good example of genes for which expression is known to be suppressed by P, but which were only suppressed by P in the presence of 17β-E2, are various members of the MMP family [12–14]. Only the expression of MMP11 was suppressed by P alone; the expression of MMP1, −3, −14 and −27 was only suppressed in the presence of 17β-E2. Similarly, cystic fibrosis transmembrane conductance regulator (CFTR) was suppressed in 17β-E2+P-treated explants but not in P-treated explants, suggesting that continued presence of 17β-E2 is required for the down-regulation of CFTR. This corresponds with the finding that CFTR is highly expressed in the human endometrium around the ovulatory period [27] and is responsive to both 17β-E2 and P.
Some genes were induced by 17β-E2+P in both menstrual and late proliferative phase explants (i.e. alkaline phosphatase, ALPP; monoamine oxidase, MAOA; secretoglobin family 1, member D, SCGB1D2; CFTR; P450 cytochrome family 26 subfamily A, CYP26A), indicating that the expression of these genes does not depend on prolonged in vivo oestrogen priming of the endometrium. Aparticularly interesting observation in this regard is the upregulation of expression of the CYP26A gene in both menstrual and late proliferative phase endometrium by 17β-E2+P and, to a lesser extent, by P alone. This enzyme is responsible for the metabolism of the active retinoid metabolite all-trans retinoic acid. The importance of controlling retinoid levels in the uterus is illustrated by the fact that vitamin A deficiency in women, nonhuman primates and laboratory animals is associated with pregnancy failure and developmental defects [28–30], whereas excess vitamin A levels are detrimental to blastocyst development [31] and the decidualization process [32].
Uterine vitamin A levels in women increase in the presence of oestrogens [33, 34], most likely as the result of up-regulation of retinaldehyde dehydrogenase (RALDH2), a critical enzyme in retinoic acid (RA) biosynthesis [35]. Since retinoids are morphogens and essential for epithelial cell growth [36], they may be involved in the regeneration, growth and differentiation of the endometrial epithelium after menstruation. The induction of CYP26A expression by P in the secretory phase most likely serves to inactivate excessive amounts of retinoids.
Databases can be explored with several different bioinformatics tools. We have employed the Ingenuity Pathways Analysis (IPA) program, which has the added advantage that it is an evidence-based data mining tool. In contrast to most other bioinformatics tools, which annotate certain functions to gene products, the IPA program includes any reported interaction between two genes, whether it involves regulation of gene or protein expression, protein-protein interactions or enzymatic conversion (for example, phosphorylation). It is therefore a continuously growing database and, by the nature of its development, not complete. It is not unusual that the most affected genes are not presented in the networks. The networks present groups of genes that have a proven biological relationship. The nodes in these highly significant networks presumably represent genes that have important modulatory roles. When interpreting the data, one has to realize that the IPA database is biased in that certain genes have received more attention than others and therefore have a higher likelihood to be included in a network. However, the continuously growing database will allow reanalysis of the data in the future, which may reveal novel unidentified relationships between genes or groups of genes.
The significant suppressive actions of P on nodes representing immunomodulators were immediately apparent; these included IL-1β, IL-8, COX2, the chemokine CCL5 and members of the TGF-β super-family (TGF-β2 and -3, INHBA and their signalling molecules SMAD2 and -3). At the end of the secretory phase, a rapid influx of leukocytes, consisting mostly of NK cells and macrophages, into the endometrium can be observed; this is believed to be the result of the disappearance of P suppression on key inflammatory mediators [37, 38]. Apparently, these immunosuppressive actions of P can at least partly be mimicked in the explant model by short-term incubation with 17β-E2 and P.
One of the few nodes present in highly significant networks identified by the IPA program in both 17β-E2- and P-treated menstrual and late proliferative phase endometrium was FGF2 or basic fibroblast growth factor (bFGF). FGF2 expression is suppressed by P. The significance of this finding is illustrated by the fact that FGF2 inhibits the decidualization process in human endometrial stromal cells [39] and should therefore be controlled by P during the secretory phase. FGF2 is an important mitogenic and angiogenic factor that is expressed as different isoforms synthesized through the alternative use of translation initiation codons [40]. In human endometrium, only the smallest 18-kD isoform is present [41]. It is located predominantly in the cytoplasm and is stored in the extracellular matrix [42]. FGF2 is released mostly during menstruation and the early proliferative phase and is expressed in blood vessels throughout the menstrual cycle [41, 43]. The FGF receptors, however, are not expressed in blood vessels except during the MS (FGFR2) and late secretory phases (FGFR1 and FGFR2). Blood vessels may therefore not be the main target of FGF2. FGF2 receptors are predominantly found in the epithelial compartment [44], suggesting that FGF2 is involved in the control of regeneration and growth of epithelial cells in a paracrine fashion. FGF2 is known to regulate proliferation of various cell populations of the bone marrow [44], which were shown to be of eminent importance for regeneration of the human endometrium [45].
In conclusion, explant culture of human endometrium is a biologically relevant in vitro model system that allows the investigation of steroid regulation of gene expression in the tissue context. Regulation of the expression of several genes associated with embryo implantation can be mimicked in vitro. We showed that expression of thrombomodulin, monoamine oxidase A and SPARCL1 is regulated by progestins. Only a subset of implantation-associated genes was modulated in the short-term explant cultures; however, we clearly showed that we can distinguish genes that require continuous presence of 17β-E2 from those that depend on P only. Therefore, 17β-E2 selectively primes implantation-related genes for the effects of P.
Footnotes
H. Dassen, C. Punyadeera: These authors contributed equally.
Received 18 December 2006; received after revision 6 February 2007; accepted 8 March 2007
References
- 1.Ghosh D., Sengupta J. Another look at the issue of peri-implantation oestrogen. Hum. Reprod. 1995;10:1–2. doi: 10.1093/humrep/10.1.1. [DOI] [PubMed] [Google Scholar]
- 2.Riesewijk A., Martin J., van Os R., Horcajadas J. A., Polman J., Pellicer A., Mosselman S., Simon C. Gene expression profiling of human endometrial receptivity on days LH+2 versus LH+7 by microarray technology. Mol. Hum. Reprod. 2003;9:253–264. doi: 10.1093/molehr/gag037. [DOI] [PubMed] [Google Scholar]
- 3.Giudice L. C., Telles T. L., Lobo S., Kao L. The molecular basis for implantation failure in endometriosis: on the road to discovery. Ann. NY Acad. Sci. 2002;955:252–264. doi: 10.1111/j.1749-6632.2002.tb02786.x. [DOI] [PubMed] [Google Scholar]
- 4.Lessey B. A. Two pathways of progesterone action in the human endometrium: implications for implantation and contraception. Steroids. 2003;68:809–815. doi: 10.1016/j.steroids.2003.09.004. [DOI] [PubMed] [Google Scholar]
- 5.Develioglu O. H., Hsiu J. G., Nikas G., Toner J. P., Oehninger S., Jones H. W., Jr. Endometrial estrogen and progesterone receptor and pinopode expression in stimulated cycles of oocyte donors. Fertil. Steril. 1999;71:1040–1047. doi: 10.1016/S0015-0282(99)00137-5. [DOI] [PubMed] [Google Scholar]
- 6.Martin J., Dominguez F., Avila S. J., Castrillo L., Remohi J., Pellicer A., Simon C. Human endometrial receptivity: gene regulation. J. Reprod. Immunol. 2002;55:131–139. doi: 10.1016/S0165-0378(01)00140-1. [DOI] [PubMed] [Google Scholar]
- 7.Navot D., Anderson T. L., Droesch K., Scott R. T., Kreiner D., Rosenwaks Z. Hormonal manipulation of endometrial maturation. J. Clin. Endocrinol. Metab. 1989;68:801–807. doi: 10.1210/jcem-68-4-801. [DOI] [PubMed] [Google Scholar]
- 8.Brosens J. J., Hayashi N., White J. O. Progesterone receptor regulates decidual prolactin expression in differentiating human endometrial stromal cells. Endocrinology. 1999;140:4809–4820. doi: 10.1210/en.140.10.4809. [DOI] [PubMed] [Google Scholar]
- 9.Satyaswaroop P. G., Tabibzadeh S. Progestin regulation of human endometrial function. Hum. Reprod. 2000;15(Suppl1):74–80. doi: 10.1093/humrep/15.suppl_1.74. [DOI] [PubMed] [Google Scholar]
- 10.Jung H., Roh H. K. The effects of E2 supplementation from the early proliferative phase to the late secretory phase of the endometrium in hMG-stimulated IVF-ET. J. Assist. Reprod. Genet. 2000;17:28–33. doi: 10.1023/A:1009445913156. [DOI] [PMC free article] [PubMed] [Google Scholar]
- 11.Younis J. S., Mordel N., Lewin A., Simon A., Schenker J. G., Laufer N. Artificial endometrial preparation for oocyte donation: the effect of estrogen stimulation on clinical outcome. J. Assist. Reprod. Genet. 1992;9:222–227. doi: 10.1007/BF01203817. [DOI] [PubMed] [Google Scholar]
- 12.Punyadeera C., Dassen H., Klomp J., Dunselman G., Kamps R., Dijcks F., Ederveen A., de Goeij A., Groothuis P. Oestrogen-modulated gene expression in the human endometrium. Cell. Mol. Life Sci. 2005;62:239–250. doi: 10.1007/s00018-004-4435-y. [DOI] [PMC free article] [PubMed] [Google Scholar]
- 13.Marbaix E., Donnez J., Courtoy P. J., Eeckhout Y. Progesterone regulates the activity of collagenase and related gelatinases A and B in human endometrial explants. Proc. Natl. Acad. Sci. USA. 1992;89:11789–11793. doi: 10.1073/pnas.89.24.11789. [DOI] [PMC free article] [PubMed] [Google Scholar]
- 14.Markiewicz L., Gurpide E. In vitro evaluation of estrogenic, estrogen antagonistic and progestagenic effects of a steroidal drug (Org OD-14) and its metabolites on human endometrium. J. Steroid Biochem. 1990;35:535–541. doi: 10.1016/0022-4731(90)90196-Y. [DOI] [PubMed] [Google Scholar]
- 15.Noyes R. W., Hertig A. T., Rock J. Dating the endometrial biopsy. Am. J. Obstet. Gynecol. 1975;122:262–263. doi: 10.1016/s0002-9378(16)33500-1. [DOI] [PubMed] [Google Scholar]
- 16.Punyadeera C., Dunselman G., Marbaix E., Kamps R., Galant C., Nap A., Goeij A., Ederveen A., Groothuis P. Triphasic pattern in the ex vivo response of human proliferative phase endometrium to oestrogens. J. Steroid Biochem. Mol. Biol. 2004;92:175–185. doi: 10.1016/j.jsbmb.2004.06.005. [DOI] [PubMed] [Google Scholar]
- 17.Cornet P. B., Picquet C., Lemoine P., Osteen K. G., Bruner-Tran K. L., Tabibzadeh S., Courtoy P. J., Eeckhout Y., Marbaix E., Henriet P. Regulation and function of LEFTY-A/EBAF in the human endometrium. mRNA expression during the menstrual cycle, control by progesterone, and effect on matrix metalloprotineases. J. Biol. Chem. 2002;277:42496–42504. doi: 10.1074/jbc.M201793200. [DOI] [PubMed] [Google Scholar]
- 18.Weng, L. (2003) Data Processing and Analysis Methods in the Rosetta Resolver. 38. Technical report.
- 19.Livak K. J., Schmittgen T. D. Analysis of relative gene expression data using real-time quantitative PCR and the 2(-Delta Delta C(T)) Method. Methods. 2001;25:402–408. doi: 10.1006/meth.2001.1262. [DOI] [PubMed] [Google Scholar]
- 20.Carson D. D., Lagow E., Thathiah A., Al-Shami R., Farach-Carson M. C., Vernon M., Yuan L., Fritz M. A., Lessey B. Changes in gene expression during the early to midluteal (receptive phase) transition in human endometrium detected by high-density microarray screening. Mol. Hum. Reprod. 2002;8:871–879. doi: 10.1093/molehr/8.9.871. [DOI] [PubMed] [Google Scholar]
- 21.Kao L. C., Tulac S., Lobo S., Imani B., Yang J. P., Germeyer A., Osteen K., Taylor R. N., Lessey B. A., Giudice L. C. Global gene profiling in human endometrium during the window of implantation. Endocrinology. 2002;143:2119–2138. doi: 10.1210/en.143.6.2119. [DOI] [PubMed] [Google Scholar]
- 22.Navot D., Bergh P. Preparation of the human endometrium for implantation. Ann. NY Acad. Sci. 1991;622:212–219. doi: 10.1111/j.1749-6632.1991.tb37864.x. [DOI] [PubMed] [Google Scholar]
- 23.Tseng L., Gao J. G., Chen R., Zhu H. H., Mazella J., Powell D. R. Effect of progestin, antiprogestin, and relaxin on the accumulation of prolactin and insulin-like growth factor-binding protein-1 messenger ribonucleic acid in human endometrial stromal cells. Biol. Reprod. 1992;47:441–450. doi: 10.1095/biolreprod47.3.441. [DOI] [PubMed] [Google Scholar]
- 24.Chuaqui R. F., Bonner R. F., Best C. J., Gillespie J.W., Flaig M. J., Hewitt S. M., Phillips J. L., Krizman D. B., Tangrea M. A., Ahram M., Linehan W. M., Knezevic V., Emmert-Buck M. R. Post-analysis follow-up and validation of microarray experiments. Nat. Genet. 2002;32(Suppl):509–514. doi: 10.1038/ng1034. [DOI] [PubMed] [Google Scholar]
- 25.Rockett J. C., Hellmann G. M. Confirming microarray data—is it really necessary? Genomics. 2004;83:541–549. doi: 10.1016/j.ygeno.2003.09.017. [DOI] [PMC free article] [PubMed] [Google Scholar]
- 26.Goodman N. Microarrays: hazardous to your science. Genome Technol. 2003;32:42–45. [Google Scholar]
- 27.Zheng X. Y., Chen G. A., Wang H. Y. Expression of cystic fibrosis transmembrane conductance regulator in human endometrium. Hum. Reprod. 2004;19:2933–2941. doi: 10.1093/humrep/deh507. [DOI] [PubMed] [Google Scholar]
- 28.Wilson J.G., Roth C. B., Warkany J. An analysis of the syndrome of malformations induced by maternal vitamin A deficiency. Effects of restoration of vitamin A at various times during gestation. Am. J. Anat. 1953;92:189–217. doi: 10.1002/aja.1000920202. [DOI] [PubMed] [Google Scholar]
- 29.Simsek M., Naziroglu M., Simsek H., Cay M., Aksakal M., Kumru S. Blood plasma levels of lipoperoxides, glutathione peroxidase, beta carotene, vitamin A and E in women with habitual abortion. Cell Biochem. Funct. 1998;16:227–231. doi: 10.1002/(SICI)1099-0844(1998120)16:4<227::AID-CBF787>3.0.CO;2-M. [DOI] [PubMed] [Google Scholar]
- 30.O’Toole B. A., Fradkin R., Warkany J., Wilson J. G., Mann G. V. Vitamin A deficiency and reproduction in rhesus monkeys. J. Nutr. 1974;104:1513–1524. doi: 10.1093/jn/104.11.1513. [DOI] [PubMed] [Google Scholar]
- 31.Huang F. J., Shen C. C., Chang S. Y., Wu T. C., Hsuuw Y. D. Retinoic acid decreases the viability of mouse blastocysts in vitro . Hum. Reprod. 2003;18:130–136. doi: 10.1093/humrep/deg018. [DOI] [PubMed] [Google Scholar]
- 32.Brar A. K., Kessler C. A., Meyer A. J., Cedars M. I., Jikihara H. Retinoic acid suppresses in-vitro decidualization of human endometrial stromal cells. Mol. Hum. Reprod. 1996;2:185–193. doi: 10.1093/molehr/2.3.185. [DOI] [PubMed] [Google Scholar]
- 33.Vahlquist A., Johnsson A., Nygren K. G. Vitamin A transporting plasma proteins and female sex hormones. Am. J. Clin. Nutr. 1979;32:1433–1438. doi: 10.1093/ajcn/32.7.1433. [DOI] [PubMed] [Google Scholar]
- 34.Yeung D. L., Chan P. L. Effects of a progestogen and a sequential type oral contraceptive on plasma vitamin A, vitamin E, cholesterol and triglycerides. Am. J. Clin. Nutr. 1975;28:686–691. doi: 10.1093/ajcn/28.7.686. [DOI] [PubMed] [Google Scholar]
- 35.Deng L., Shipley G. L., Loose-Mitchell D. S., Stancel G. M., Broaddus R., Pickar J. H., Davies P. J. Coordinate regulation of the production and signaling of retinoic acid by estrogen in the human endometrium. J. Clin. Endocrinol. Metab. 2003;88:2157–2163. doi: 10.1210/jc.2002-021844. [DOI] [PubMed] [Google Scholar]
- 36.Underwood B. A. Vitamin A in animal and human nutrition. In: Sporn M. B., Roberts A. B., Goodman D. S., editors. The Retinoids. London: Academic Press; 1984. pp. 281–392. [Google Scholar]
- 37.Critchley H. O., Kelly R.W., Brenner R. M., Baird D. T. Antiprogestins as a model for progesterone withdrawal. Steroids. 2003;68:1061–1068. doi: 10.1016/j.steroids.2003.07.001. [DOI] [PubMed] [Google Scholar]
- 38.Flynn L., Byrne B., Carton J., Kelehan P., O’Herlihy C., O’Farrelly C. Menstrual cycle dependent fluctuations in NK and T-lymphocyte subsets from non-pregnant human endometrium. Am. J. Reprod. Immunol. 2000;43:209–217. doi: 10.1111/j.8755-8920.2000.430405.x. [DOI] [PubMed] [Google Scholar]
- 39.Irwin J. C., Utian W. H., Eckert R. L. Sex steroids and growth factors differentially regulate the growth and differentiation of cultured human endometrial stromal cells. Endocrinology. 1991;129:2385–2392. doi: 10.1210/endo-129-5-2385. [DOI] [PubMed] [Google Scholar]
- 40.Florkiewicz R. Z., Sommer A. Human basic fibroblast growth factor gene encodes four polypeptides: three initiate translation from non-AUG codons. Proc. Natl. Acad. Sci. USA. 1989;86:3978–3981. doi: 10.1073/pnas.86.11.3978. [DOI] [PMC free article] [PubMed] [Google Scholar]
- 41.Moller B., Rasmussen C., Lindblom B., Olovsson M. Expression of the angiogenic growth factors VEGF, FGF-2, EGF and their receptors in normal human endometrium during the menstrual cycle. Mol. Hum. Reprod. 2001;7:65–72. doi: 10.1093/molehr/7.1.65. [DOI] [PubMed] [Google Scholar]
- 42.Florkiewicz R. Z., Anchin J., Baird A. The inhibition of fibroblast growth factor-2 export by cardenolides implies a novel function for the catalytic subunit of Na+,K+-ATPase. J. Biol. Chem. 1998;273:544–551. doi: 10.1074/jbc.273.1.544. [DOI] [PubMed] [Google Scholar]
- 43.Sangha R. K., Li X. F., Shams M., Ahmed A. Fibroblast growth factor receptor-1 is a critical component for endometrial remodeling: localization and expression of basic fibroblast growth factor and FGF-R1 in human endometrium during the menstrual cycle and decreased FGF-R1 expression in menorrhagia. Lab. Invest. 1997;77:389–402. [PubMed] [Google Scholar]
- 44.Allouche M., Bikfalvi A. The role of fibroblast growth factor-2 (FGF-2) in hematopoiesis. Prog. Growth Factor Res. 1995;6:35–48. doi: 10.1016/0955-2235(95)00041-0. [DOI] [PubMed] [Google Scholar]
- 45.Taylor H. S. Endometrial cells derived from donor stem cells in bone marrow transplant recipients. JAMA. 2004;292:81–85. doi: 10.1001/jama.292.1.81. [DOI] [PubMed] [Google Scholar]