

Abstract
Genomics and proteomics will improve outcome prediction in cancer and have great potential to help in the discovery of unknown mechanisms of metastasis, ripe for therapeutic exploitation. Current methods of prognosis estimation rely on clinical data, anatomical staging and histopathological features. It is hoped that translational genomic and proteomic research will discriminate more accurately than is possible at present between patients with a good prognosis and those who carry a high risk of recurrence. Rational treatments, targeted to the specific molecular pathways of an individual’s high-risk tumor, are at the core of tailored therapy. The aim of targeted oncology is to select the right patient for the right drug at precisely the right point in their cancer journey. Optical proteomics uses advanced optical imaging technologies to quantify the activity states of and associations between signaling proteins by measuring energy transfer between fluorophores attached to specific proteins. Förster resonance energy transfer (FRET) and fluorescence lifetime imaging microscopy (FLIM) assays are suitable for use in cell line models of cancer, fresh human tissues and formalin-fixed paraffin-embedded tissue (FFPE). In animal models, dynamic deep tissue FLIM/FRET imaging of cancer cells in vivo is now also feasible. Analysis of protein expression and post-translational modifications such as phosphorylation and ubiquitination can be performed in cell lines and are remarkably efficiently in cancer tissue samples using tissue microarrays (TMAs). FRET assays can be performed to quantify protein-protein interactions within FFPE tissue, far beyond the spatial resolution conventionally associated with light or confocal laser microscopy. Multivariate optical parameters can be correlated with disease relapse for individual patients. FRET-FLIM assays allow rapid screening of target modifiers using high content drug screens. Specific protein-protein interactions conferring a poor prognosis identified by high content tissue screening will be perturbed with targeted therapeutics. Future targeted drugs will be identified using high content/throughput drug screens that are based on multivariate proteomic assays. Response to therapy at a molecular level can be monitored using these assays while the patient receives treatment: utilizing re-biopsy tumor tissue samples in the neoadjuvant setting or by examining surrogate tissues. These technologies will prove to be both prognostic of risk for individuals when applied to tumor tissue at first diagnosis and predictive of response to specifically selected targeted anticancer drugs. Advanced optical assays have great potential to be translated into real-life benefit for cancer patients.
Keywords: Imaging, Molecular diagnostics, FRET, FLIM, Personalized medicine, Breast cancer, Biomarker, Tissue microarray, Optical proteomics
Introduction
The majority of cancer-related morbidity and deaths are as a consequence of the dissemination and growth of secondary metastatic tumors [1]. The clinical and molecular heterogeneity of cancer currently presents clinicians with difficult problems when choosing adjuvant treatment for individual patients. Oncologists forecast the likely progression of cancer, yet wish to better predict which patients will respond to therapy. Both cytotoxic chemotherapy and biologically targeted drugs are prescribed for some patients based on existing markers. Nonetheless, tailored anticancer therapy is in its infancy. It must continue to evolve and progress in order to enable rational individualized treatment. Oncology is slowly moving away from empiricism, toward rational personalized cancer treatment.
At initial diagnosis, prognostic markers estimate whether the transition to metastatic disease is likely to occur. Adjuvant systemic chemotherapy aims to eradicate micro-metastases, thus reducing recurrence rates and contributing to surgical cure [2–5]. However the risk of distant relapse cannot be eliminated. Furthermore therapy has associated toxicity [6] and high financial cost. Clinicians need to accurately identify patients at greatest risk of metastasis, in order to appropriately direct chemotherapy and targeted treatments. Adjuvant Online is an open-access web-based tool (www.adjuvantonline.com) that predicts 10-year outcomes for solid tumors with and without systemic therapy [7]. From patient information and tumor characteristics the program calculates a prognostic estimate. Adjuvant online cannot categorize individual patients. Most established estimates of prognosis do not include many characteristics of individual tumor biology, as the vast majority of putative prognostic factors have not been established nor validated in large series. We urgently need cost-effective biomarkers to identify the individual patients at high risk of recurrence and choose the specific therapy to which they are most likely to respond.
Adjuvant cytotoxic chemotherapy improves survival for some patients with solid malignancy, however many of those treated derive no benefit at all. Improved understanding of cancer cell signaling has resulted in therapeutic agents against specific tumor targets. These have revolutionized cancer treatment, most elegantly exemplified by the use of trastuzumab, a humanized monoclonal antibody against the extracellular domain of human epidermal growth factor receptor type 2 (HER2/ErbB2), in patients with invasive breast cancers that overexpress HER2. Despite the myriad of newly designed therapeutics, non-targeted cytotoxic chemotherapy is the mainstay of the adjuvant therapy, rather than a rational approach based on individual tumor biology. This is largely because of difficulties in selecting patients most likely to respond to each drug. As an example, when trastuzumab is given as a single agent for first-line treatment of ErbB2-overexpressing metastatic breast cancer, it is associated only with a 40% objective response rate [8]. For drugs targeting the human epidermal growth factor receptor type 1 (EGFR /HER1/ErbB1), patient selection is even more difficult. Strategies are urgently required to focus targeted therapeutics specifically on the tumors capable of responding, thus sparing patients unnecessary toxicity, and significantly reducing drug costs.
United Kingdom cancer survival rates are inferior to some other European countries, partly resulting from the relatively limited use of new systemic therapies [9]. Expensive targeted drugs place considerable financial burden on any health care system. The majority of patients receiving such drugs do not experience either restrained tumor growth or prolonged survival. The financial burden of targeted therapeutics will continue to rise unless rational-use strategies are developed. In addition to the financial considerations, it is hoped that toxicity could be spared with the use of improved prognostics. Any patient whose tumor receives a good prognosis will not receive unnecessary, potentially toxic treatment. Thus optical proteomics combined with advanced genomics has the potential to revolutionize treatment for the next generation of cancer patients.
Translational science must strive to improve not only the quality and efficacy of the drugs used to combat all cancers, but also design intelligent diagnostics to accurately match the correct drug to the appropriate patient [10]. Efficacious, individualized therapy has the potential to revolutionize cancer care. We present here a range of approaches aimed at improving our understanding of proteomics, exploiting optically based technologies. Such optical techniques are highly desirable for ultimate deployment in a clinical setting. Development of optical technologies to both visualize specific protein expressions and interactions and to quantify them is considered crucial for further progress in individualization of therapy.
Genomics and optical proteomics
The advent of gene expression profiling technology allowed quantification of the expression of multiple genes simultaneously in human tissue samples. The aims of gene expression profiling in cancer are a better system for classifying tumors, a clarification of the origin of these diseases, a more accurate prognostic capacity than was previously available and an improved ability to select appropriate therapy [11]. Despite advances, the identification of genes and molecules associated with escalating incidence of metastases does not necessarily bring progress to understanding of how these events contribute to the process, much less teach us how to frustrate metastasis.
Genomic information alone may thus prove insufficient as a means of identifying tumors with specific changes in the molecular pathways that are predictive of a favorable treatment outcome. In addition to obtaining RNA profiles, the function of the gene product, i.e., the protein, must also be assessed. Although the cause of a disease is frequently an aberration at the genetic level, the functional consequences are mediated via protein networks, with various components of the network undergoing different degrees of activation (usually as a consequence of specific post-translational modifications such as phosphorylation), driving oncogenesis. Following successes in cancer therapy derived from targeting the MDM2-p53 interaction [12–14], the importance of protein-protein interactions is increasingly recognized, both for understanding cell physiology and for developing novel treatments [15].
Validated techniques involving advanced microscopy with high spatial resolution and in vivo imaging capabilities are required to assess and quantitatively measure post-translational modifications and protein-protein interactions, in order to expose the molecular contributors to the process of metastasis. The use of advanced optical molecular techniques to report on protein networks, within both cells and tissues, is termed optical proteomics.1 The optical approaches herein described include the monitoring of Förster resonance energy transfer (FRET) by fluorescence lifetime imaging microscopy (FLIM). This review describes the utility of FRET-FLIM imaging in preclinical models of cancer, as well as its use in cancer patient tissue. Characterizing the activation/modification states of proteins that are responsible for promoting cell migration, as well as the nature and extent of the intermolecular interactions within these protein subnetworks in individual patient tumor samples, should enable better prediction of which patients are most likely to develop metastases. This characterization also has the potential to provide biological information regarding how best to interfere with metastasis and allow future therapeutic blockade of the strengths of the metastatic process and exploitation of the inherent weaknesses.
Recent experience with molecule-targeted therapeutics suggests that the efficacy of such therapies would be improved if we could selectively treat patients on the basis of aberrations in protein function/activity within specific biochemical pathways, rather than simply the level of target antigen expression [16]. FRET-FLIM imaging of protein function and protein-protein complex formation could potentially improve patient selection for targeted therapy, by specifically identifying for each patient whether the targeted pathway is active in a particular tumor sample, thus truly tailoring medicine to each individual.
In the context of proteomics, there are several key functional events that are crucial for a better understanding of how the ~ 23,000 proteins encoded in the human genome are coordinated and regulated. In this article we will focus mainly on two categories of events. First is the formation of protein networks, comprised of protein-protein interactions between direct binding partners rather than through an intermediate bridging protein. The second is a group of further post-translational modification events including protein phosphorylation, glycosylation [17], sulphatation, acetylation and ubiquitinylation [18]. These processes increase the heterogeneity of the proteome, compared to the genome. This diversity is further increased by proteome interactions with the genome. The proteome differs between and within tissues as a function of time, cell cycle and environment.
In the following section, some of the technologies utilized in preclinical and patient-based clinical optical proteomic studies of cancer are outlined.
Cancer tissue banks and tissue microarrays
Cancer tissue and data banks are of crucial importance for large-scale optical proteomic studies. Formalin-fixed paraffin-embedded (FFPE) tissue is the most abundant source of archived tumor material available and has been prospectively collected in many institutions for decades. Thirty-year archives exist from international collaborative studies. Original FFPE donor tissue blocks are used to produce tissue microarrays (TMA, Fig. 1) and are rapidly fixed in formalin prior to paraffin processing. FFPE is not suitable for all biomarkers and so fresh frozen tissue and DNA are also archived. A well-annotated resource with a rich complement of clinical data has great potential in the search for a cancer biomarker.
Fig. 1.
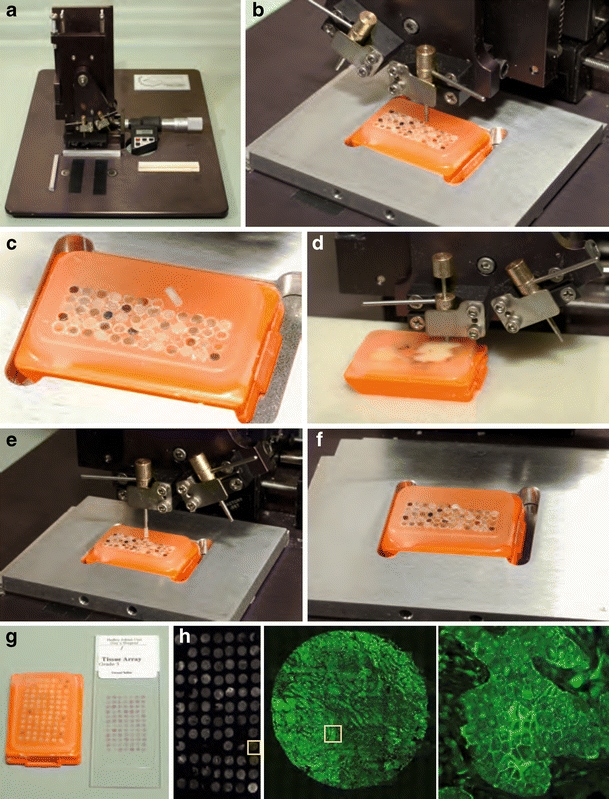
Tissue microarray (TMA) block created using a micro-arrayer in the Guys /KCL Breast Tissue Bank.a The Beecher Microarrayer. b A wax core is cut and c removed from the recipient TMA block. d A smaller bore tissue core is removed from one of multiple donor case original tumor blocks. e The donor tissue core is lowered into the space created in the wax block. f New core in position. g Complete TMA block and one H&E stained TMA section on a glass slide. Each TMA block is sectioned in slices 3–5 mm thick and mounted on charged glass slides. De-waxing of the TMA section is performed for antigen retrieval prior to standard immunohistochemistry or fluorophore-conjugated-antibody staining techniques. (H:left) TMA stained with a Cy2 labeled antibody to ezrin (mAb 2H3, middle) imaged at x10 power and (right) imaged at x40 revealing more detailed membranous ezrin staining
Tissue and data banks must be licensed by the Human Tissue Authority and should maintain and continue to accrue archived cancer material. Tissue, blood and clinical data can only be prospectively collected on patients following informed consent. Complete and verified clinical-pathological data on every patient must be carefully template-linked to each TMA tissue core. The fact that clinical outcome is known for each case is pivotal to tissue and data bank studies. Putative links between a potential biomarker and relapse data can therefore be immediately ascertained. A 2006 review of proteomics related to breast cancer concluded that technologies that use FFPE tumor tissue will have the greatest impact, as FFPE tissue is the most abundant source of cancer tissue, allowing for a well-constructed hypothesis to be tested [19]. Any such biomarker would require validation prior to use on cancer tissue at first diagnosis to delineate individual patient risk profile.
TMA technology was introduced in 1998 as a tissue preserving, high throughput (HTP) technique allowing study of multiple markers in large sample sets. TMA technology provides patient material suitable for evaluating and validating DNA amplification using fluorescence in situ hybridisation (FISH), and protein levels using immunohistochemistry. TMAs provide a cost-effective method for examining multiple biomarkers on a large number of patients, both retrospectively and prospectively. In a large series of cases it is possible to perform multiple assays on consecutive sections without significant depletion of reference tissue resources. TMAs thus facilitate the survey of large numbers of tumors simultaneously, allowing the rapid analysis of hundreds of markers in the same set of specimens [20]. The evidence that TMAs are equivalent to traditional whole tissue specimens was vital for the technology to gain widespread acceptance [21]. In less than ten years the validated technique has been proven for many different markers on various tumor types in multiple studies [22].
Direct observation of cancer phenotype and protein distribution within cancer tissues using optical methods has a long history in the field of medical diagnosis. The biomolecular specificity possible with optical methods has been particularly valuable in microscopy and histopathology. The application of optical histology methods to the modernized version of TMAs [20], which allow examination of high numbers of patient samples, has become the most used proteomic technique in high-throughput molecular pathology research [23]. More quantitative, optically based techniques with a high linear dynamic range of detection are required.
Immunohistochemistry has limitations, such as the subjectivity of manual scoring which is only semi-quantitative, and exhibits nonlinearity of the staining intensity [23]. In this review novel high-throughput assays based on advanced optical techniques are described that can report on protein modifications beyond the level of protein expression and distribution.
Fluorescence: fluorescent protein transfection, fluorescent probes and fluorophore-conjugated proteins
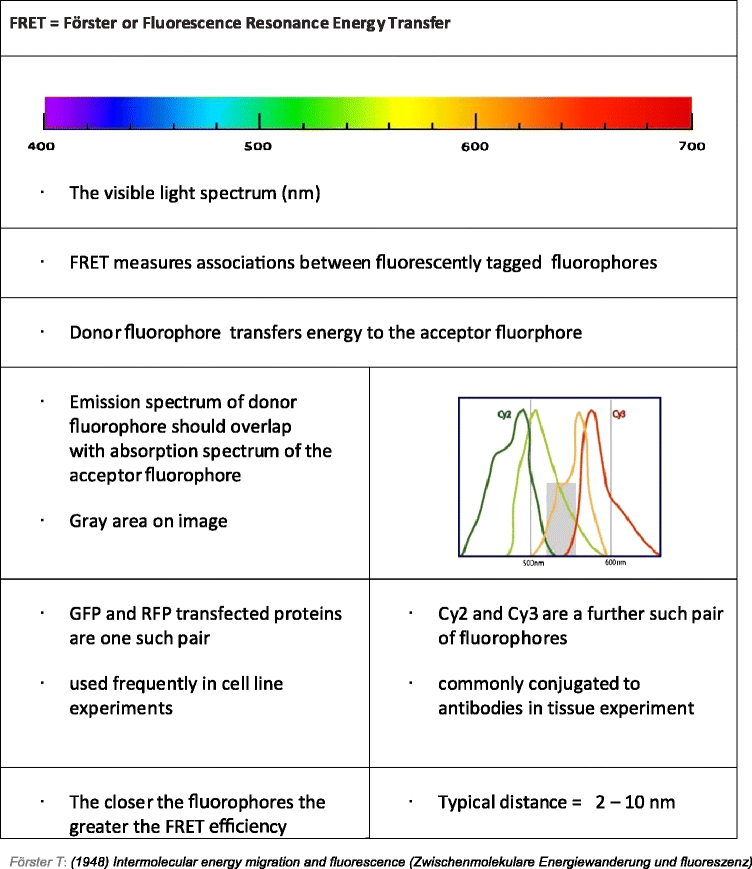
A fluorophore is a molecule capable of absorbing light energy at specific wavelengths and re-emitting this energy at higher wavelengths. Fluorescence is the energy loss process through the emission of light by excited molecules as they revert to the ground state. The fluorescence lifetime, τ (tau), is the average time that each fluorophore remains in an excited state [24]. Förster resonance energy transfer, FRET, is the process of energy transfer from an excited donor fluorophore to an acceptor fluorophore in close proximity (Fig. 2). For FRET to occur, spectrally overlapping fluorophores must be in close proximity. FRET efficiency (FRET eff ) depends on the distance between the two molecules (donor and acceptor fluorophores). The Förster radius, R0, is the distance at which FRET eff is half its maximum value (typically 2–10 nm [25]). R0 further depends on the spectral characteristics of the fluorophores. This energy transfer is indirectly proportional to the sixth power of the distance between the two fluorophores. This fact makes FRET a powerful indicator of molecular proximity, which in practice can only be observed if proteins are interacting (Table 1). A far-field technique can thus be used to provide information at distance scales normally associated with near-field techniques.
Fig. 2.
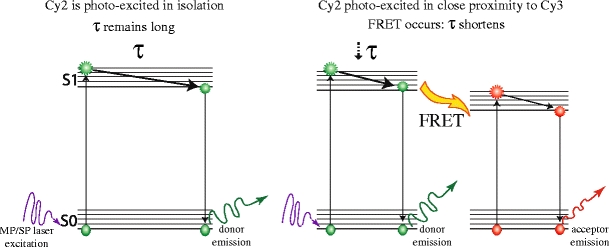
Jablonski representation of FRET As a fluorophore absorbs light it is excited from the ground state (S0) to a higher vibrational level (S1 = first electronic state, S2 etc). At each energy level it exists in a number of closely spaced vibrational energy levels (horizontal lines). Fluorescence results when a molecule returns to S0 from the lowest energy vibrational state of S1. The length of time spent in the higher energy state prior to reverting to the ground state is termed tau, τ, the fluorescence lifetime, and is typically in the pico- to nano-second range. The donor fluorophore (e.g., Cy2) is excited in isolation (left) if donor and acceptor (e.g., Cy3) fluorophores are in close proximity, energy is transferred from the excited donor fluorophore to the acceptor fluorophore, generating an excited acceptor molecule that in turn can then emit fluorescence by reverting to its ground state
Table 1.
Conditions for a successful FRET assay
If a protein is labeled with a donor fluorophore and a second protein labeled with an acceptor fluorophore, then FRET between donor and acceptor is interpreted as the interaction of these proteins. Protein-protein interactions within a cell can be studied using microscopy methods by tagging the protein of interest with a fluorophore and introducing DNA coding for the protein to the immortalized cancer cell. Multiple proteins can be imaged in a single cell by transfecting each protein of interest with a different fluorescent tag and performing sample excitation and image acquisition at appropriate wavelengths.
Alternatively, fluorophores can be directly conjugated to antibodies against proteins involved in cancer cell migration (Fig. 3). When such an antibody is applied to cancer tissue the fluorescence reports on the location where each protein is present. Automated computer algorithms can rapidly and efficiently analyze the images of fluorescently stained tissue, thus quantifying levels of protein expression and subcellular localization. Several proteins can be labeled with different fluorophores enabling simultaneous assessment of multiple proteins in a single tissue section, including their colocalization [26–28], by automatically altering the excitation wavelength of the microscope whilst capturing images in appropriate fluorophore emission wavelength channels. Colocalization studies, while useful, can only determine the presence or absence of the fluorophore(s) on a distance scale limited by the resolution of the microscope used: in practice this is limited to around 250–500 nm in most automated systems. However, the fluorescence signal contains further information about the biophysical environment of the fluorophore and ultimately the tissue in which it is imaged [29]. A specific phenomenon, Förster resonance energy transfer, FRET, can be exploited to provide information at distance scales far below the optical resolution of the microscope. By using pairs of fluorescently labeled antibodies applied to tissue specimens from tumor samples, nanometer proximity between the fluorophores can be determined. Combined with imaging, this is a powerful approach, as FRET yields proximity information well below the optical resolution limit that can be achieved by colocalization imaging of two fluorophores [29].
Fig. 3.
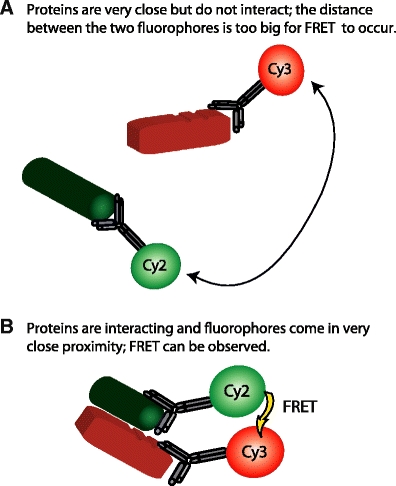
Protein colocalization does not define interaction a Protein proximity: when two proteins are close but not interacting, the fluorophores to which they are attached are some distance apart, more than 10 nm. FRET cannot occur between Cy2 and Cy3 (conjugated to anti-ezrin and anti-PKCα, respectively). b Protein:protein interaction: The conformational changes that occur upon interaction between ezrin and PKCα bring the fluorophores into close proximity. FRET can occur. Thus FRET distinguishes protein interaction from protein proximity
Fluorescence lifetime imaging microscopy
The use of FLIM to measure FRET in live and fixed cells has significantly improved our understanding of the molecular pathways by which extracellular and environmental signals are sensed by breast cancer cells, transduced through the cell signaling machinery, in order to trigger remodeling of the cytoskeleton, thus leading to cancer cell invasion and metastases. These assays provide important spatiotemporal information about the post-translational modifications (e.g., protein phosphorylation [30–33], ubiquitination [34]/sumoylation [35], conformational change associated with, e.g., GDP-GTP exchange [36–38]), proteolytic processing [39], as well as interactions between signaling receptors (integrins, CD44, chemokine receptors and receptor tyrosine kinases (RTK)), protein kinases and many cytoskeletal remodeling proteins [40–51]. FRET-FLIM techniques have reported on signaling processes in archived pathological material [30, 52, 53]. Measuring FRET on TMAs allows in situ quantification of post-translation modifications. Specifically, a two-antibody FRET approach has been applied to human cancer tissues to detect the nano-proximity between a donor fluorophore-conjugated anti-protein kinase C (PKC) or anti-epidermal growth factor receptor (EGFR) antibody, and an acceptor fluorophore-labelled phospho-specific antibody, providing a highly specific quantification of PKC7 or EGFR phosphorylation [52, 53] in cancer tissues.
A major obstacle to the analysis of protein function and protein complex formation in disaggregated breast cancer tissues is contamination of epithelial components by the high admixture of non-neoplastic stroma and inflammatory cells (fibroblasts, immune cells, blood vessels). By using FRET-FLIM imaging approaches on FFPE tissue sections, which retain architecture, relevant portions of the tissues can be chosen for assessment. Furthermore, preservation of protein phosphorylation and protein complexes is improved due to the absence of a protein extraction procedure.
Data analysis
High throughput, automatically acquired imaging of protein interactomes in cells and tissues yields data on multiple protein pairs. These dense multiparametric data require an analysis method that is rational, rapid and robust. Novel methods of interrogating the optical data acquired in relation to clinical outcome are necessary.
Traditional histopathological scoring systems, describing the expression proteins in breast tumors offers information based on tissue morphology and architecture. Such scoring systems can be used in isolation by individual histopathologists or a consensus score can be arrived at, with multiple scorers reviewing images together. Often these systems are subjective and difficult to analyze, with wide inter- and intra- observer variability. Automated scoring of protein distributions performed with a computer algorithm is desirable and indeed possible. Widefield images of fluorescent antibody-marked proteins can be used to automatically score levels of protein staining in specific subcellular locations; segmenting membrane, cytoplasm and nucleus. Iterative fitting can derive a scale and generate masks that segmenting regions and automatically scoring the staining within each compartment. Such scoring systems are rational, rapid and robust and highly economical in terms of expert histopathologist time. They also circumvent the issues of score variability.
Automated analysis of protein colocalization is also possible. Correlation maps between the widefield images of two or more proteins can be produced and the colocalized areas can be found by thresholding out the area of low correlation [54]. Background pixels corresponding to areas where overlap distribution [26] is low and can be efficiently masked out. The highly colocalized areas between the two stains are then found by calculating the Pearson distribution [27] and masking out the regions where the local Pearson coefficient is low. The colocalization intensity image of the remaining highly colocalized pixels can be built and its average value calculated.
Automated microscopy generates large image datasets which can be time consuming to process [55]. This is particularly true for FLIM where exponential curve fitting has to be performed to produce sets of parametric images (e.g., lifetime and interacting fraction maps). These files can be automatically analyzed to produce a distribution of lifetime and an average lifetime. The analysis has been made robust to noise and to low photon counts, providing fast execution and amenability to automation and batch processing [56]. Processing of this type can also be performed on parallel processors or computer clusters where more immediate results are required. Nevertheless, a significant obstacle to more widespread application is the considerably slower image acquisition time: accurate determination of FLIM information is considerably slower than more standard widefield methods. While numerous acquisition technologies are available, acquisition speed is, in general, inversely proportional to accuracy and proportional to the likelihood of generating artifacts. Many recent contributions have emerged in the area of FLIM analysis [56–60] and offered different technical solutions to fluorescence lifetime imaging analysis. The technical details and individual merits associated with each method are however beyond the scope of this article.
The high dimensional optical data acquired in by FRET/FLIM TMA experiments requires novel data analysis. For instance, Bayesian machine learning algorithms or simple artificial neural networks of the perceptron type [61] can be used to relate input and output data according to the image traits derived, termed the input data. Both clustering trees and self-organizing maps (two dimensional, discretized topology-conserving representations) [62] can be produced to visualize these high-dimensional data.
Preclinical utility of FRET-FLIM assays
Cell line models of human cancers
In order to improve understanding of the basic biology of cancer, immortalized cell line models of neoplasia are often studied in the laboratory. FRET-FLIM assays in cell lines have great power in progressing beyond biochemical assays of protein interaction and network complexity. Furthermore, preclinical data cell lines cancer studies can inform on how aberrant oncogenic molecular pathways respond to drugs at the individual protein level.
EGFR/HER signaling plays an important role in the pathogenesis of a variety of tumor types. For instance, in breast cancer, antibody therapy against HER2 has demonstrated efficacy in patients with advanced breast cancer and may prove to prevent metastases in the adjuvant setting [63]. However, responses to HER targeted therapies do not correlate with receptor levels [16], and tumors eventually escape biological control. The basic molecular biology behind this primary and secondary resistance is not yet clear, but optical proteomics offers a novel approach in answering these questions.
The HER2/HER3 heterodimer has been shown to function as an oncogenic unit, with HER2 requiring dimerization with HER3 to drive proliferation [64]. HER3 couples active HER2 to the phosphatidylinositol 3-kinase (PI3K) intracellular signaling pathway. HER3 has also been shown to recruit PI3K in gefitinib-resistant cells, thus escaping gefitinib treatment [65]. Therefore, the quantification of FRET between HER2 and HER3, indicating heterodimer formation should be of functional significance and has now been measured in cancer cells by FLIM (Fig. 4a). The reported stabilizing effect of small molecule inhibitors such as lapatinib on HER2/HER3 heterodimers [66] can now be accurately quantified in cells and tissues in situ.
Fig. 4.
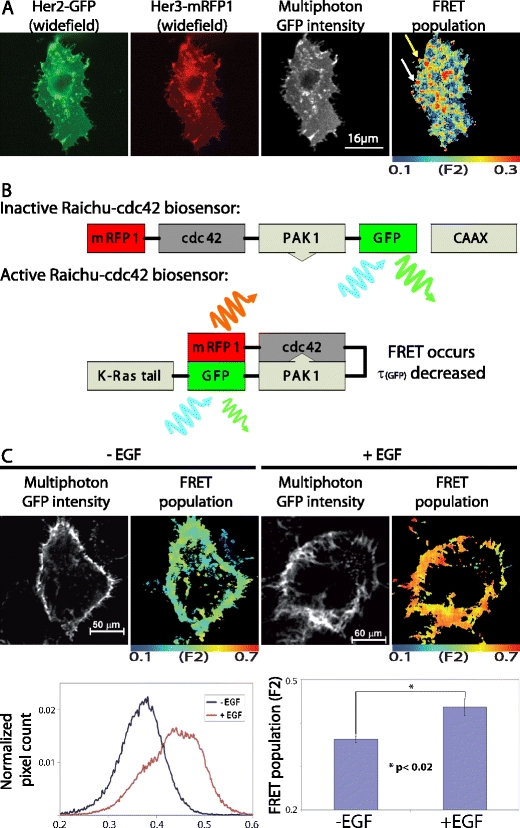
FRET/FLIM examples in cell-line models of cancer a MCF-7 breast cancer cells were transfected with HER2-GFP and HER3-mRFP1. The HER2-GFP transmembrane receptor is seen within the cell membrane and intracellular compartments. HER3-mRFP1 colocalized with HER2 at both cell membrane and several intracellular/sub-plasmalemmal vesicles. In the example shown, the FRET population, or fraction of interacting molecules (F2), was determined using bi-exponential fitting and global analysis, as described [56]. HER2-HER3 receptor dimers were found to localize to both cell protrusions (top arrow) and internal vesicular structures including the sub-plasmalemmal endocytic compartment shown (white arrow) b This cartoon shows the molecular domains of the modified Raichu cdc42 biosensor in its inactive and activated state. Upon activation, cdc42 bind the PAK1 domain and consequently brings the two attached fluorophores in close proximity thus enabling FRET. The level of FRET can be measured by the fluorescence lifetime decrease of the donor fluorophore GFP. CAAX (or CAAX-box), genetically engineered modification to the C-terminusof the probe to enable the probe to monitor the activity-change at the plasma membrane [67] c A431 cells expressing the Raichu-Cdc42 biosensor were stimulated with EGF (100 ng/ml) for 10 min, and subsequently imaged by multiphoton FLIM. Stimulated cells had a significantly greater interacting fraction (F2) compared to unstimulated cells (p < 0.02, two tailed independent samples t-test). The results confirm that a growth factor-induced increase in Cdc42 activity is a direct result of EGFR activation
In order to overcome problems with relative expression levels of different protein-fluorophore constructs in cells, a number of research groups have produced sensor probes, whereby the proteins of interest are placed between the donor and acceptor fluorophores. The Raichu-Cdc42 FRET biosensor probe is one such example (Fig. 4b). This type of intramolecular FRET sensor can be expressed in living cells with negligible perturbation of endogenous protein function [67, 68], and permits monitoring of the subcellular “microenvironment” that regulates GTPase activities in living cells. Such probes can be used to monitor protein activity in a living tumor using intravital techniques (please see the below section on preclinical molecular pathway evaluation in animal models using optical imaging) Furthermore, the probe plasmids can be delivered intratumorally by electroporation in live, anaesthetized animals, as described previously [69].
For monitoring localized small Rho GTPase activities (Cdc42, Rac1, RhoA) in cells, YFP-Raichu-CFP probes have been reported previously [70]. The original Raichu probes were designed for intensity measurements of sensitized acceptor emission to detect FRET. The benefits of using donor FLIM to detect FRET are that it is largely independent of fluorophore concentration, it is independent of donor-acceptor stoichiometry (as long as the acceptor is in excess) and light path length. It is therefore better suited to studies in intact cells than intensity-based methods [32, 71]. We have established Raichu-FLIM [37], whereby upon GTP binding, Rac1/Cdc42/RhoA exhibits a higher affinity towards the corresponding RhoGTPase-interacting domain, bringing the two different fluorescent proteins of the biosensor into close proximity and enabling FRET between GFP and mRFP1. FRET results in a decrease in the observed GFP fluorescence lifetime (τ). The Raichu-Cdc42 fluorescence biosensor has been used to demonstrate spatiotemporal images of EGF-induced Cdc42 activation in cancer cells (see Fig. 4c).
Resistance to many biological treatments could be understood better by imaging the recruited signaling pathways in response to drug combinations. Such mechanisms are responsible for both primary resistance and diminishing responses to targeted therapy. The mechanisms of action of novel inhibitors can be further elucidated at the molecular level by optical imaging, thus providing valuable preclinical information on how tumor cells overcome their vulnerability to targeted therapy. Translating such assays into clinical benefit will guide the rational use of expensive drugs. The disappointment of a tumor failing to respond to targeted therapy could be challenged and overcome by imaging the recruited resistance pathways, followed by designing treatment combinations specific to each patient’s tumor, in order to circumvent these mechanisms of resistance.
Preclinical molecular pathway evaluation in animal models using optical imaging
Animal imaging plays multiple roles in new drug development by providing, in preclinical models, important information which can lead to ways of improving cancer patient management. The objectives of the preclinical imaging activities [72] include: [i] monitoring the response of both primary tumors and secondary metastases during potential therapies and also assessment of tumor recurrence upon cessation of treatment; [ii] analysis of the distribution of agents within the body, i.e., pharmacokinetic studies, and dose optimization; [iii] determination of the efficacy of an agent against the activity of its intended target at the molecular mechanistic level; and [iv] monitoring the effects of agents on pathophysiological processes such as changes in the vascular volume of tumors in response to blocking proangiogenic signals.
Despite the enormous investment in genomics and screening technologies over the past 20 years, the cost of new drug discovery continues to rise while approval rates fall [73]. In the drug discovery context, the desire to exploit the wealth of the proteome has also come face to face with the realization that knowing a target is not the same as knowing what the target does, let alone knowing the effects of a chemical inhibitor in diverse disease settings. For instance, clinical studies of EGFR inhibitors have shown response rates of the order of 5%–15% in a variety of cancer types [74–77] and responses to ErbB-targeted therapies do not however correlate necessarily with the receptor levels [16]. Much needed is the means of monitoring the pathway responses to a specific targeted therapy and their translation to organ and organism level physiology.
Optical imaging techniques, in particular those which can be used to reliably measure FRET between two protein partners, have in recent years been used to monitor the pathway response (within the proteome) to both chemical and genetic perturbations, as well as its timing and subcellular localization, within live/intact cancer cells ex vivo. These assays provide important spatiotemporal information about the post-translational modifications as well as interactions between proteins. For determining directly the efficacy of targeted cancer therapies, we have now developed intravital FRET by FLIM assays in murine models of human cancers.
In order to acquire intravital imaging microscopic information in three dimensions, optical sectioning of a sample and exclusion of out-of-focus light from fluorophores outside the planes of interest is crucial. The latter can be achieved by confocal laser scanning microscopy, which uses linear single photon excitation (SPE) and a confocal pinhole to achieve optical sectioning. However, all fluorophores within the light path are excited and are thus prone to photo-toxic effects and bleaching. Furthermore, conventional SPE light is scattered in thick samples, hampering the resolution of imaging in depth. By replacing SPE with non-linear two-photon excitation (TPE, often also termed MPE, multi-photon excitation) the excited volume can be reduced drastically, thereby protecting the fluorophores outside the plane of interest and achieving optical sectioning via excitation of only the section of interest [78, 79]. TPE excitation is achieved by the use of less phototoxic near-infrared light of approximately half the excitation energy required to excite a fluorophore as compared to SPE. Near-infrared light is also scattered to a much lesser extent in tissue, thereby improving its penetration depth and enabling controlled excitation of fluorophores that are located even deeper within the tissue. By combining TPE with laser scanning microscopy (TPLSM), it was possible to increase the imaging depth from tens of micrometres up to nearly 1 millimetre [80] while protecting not only the fluorophores but also the surrounding tissue from photo-damage. This technique was successfully applied for imaging endogenous and/or introduced fluorophores deep inside biological tissue [81–85]. An additional benefit of TPE is that it also enables the label-free imaging of highly ordered structures like fibrillar collagen via a process termed second harmonic generation (SHG) [86]. SHG permits the collection of information regarding structure and concentration within biological material as long as there are sufficient highly ordered structures available [87]. For instance, many solid tumors have a peripheral capsule, which contains high concentrations of fibrillar collagen and thereby the tumor boundary can be easily visualized. In the context of cancer invasion and metastasis, intravital deep-tissue TPLSM has provided further insight into processes like the invasiveness of tumor cells and the efficacy of drugs affecting cellular motility [72, 88]. This technique was also used to investigate agents that modify the extracellular matrix and the diffusion of components of the interstitial fluid [89]. Furthermore, the leakiness of the (tumor) vasculature [90] and the effects of antiangiogenic drugs [91, 92] have been studied, as well as the efficiency of oxygen delivery [93–95].
In order to establish in situ measurements of the aforementioned pathway/proteome response in thick samples of living biological tissue, we aimed at combining TPLSM with the advantages of measuring FRET by FLIM and developing this technology for intravital FRET imaging in animal models of cancer. With the development of this technique, it should be possible for the first time to gain insight into, e.g., the efficacy of an agent against the activity of its intended target within tumor cells, cells of the tumor microenvironment, or metastasizing cells in vivo.
Currently, the use of intravital FRET-FLIM techniques to monitor protein activity or protein-protein interactions is an emerging technology and the first promising results were reported very recently [96]. An example of the state-of-the-art of this novel imaging technique to probe a specific protein-protein interaction that is purported to support breast cancer metastasis is depicted in Fig. 5. Mammary adenocarcinoma cells were genetically modified to express a fusion protein of green fluorescent protein (GFP) and the chemokine receptor CXCR4, which is implicated in metastasis of many types of cancer [97, 98]. Protein kinase C alpha (PKCα) was reported to be a modulator of CXCR4, recycling in human breast cancer cells by directly interacting with this receptor [46]. We fused PKCα to a monomeric red fluorescent protein (mRFP1) and introduced this fusion protein into the mammary cells already stably expressing CXCR4-GFP. In this new cell line, CXCR4-GFP is the molecule being observed by FLIM and serves as the FRET donor. Upon its interaction with PKCα-mRFP1 (FRET acceptor), a reduction in the fluorescence lifetime of GFP can be observed that accounts for a direct protein-protein interaction between CXCR4 and PKCα. Following xeno-transplantation of such modified cancer cells into an immuno-compromised mouse model, we obtained solid tumors after several weeks of growth. The animal was imaged under anesthesia in a temperature-controlled environment and fluorescence lifetime images were acquired by intravital FLIM as described [96]. The collagen-rich tumor boundary in this animal model was imaged by SHG and the area where the plasma membranes of the first tumor cells were observed was defined as the tumor edge. All further images were acquired parallel to this plane and depth values were assigned relative to this optical section. Two-photon-excited GFP fluorescence intensity images show that deep-tissue imaging was performed with no loss in lateral resolution while increasing imaging depth (Fig. 5). FRET between GFP and mRFP1 results in shortening of the fluorescence lifetime (τ) of GFP (red on the pseudocolor scale). The fluorescence lifetimes determined within the tumor core (60 μm, 100 μm from the edge) are constant and in agreement with the values obtained for a tumor in the absence of a suitable acceptor fluorophore (data not shown) suggesting no direct interaction between CXCR4-GFP and PKCα-mRFP. Interestingly, we found that in optical sections close to the tumor boundary (20 μm from the edge), there is interaction between CXCR4 and PKCα as revealed by the reduced fluorescence lifetimes. We are currently investigating the pathophysiological significance of the assembly of this pro-migratory receptor:kinase complex [46], close to the edge of tumor. Small molecule inhibitors that can reverse this protein complex assembly may perturb this early stage of cancer invasion. Intravital FLIM is a technology that for the first time allows us to perform in situ protein:protein interaction measurements by FRET not only in vitro in two dimensions, but also in vivo in three dimensions. Further development of this imaging technology will find utility in preclinical research and facilitate novel therapeutic and associated biomarker discovery.
Fig. 5.
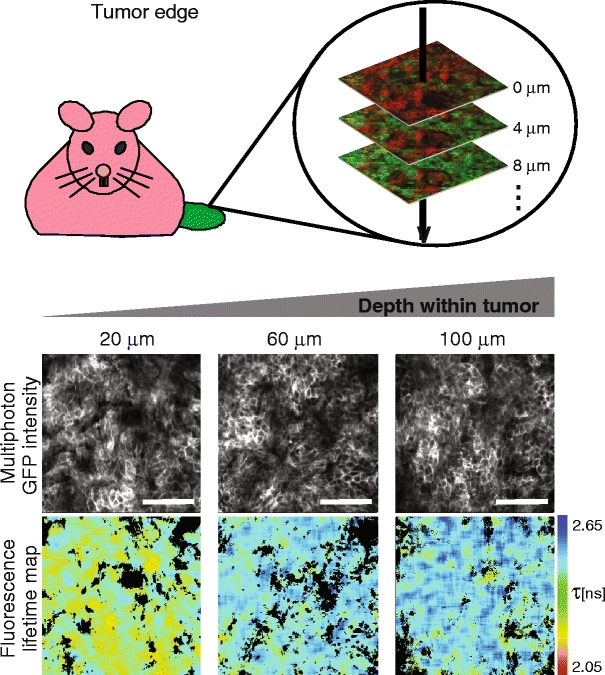
Combination of TPLSM with FLIM measurements reliably reveals fluorescence lifetime differences in vivo. Tumors were established by subcutaneous injection of mammary adenocarcinoma cells stably expressing CXCR4-GFP and PKCα-RFP into immuno-compromized mice. The animals were imaged alive under anesthesia using a two-photon laser scanning microscope capable of detecting second-harmonic-generated (SHG) and fluorescence lifetime imaging (FLIM) data, and z-stacks were acquired. Three optical image planes are shown beneath a cartoon for orientation purpose. Depth values represent distances of the corresponding optical section relative to the tumor boundary. Monochrome images represent two-photon intensity and time-resolved information from these was used to calculate the corresponding fluorescence lifetime maps on a pixel-by-pixel basis. The fluorescence lifetime images are pseudo-colored to facilitate recognition of areas with increased interaction between CXCR4 and PKCα (“warm” colors). The scale bar corresponds to 100 micrometres
Clinical utility of FRET-FLIM assays
Utility of FRET-FLIM assays in archived patient material
Many studies have described protein distribution and expression level changes which correlate with prognosis across the spectrum of human cancers. One such study applied immunohistochemistry techniques to tissue microarrays (TMA) of breast cancer. Patient clusters were identified according to their protein expression and differences were noted in terms of established prognostic factors and clinical outcomes [99]. This study demonstrated that tumors which appear similar on the basis of established prognostic methods, display wide heterogeneity when examined with respect to protein expression.
Large-scale quantification of specific protein-protein interactions in patient-derived tissue samples has not yet been documented. In our laboratory we have achieved semi-automated (with pathologist input for selection of tumor regions), spatially resolved and high-resolution FRET-FLIM assays using formalin-fixed paraffin-embedded tissue. The high volume of data acquired was analyzed using novel artificial neural network techniques and correlated with patient clusters and clinical outcome (Fig. 6 and Kelleher et al, unpublished data).
Fig. 6.
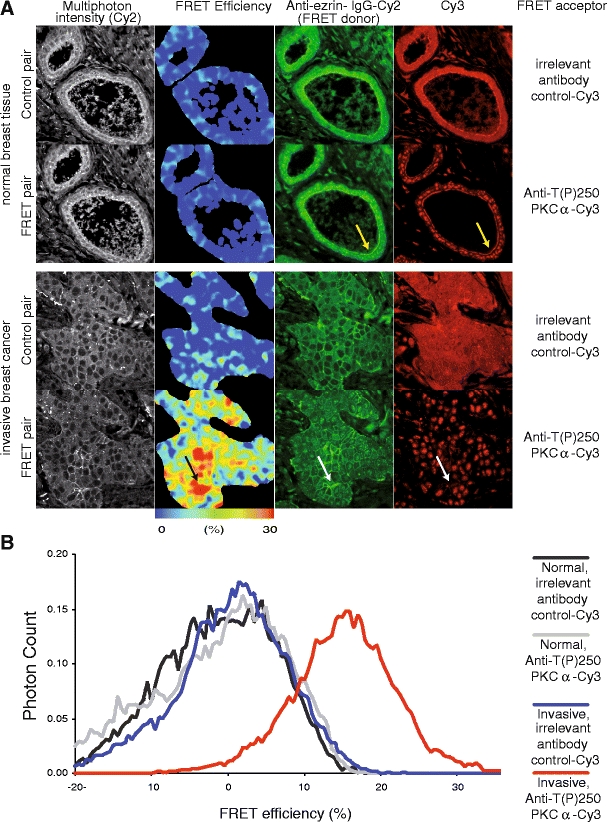
FRET-FLIM imaging of protein complexes in patient tumor material. The PKCα-ezrin protein complex was first detected by FRET/FLIM and was shown [45] to promote directional cancer cell motility and hence the metastatic potential of MCF-7 cells. The direct interaction between endogenous ezrin and activated PKCα has been demonstrated by multiphoton FLIM, in patient-derived cancer tissues that have been labeled with Cy2-labeled anti-ezrin-antibody (2H3) and Cy3 labeled anti-T(P)250-PKCα antibody [30]. FRET efficiency (in each pixel) = 1 - τda/τcontrol, where τda is the Cy2 lifetime of tumor section costained with Cy2-labelled anti-ezrin-antibody and Cy3 labeled anti-T(P)250-PKCα antibody; and τcontrol is the average Cy2 lifetime (for the whole field of view) measured in the absence of the Cy3 acceptor-labeled antibody. Another control is provided by an irrelevant Cy3-labeled antibody against a protein that is known not to interact with ezrin. In normal breast tissue the labeled proteins are close but not interacting; the fluorophores to which they are attached do not show FRET because the proteins are too far apart (“cold” colors in the FRET efficiency map). In contrast, in the sample of invasive breast cancer, not only are ezrin and PKCα close (white arrows) but they are also interacting (“warm” colors in the FRET efficiency map). The anti-T(P)250-PKCα antibody is known to interact with a non-PKC, 180 kDa nuclear antigen [30]; both membrane and nuclear staining can therefore be detected in the tumors. This antibody specificity issue is overcome by donor FLIM which only quantifies the population of Cy2 in close proximity to Cy3 acceptor, i.e., the assay requires only the donor fluorophore-labeled antibody (in this case an in-house anti-ezrin monoclonal antibody with proven specificity [45]). The resolution of the FRET efficiency map does not match that of the corresponding intensity map because pixel binning was required to increase the photon counts for lifetime estimation.
This technology platform is evolving. Our prototype optical proteomic biomarker, based on a small protein network involved in cancer cell metastasis, has yielded statistically significant prognostic information. Further prospective validation is required prior to demonstrating clinical significance. Nevertheless it demonstrates how a combined optical imaging/mathematical modeling approach can offer additional information, pertaining to protein function and network formation, over simple intensity-based protein quantification.
Advances in molecular and cell biology are providing an improved understanding of cancer, from the germ line to specific somatic changes of one patient’s cancer. The potential for individualizing prognosis is significant, and allows patients with an excellent prognosis to be spared the toxicity of adjuvant therapy. By assessing molecular pathways in those at high risk, improved selection of targeted therapy will ensue. Expensive drugs will be tailored to the patients whose tumor biology predicts response.
FRET-FLIM assays have further potential clinical utility in the assessment of response to targeted therapy. In the neoadjuvant setting, repeat tumor biopsies could be analyzed to assess whether the specific aberrant pathway blocked by the targeted biological drug is indeed perturbed appropriately. In instances where tumor tissue is not available, FRET-FLIM assays could also be performed in surrogate tissue samples from patients receiving treatment. Clinicians could choose treatment rationally for each patient and tailor subsequent therapies based on that individual’s molecular response or resistance mechanisms.
Discussion
Significant advances have been made in cancer treatment over the past 50 years, many of them empirical, more latterly based on international randomized clinical trials involving thousands of patients. Early diagnostic screening program, improved surgical procedures, advanced radiotherapy techniques and combinations with adjuvant cytotoxic drugs have all contributed to survival improvements across the spectrum of human cancers. Modifications to all of these treatment modalities are continually reviewed, but further improvements in cancer survival are likely to be modest.
Rational biological treatment of cancer, targeted at specific molecular pathways has shown efficacy and promises a changing future in oncology. The current approach is to combine existing breast cancer therapies with novel agents that interfere with major signaling pathways. Nonetheless, targeted therapy is no panacea. Though it holds great promise, many patients do not respond to targeted drugs de novo, and countless more develop acquired resistance. In this technologically advanced post-genomic era, future advances in cancer treatment must address both the genetic profiles and proteomic signatures of individual neoplasms. Assays aimed at the identification of tumors with explicit changes in the molecular pathways that are specific to individual patients, will identify the population of patients most likely to benefit from specific targeted treatment. Only by discovering the oncogenic pathways that propel each individual’s cancer we can hope to truly tailor therapy to all patients with cancer. Dynamic personalized therapy, changing as the tumor evolves, will improve treatment efficacy and prolong survival for many cancer patients.
The introduction of novel targeted therapeutics has revolutionized cancer care and may offer the potential for cure to more patients. Better selection of patients likely to respond to these drugs will reduce costs significantly. If a goal of translational research is to prevent cancer deaths, then basic science must continue to interrogate the metastatic process. Optical proteomics aims to devise new prognostic tools by analyzing the detailed molecular make-up of individual tumors and estimating the metastatic and survival potential therein (Fig. 7).
Fig. 7.
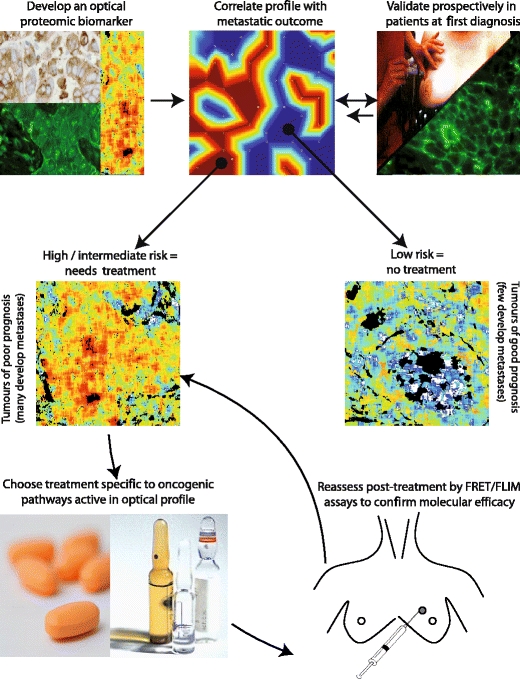
Clinical utility schematic. Once an optical proteomic biomarker is validated in cancer tissue at first diagnosis, a novel optical multi-protein biomarker should clearly differentiate individual patients of good prognosis, who could be spared adjuvant chemotherapy distinct from those patients who are of higher metastatic risk. The correlation of the optical image parameters with clinical outcome requires the use of both clustering trees and self-organizing maps (two dimensional, discretized topology-conserving representations) [62], a full description of these methods is beyond the scope of this article. Patients with an intermediate or poor prognosis should receive tailored treatment aimed at perturbing the specific oncogenic pathways in their particular tumor, thereby increasing the likelihood of a good response to therapy. Tumor or surrogate tissue could be reassessed throughout treatment in order to ensure that the pro-migratory oncogenic pathways remain blocked and to monitor the development of potential drug resistance
In vitro diagnostic multigene index assays (IVDMIAs) have been generating excitement for more than a decade, demonstrating clinical utility in select groups of patient. Prospective clinical trials have not yet reported improved patient outcome on the basis of treatment decisions made according to IVDMIAs, though it is hoped that this will be the case in the near future. Combined genomics and proteomics should reduce healthcare costs by reducing the number of cancer patients selected for adjuvant treatment without compromising clinical outcome. Toxicity could be spared and resources focused to combat metastatic cancer.
The optimal use of “omic” technologies will require close collaboration between oncologists and basic scientists. In the analysis of high dimensional data, great care must be taken to validate results in a separate patient population. To this effect, statisticians, mathematicians, bioinformaticians and epidemiologists all have a crucial role to play in this translation of exciting, novel laboratory research into “real-life” benefits for cancer patients. There are surmountable obstacles to overcome to achieve the goal of translating advanced optical proteomic science into real-life benefit for cancer patients and their physicians.
Acknowledgements
M. Kelleher was supported by a Guy’s and St Thomas’ Charity grant (R041004). G. Fruhwirth is supported by the King’s College London and University College London Comprehensive Cancer Imaging Centre CR-UK & EPSRC, in association with the MRC and DoH (England) C1519/A10331. E. Ofo is a recipient of both a Wellcome Trust Clinical Training Fellowship (WT084982) and the Dimbleby Cancer Care Award. Both E. Ofo (2007/8) and G. Patel (2008/9) received one-year clinical fellowship support from the Department of Health via the National Institute for Health Research (NIHR) comprehensive Biomedical Research Centre award to Guy's & St Thomas' NHS Foundation Trust, in partnership with King's College London and King’s College Hospital NHS Foundation Trust. A. Coolen is the recipient of a Springboard Research Fellowship from EPSRC. S. Ameer-Beg and T. Ng are supported by an endowment fund from Dimbleby Cancer Care to King’s College London. The 2PE FLIM system was built with support from both the Medical Research Council Co-Operative Group grant (G0100152 ID 56891) and an UK Research Councils Basic Technology Research Programme grant (GR/R87901/01). P. Barber is supported by a Cancer Research UK Programme grant C133/A/1812, as is B. Vojnovic.
Conflict of interest statement
No funds were received in support of this study.
Open Access
This article is distributed under the terms of the Creative Commons Attribution Noncommercial License which permits any noncommercial use, distribution, and reproduction in any medium, provided the original author(s) and source are credited.
Footnotes
Significant advances in understanding normal cell function and in developing successful strategies for therapeutic intervention in disease will increasingly depend on our ability to study the expression, post-translational modifications and formation of protein complexes and networks in the cancer cells. Our definition of “Optical Proteomics” (please refer to http:www.opticalproteomics.org) broadly refers to the use of optical techniques to provide all these types of information from intact cells and tissues without disrupting the normal protein or cell function
References
- 1.Chambers AF, Groom AC, MacDonald IC. Dissemination and growth of cancer cells in metastatic sites. Nat Rev Cancer. 2002;2:563–572. doi: 10.1038/nrc865. [DOI] [PubMed] [Google Scholar]
- 2.Early Breast Cancer Trialists' Collaborative Group (EBCTCG) Effects of chemotherapy and hormonal therapy for early breast cancer on recurrence and 15-year survival: an overview of the randomised trials. Lancet. 2005;365:1687–1717. doi: 10.1016/S0140-6736(05)66544-0. [DOI] [PubMed] [Google Scholar]
- 3.Cole BF, Gelber RD, Gelber S, et al. Polychemotherapy for early breast cancer: an overview of the randomised clinical trials with quality-adjusted survival analysis. Lancet. 2001;358:277–286. doi: 10.1016/S0140-6736(01)05483-6. [DOI] [PubMed] [Google Scholar]
- 4.Early Breast Cancer Trialists' Collaborative Group Polychemotherapy for early breast cancer: an overview of the randomised trials. Lancet. 1998;352:930–942. doi: 10.1016/S0140-6736(98)03301-7. [DOI] [PubMed] [Google Scholar]
- 5.Rubens RD. Management of early breast cancer. Bmj. 1992;304:1361–1364. doi: 10.1136/bmj.304.6838.1361. [DOI] [PMC free article] [PubMed] [Google Scholar]
- 6.Green M, Hortobagyi G, et al. Chemotherapy for Breast Cancer. In: Hunt K, Robb G, Ueno N, et al., editors. Breast Cancer: M.D. Anderson Cancer Care Series. New York: Springer-Verlag; 2001. pp. 323–324. [Google Scholar]
- 7.Ravdin PM, Siminoff LA, Davis GJ, et al. Computer program to assist in making decisions about adjuvant therapy for women with early breast cancer. J Clin Oncol. 2001;19:980–991. doi: 10.1200/JCO.2001.19.4.980. [DOI] [PubMed] [Google Scholar]
- 8.Cardoso F, Piccart MJ, Durbecq V, Di Leo A. Resistance to trastuzumab: a necessary evil or a temporary challenge? Clin Breast Cancer. 2002;3:247–257. doi: 10.3816/CBC.2002.n.028. [DOI] [PubMed] [Google Scholar]
- 9.Jonsson B, Wilking N. A global comparison regarding patient access to cancer drugs: summary. Ann Oncol. 2007;18:iii2–7. doi: 10.1093/annonc/mdm096. [DOI] [PubMed] [Google Scholar]
- 10.Di Leo A, Claudino W, Colangiuli D, et al. New strategies to identify molecular markers predicting chemotherapy activity and toxicity in breast cancer. Ann Oncol. 2007;18(Suppl 12):xii8–14. doi: 10.1093/annonc/mdm533. [DOI] [PubMed] [Google Scholar]
- 11.Massague J. Sorting out breast-cancer gene signatures. N Engl J Med. 2007;356:294–297. doi: 10.1056/NEJMe068292. [DOI] [PubMed] [Google Scholar]
- 12.Tovar C, Rosinski J, Filipovic Z, et al. Small-molecule MDM2 antagonists reveal aberrant p53 signaling in cancer: implications for therapy. Proc Natl Acad Sci U S A. 2006;103:1888–1893. doi: 10.1073/pnas.0507493103. [DOI] [PMC free article] [PubMed] [Google Scholar]
- 13.Vassilev LT. Small-molecule antagonists of p53-MDM2 binding: research tools and potential therapeutics. Cell Cycle. 2004;3:419–421. [PubMed] [Google Scholar]
- 14.Vassilev LT, Vu BT, Graves B, et al. In vivo activation of the p53 pathway by small-molecule antagonists of MDM2. Science. 2004;303:844–848. doi: 10.1126/science.1092472. [DOI] [PubMed] [Google Scholar]
- 15.Arkin MR, Wells JA. Small-molecule inhibitors of protein-protein interactions: progressing towards the dream. Nat Rev Drug Discov. 2004;3:301–317. doi: 10.1038/nrd1343. [DOI] [PubMed] [Google Scholar]
- 16.Arteaga CL, Baselga J. Tyrosine kinase inhibitors: why does the current process of clinical development not apply to them? Cancer Cell. 2004;5:525–531. doi: 10.1016/j.ccr.2004.05.028. [DOI] [PubMed] [Google Scholar]
- 17.Hollingsworth MA, Swanson BJ. Mucins in cancer: protection and control of the cell surface. Nat Rev Cancer. 2004;4:45–60. doi: 10.1038/nrc1251. [DOI] [PubMed] [Google Scholar]
- 18.Hicke L. Protein regulation by monoubiquitin. Nat Rev Mol Cell Biol. 2001;2:195–201. doi: 10.1038/35056583. [DOI] [PubMed] [Google Scholar]
- 19.Abramovitz M, Leyland-Jones B. A systems approach to clinical oncology: Focus on breast cancer. Proteome Sci. 2006;4:5. doi: 10.1186/1477-5956-4-5. [DOI] [PMC free article] [PubMed] [Google Scholar]
- 20.Kononen J, Bubendorf L, Kallioniemi A, et al. Tissue microarrays for high-throughput molecular profiling of tumor specimens. Nat Med. 1998;4:844–847. doi: 10.1038/nm0798-844. [DOI] [PubMed] [Google Scholar]
- 21.Camp RL, Charette LA, Rimm DL. Validation of tissue microarray technology in breast carcinoma. Lab Invest. 2000;80:1943–1949. doi: 10.1038/labinvest.3780204. [DOI] [PubMed] [Google Scholar]
- 22.Kay E, O'Grady A, Morgan JM, et al. Use of tissue microarray for interlaboratory validation of HER2 immunocytochemical and FISH testing. J Clin Pathol. 2004;57:1140–1144. doi: 10.1136/jcp.2003.014910. [DOI] [PMC free article] [PubMed] [Google Scholar]
- 23.Bertucci F, Birnbaum D, Goncalves A. Proteomics of breast cancer: principles and potential clinical applications. Mol Cell Proteomics. 2006;5:1772–1786. doi: 10.1074/mcp.R600011-MCP200. [DOI] [PubMed] [Google Scholar]
- 24.Lakowicz JR. Principles of Fluorescence Spectroscopy. New York: Kluwer Academic/ Plenum; 2006. [Google Scholar]
- 25.Peter M, Ameer-Beg SM. Imaging molecular interactions by multiphoton FLIM. Biol Cell. 2004;96:231–236. doi: 10.1016/j.biolcel.2003.12.006. [DOI] [PubMed] [Google Scholar]
- 26.Manders EMM, Verbeek FJ, Aten JA. Measurement of co-localization of objects in dual-colour confocal images. J Microsc. 1993;169:375–382. doi: 10.1111/j.1365-2818.1993.tb03313.x. [DOI] [PubMed] [Google Scholar]
- 27.Gonzalez RC. Wintz P (1987) Digital Image Processing. MA Addison-Wesley: Reading; 1987. [Google Scholar]
- 28.Schubert W, Bonnekoh B, Pommer AJ, et al. Analyzing proteome topology and function by automated multidimensional fluorescence microscopy. Nat Biotechnol. 2006;24:1270–1278. doi: 10.1038/nbt1250. [DOI] [PubMed] [Google Scholar]
- 29.Festy F, Ameer-Beg SM, Ng T, Suhling K. Imaging proteins in vivo using fluorescence lifetime microscopy. Mol Biosyst. 2007;3:381–391. doi: 10.1039/b617204k. [DOI] [PubMed] [Google Scholar]
- 30.Ng T, Squire A, Hansra G, et al. Imaging protein kinase Calpha activation in cells. Science. 1999;283:2085–2089. doi: 10.1126/science.283.5410.2085. [DOI] [PubMed] [Google Scholar]
- 31.Verveer PJ, Wouters FS, Reynolds AR, Bastiaens PI. Quantitative imaging of lateral ErbB1 receptor signal propagation in the plasma membrane [In Process Citation] Science. 2000;290:1567–1570. doi: 10.1126/science.290.5496.1567. [DOI] [PubMed] [Google Scholar]
- 32.Wouters FS, Bastiaens PI. Fluorescence lifetime imaging of receptor tyrosine kinase activity in cells. Curr Biol. 1999;9:1127–1130. doi: 10.1016/S0960-9822(99)80484-9. [DOI] [PubMed] [Google Scholar]
- 33.Reynolds AR, Tischer C, Verveer PJ, et al. EGFR activation coupled to inhibition of tyrosine phosphatases causes lateral signal propagation. Nat Cell Biol. 2003;5:447–453. doi: 10.1038/ncb981. [DOI] [PubMed] [Google Scholar]
- 34.Ganesan S, Ameer-Beg SM, Ng TT, et al. A dark yellow fluorescent protein (YFP)-based Resonance Energy-Accepting Chromoprotein (REACh) for Forster resonance energy transfer with GFP. Proc Natl Acad Sci U S A. 2006;103:4089–4094. doi: 10.1073/pnas.0509922103. [DOI] [PMC free article] [PubMed] [Google Scholar]
- 35.Dadke S, Cotteret S, Yip SC, et al. Regulation of protein tyrosine phosphatase 1B by sumoylation. Nat Cell Biol. 2007;9:80–85. doi: 10.1038/ncb1522. [DOI] [PubMed] [Google Scholar]
- 36.Beutler M, Makrogianneli K, Vermeij RJ, et al. satFRET: estimation of Forster resonance energy transfer by acceptor saturation. Eur Biophys J. 2008;38:69–82. doi: 10.1007/s00249-008-0361-5. [DOI] [PubMed] [Google Scholar]
- 37.Makrogianneli K, Carlin LM, Keppler MD, et al. Integrating receptor signal inputs that influence small Rho GTPase activation dynamics at the immunological synapse. Mol Cell Biol. 2009;29(11):2997–3006. doi: 10.1128/MCB.01008-08. [DOI] [PMC free article] [PubMed] [Google Scholar]
- 38.Carlin LM, Makrogianneli K, Fruhwirth G, Ng T (2010) Visualizing signalling in immune cells. In Nourshargh S, Marelli-Berg FM (eds): "T-Cell Trafficking, Methods in Molecular Biology." Totowa: Humana Press. In press
- 39.Harpur AG, Wouters FS, Bastiaens PI. Imaging FRET between spectrally similar GFP molecules in single cells. Nat Biotechnol. 2001;19:167–169. doi: 10.1038/84443. [DOI] [PubMed] [Google Scholar]
- 40.Ng T, Shima D, Squire A, et al. PKCalpha regulates beta1 integrin-dependent cell motility through association and control of integrin traffic. Embo J. 1999;18:3909–3923. doi: 10.1093/emboj/18.14.3909. [DOI] [PMC free article] [PubMed] [Google Scholar]
- 41.Parsons M, Monypenny J, Ameer-Beg SM, et al. Spatially distinct binding of Cdc42 to PAK1 and N-WASP in breast carcinoma cells. Mol Cell Biol. 2005;25:1680–1695. doi: 10.1128/MCB.25.5.1680-1695.2005. [DOI] [PMC free article] [PubMed] [Google Scholar]
- 42.Anilkumar N, Parsons M, Monk R, et al. Interaction of fascin and protein kinase Calpha: a novel intersection in cell adhesion and motility. Embo J. 2003;22:5390–5402. doi: 10.1093/emboj/cdg521. [DOI] [PMC free article] [PubMed] [Google Scholar]
- 43.Legg JW, Lewis CA, Parsons M, et al. A novel PKC-regulated mechanism controls CD44 ezrin association and directional cell motility. Nat Cell Biol. 2002;27:399–407. doi: 10.1038/ncb797. [DOI] [PubMed] [Google Scholar]
- 44.Parsons M, Keppler MD, Kline A, et al. Site-directed perturbation of PKC-integrin interaction blocks carcinoma cell chemotaxis. Mol Cell Biol. 2002;22:5897–5911. doi: 10.1128/MCB.22.16.5897-5911.2002. [DOI] [PMC free article] [PubMed] [Google Scholar]
- 45.Ng T, Parsons M, Hughes WE, et al. Ezrin is a downstream effector of trafficking PKC-integrin complexes involved in the control of cell motility. Embo J. 2001;20:2723–2741. doi: 10.1093/emboj/20.11.2723. [DOI] [PMC free article] [PubMed] [Google Scholar]
- 46.Peter M, Ameer-Beg SM, Hughes MK, et al. Multiphoton-FLIM quantification of the EGFP-mRFP1 FRET pair for localization of membrane receptor-kinase interactions. Biophys J. 2005;88:1224–1237. doi: 10.1529/biophysj.104.050153. [DOI] [PMC free article] [PubMed] [Google Scholar]
- 47.Prag S, Parsons M, Keppler MD, et al. Activated ezrin promotes cell migration through recruitment of the GEF Dbl to lipid rafts and preferential downstream activation of Cdc42. Mol Biol Cell. 2007;18:2935–2948. doi: 10.1091/mbc.E06-11-1031. [DOI] [PMC free article] [PubMed] [Google Scholar]
- 48.Avizienyte E, Keppler M, Sandilands E, et al. An active Src kinase-beta-actin association is linked to actin dynamics at the periphery of colon cancer cells. Exp Cell Res. 2007;313:3175–3188. doi: 10.1016/j.yexcr.2007.04.037. [DOI] [PubMed] [Google Scholar]
- 49.Carvalho RF, Beutler M, Marler KJ, et al. Silencing of EphA3 through a cis interaction with ephrinA5. Nat Neurosci. 2006;9:322–330. doi: 10.1038/nn1655. [DOI] [PubMed] [Google Scholar]
- 50.Offterdinger M, Bastiaens PI. Prolonged Egfr signalling by Erbb2-mediated sequestration at the plasma membrane. Traffic. 2008;9(1):147–155. doi: 10.1111/j.1600-0854.2007.00665.x. [DOI] [PubMed] [Google Scholar]
- 51.Haj FG, Verveer PJ, Squire A, et al. Imaging sites of receptor dephosphorylation by PTP1B on the surface of the endoplasmic reticulum. Science. 2002;295:1708–1711. doi: 10.1126/science.1067566. [DOI] [PubMed] [Google Scholar]
- 52.Keese M, Magdeburg RJ, Herzog T, et al. Imaging epidermal growth factor receptor phosphorylation in human colorectal cancer cells and human tissues. J Biol Chem. 2005;280:27826–27831. doi: 10.1074/jbc.M504485200. [DOI] [PubMed] [Google Scholar]
- 53.Kong A, Leboucher P, Leek R, et al. Prognostic value of an activation state marker for epidermal growth factor receptor in tissue microarrays of head and neck cancer. Cancer Res. 2006;66:2834–2843. doi: 10.1158/0008-5472.CAN-05-2994. [DOI] [PubMed] [Google Scholar]
- 54.Bolte S, Cordelieres FP. A guided tour into subcellular colocalization analysis in light microscopy. J Microsc. 2006;224:213–232. doi: 10.1111/j.1365-2818.2006.01706.x. [DOI] [PubMed] [Google Scholar]
- 55.Esposito A, Dohm CP, Bahr M, Wouters FS. Unsupervised fluorescence lifetime imaging microscopy for high content and high throughput screening. Mol Cell Proteomics. 2007;6:1446–1454. doi: 10.1074/mcp.T700006-MCP200. [DOI] [PubMed] [Google Scholar]
- 56.Barber PR, Ameer-Beg SM, Gilbey J, et al. Multiphoton time-domain fluorescence lifetime imaging microscopy: practical application to protein-protein interactions using global analysis. J Royal Society Interface. 2009;6:S93–S105. doi: 10.1098/rsif.2008.0451.focus. [DOI] [Google Scholar]
- 57.Esposito A, Gerritsen HC, Wouters FS. Fluorescence lifetime heterogeneity resolution in the frequency domain by lifetime moments analysis. Biophys J. 2005;89:4286–4299. doi: 10.1529/biophysj.104.053397. [DOI] [PMC free article] [PubMed] [Google Scholar]
- 58.Schlachter S, Elder AD, Esposito A, et al. mhFLIM: resolution of heterogeneous fluorescence decays in widefield lifetime microscopy. Opt Express. 2009;17:1557–1570. doi: 10.1364/OE.17.001557. [DOI] [PubMed] [Google Scholar]
- 59.Grecco HE, Roda-Navarro P, Verveer PJ. Global analysis of time correlated single photon counting FRET-FLIM data. Opt Express. 2009;17:6493–6508. doi: 10.1364/OE.17.006493. [DOI] [PubMed] [Google Scholar]
- 60.Digman MA, Caiolfa VR, Zamai M, Gratton E. The phasor approach to fluorescence lifetime imaging analysis. Biophys J. 2008;94:L14–16. doi: 10.1529/biophysj.107.120154. [DOI] [PMC free article] [PubMed] [Google Scholar]
- 61.Freund Y, Schapire RE. Large margin classification using the perceptron algorithm. Machine Learning. 1999;37:277–296. doi: 10.1023/A:1007662407062. [DOI] [Google Scholar]
- 62.Hamalainen T, Klapuri H, Saarinen J, Kaski K. Mapping of SOM and LVQ algorithms on a tree shape parallel computer system. Parallel Comput. 1997;23:271–289. doi: 10.1016/S0167-8191(97)00020-3. [DOI] [Google Scholar]
- 63.Smith I, Procter M, Gelber RD, et al. 2-year follow-up of trastuzumab after adjuvant chemotherapy in HER2-positive breast cancer: a randomised controlled trial. Lancet. 2007;369:29–36. doi: 10.1016/S0140-6736(07)60028-2. [DOI] [PubMed] [Google Scholar]
- 64.Holbro T, Beerli RR, Maurer F, et al. The ErbB2/ErbB3 heterodimer functions as an oncogenic unit: ErbB2 requires ErbB3 to drive breast tumor cell proliferation. Proc Natl Acad Sci U S A. 2003;100:8933–8938. doi: 10.1073/pnas.1537685100. [DOI] [PMC free article] [PubMed] [Google Scholar]
- 65.Cao Z, Wu X, Yen L, et al. Neuregulin-induced ErbB3 downregulation is mediated by a protein stability cascade involving the E3 ubiquitin ligase Nrdp1. Mol Cell Biol. 2007;27:2180–2188. doi: 10.1128/MCB.01245-06. [DOI] [PMC free article] [PubMed] [Google Scholar]
- 66.Scaltriti M, Verma C, Guzman M, et al. Lapatinib, a HER2 tyrosine kinase inhibitor, induces stabilization and accumulation of HER2 and potentiates trastuzumab-dependent cell cytotoxicity. Oncogene. 2009;28:803–814. doi: 10.1038/onc.2008.432. [DOI] [PubMed] [Google Scholar]
- 67.Nakamura T, Aoki K, Matsuda M. Monitoring spatio-temporal regulation of Ras and Rho GTPase with GFP-based FRET probes. Methods. 2005;37:146–153. doi: 10.1016/j.ymeth.2005.05.021. [DOI] [PubMed] [Google Scholar]
- 68.Miyawaki A. Visualization of the spatial and temporal dynamics of intracellular signaling. Dev Cell. 2003;4:295–305. doi: 10.1016/S1534-5807(03)00060-1. [DOI] [PubMed] [Google Scholar]
- 69.Li S, Xia X, Zhang X, Suen J. Regression of tumors by IFN-alpha electroporation gene therapy and analysis of the responsible genes by cDNA array. Gene Ther. 2002;9:390–397. doi: 10.1038/sj.gt.3301645. [DOI] [PubMed] [Google Scholar]
- 70.Itoh RE, Kurokawa K, Ohba Y, et al. Activation of rac and cdc42 video imaged by fluorescent resonance energy transfer-based single-molecule probes in the membrane of living cells. Mol Cell Biol. 2002;22:6582–6591. doi: 10.1128/MCB.22.18.6582-6591.2002. [DOI] [PMC free article] [PubMed] [Google Scholar]
- 71.Wouters FS, Verveer PJ, Bastiaens PI. Imaging biochemistry inside cells. Trends Cell Biol. 2001;11:203–211. doi: 10.1016/S0962-8924(01)01982-1. [DOI] [PubMed] [Google Scholar]
- 72.Sahai E. Illuminating the metastatic process. Nat Rev Cancer. 2007;7:737–749. doi: 10.1038/nrc2229. [DOI] [PubMed] [Google Scholar]
- 73.DiMasi JA, Hansen RW, Grabowski HG. The price of innovation: new estimates of drug development costs. J Health Econ. 2003;22:151–185. doi: 10.1016/S0167-6296(02)00126-1. [DOI] [PubMed] [Google Scholar]
- 74.Fukuoka M, Yano S, Giaccone G, et al. Multi-institutional randomized phase II trial of gefitinib for previously treated patients with advanced non-small-cell lung cancer (The IDEAL 1 Trial) [corrected] J Clin Oncol. 2003;21:2237–2246. doi: 10.1200/JCO.2003.10.038. [DOI] [PubMed] [Google Scholar]
- 75.Cohen EE, Rosen F, Stadler WM, et al. Phase II trial of ZD1839 in recurrent or metastatic squamous cell carcinoma of the head and neck. J Clin Oncol. 2003;21:1980–1987. doi: 10.1200/JCO.2003.10.051. [DOI] [PubMed] [Google Scholar]
- 76.Saltz LB, Meropol NJ, Loehrer PJ, Sr, et al. Phase II trial of cetuximab in patients with refractory colorectal cancer that expresses the epidermal growth factor receptor. J Clin Oncol. 2004;22:1201–1208. doi: 10.1200/JCO.2004.10.182. [DOI] [PubMed] [Google Scholar]
- 77.Perez-Soler R, Chachoua A, Hammond LA, et al. Determinants of tumor response and survival with erlotinib in patients with non-small-cell lung cancer. J Clin Oncol. 2004;22:3238–3247. doi: 10.1200/JCO.2004.11.057. [DOI] [PubMed] [Google Scholar]
- 78.Denk W, Strickler JH, Webb WW. Two-photon laser scanning fluorescence microscopy. Science. 1990;248:73–76. doi: 10.1126/science.2321027. [DOI] [PubMed] [Google Scholar]
- 79.Centonze VE, White JG. Multiphoton excitation provides optical sections from deeper within scattering specimens than confocal imaging. Biophys J. 1998;75:2015–2024. doi: 10.1016/S0006-3495(98)77643-X. [DOI] [PMC free article] [PubMed] [Google Scholar]
- 80.Theer P, Hasan MT, Denk W. Two-photon imaging to a depth of 1000 µm in living brains by use of a Ti:Al2O3 regenerative amplifier. Optics Letters. 2003;28:1022–1024. doi: 10.1364/OL.28.001022. [DOI] [PubMed] [Google Scholar]
- 81.Helmchen F, Denk W. New developments in multiphoton microscopy. Curr Opin Neurobiol. 2002;12:593–601. doi: 10.1016/S0959-4388(02)00362-8. [DOI] [PubMed] [Google Scholar]
- 82.Bousso P, Robey EA. Dynamic behavior of T cells and thymocytes in lymphoid organs as revealed by two-photon microscopy. Immunity. 2004;21:349–355. doi: 10.1016/j.immuni.2004.08.005. [DOI] [PubMed] [Google Scholar]
- 83.Rubart M. Two-photon microscopy of cells and tissue. Circ Res. 2004;95:1154–1166. doi: 10.1161/01.RES.0000150593.30324.42. [DOI] [PubMed] [Google Scholar]
- 84.Laiho LH, Pelet S, Hancewicz TM, et al. Two-photon 3-D mapping of ex vivo human skin endogenous fluorescence species based on fluorescence emission spectra. J Biomed Optics. 2005;10:024016–024010. doi: 10.1117/1.1891370. [DOI] [PubMed] [Google Scholar]
- 85.Molitoris BA, Sandoval RM. Intravital multiphoton microscopy of dynamic renal processes. AJP — Renal Physiology. 2005;288:F1084–F1089. doi: 10.1152/ajprenal.00473.2004. [DOI] [PubMed] [Google Scholar]
- 86.Freund I, Deutsch M, Sprecher A. Connective tissue polarity. Optical second-harmonic microscopy, crossed-beam summation, and small-angle scattering in rat-tail tendon. Biophys J. 1986;50:693–712. doi: 10.1016/S0006-3495(86)83510-X. [DOI] [PMC free article] [PubMed] [Google Scholar]
- 87.Mohler W, Millard AC, Campagnola PJ. Second harmonic generation imaging of endogenous structural proteins. Methods. 2003;29:97–109. doi: 10.1016/S1046-2023(02)00292-X. [DOI] [PubMed] [Google Scholar]
- 88.Wyckoff JB, Pinner SE, Gschmeissner S, et al. ROCK- and myosin-dependent matrix deformation enables protease-independent tumor-cell invasion in vivo. Curr Biol. 2006;16:1515–1523. doi: 10.1016/j.cub.2006.05.065. [DOI] [PubMed] [Google Scholar]
- 89.Brown E, McKee T, diTomaso E, et al. Dynamic imaging of collagen and its modulation in tumors in vivo using second-harmonic generation. Nat Med. 2003;9:796–800. doi: 10.1038/nm879. [DOI] [PubMed] [Google Scholar]
- 90.Sorlie T, Perou CM, Tibshirani R, et al. Gene expression patterns of breast carcinomas distinguish tumor subclasses with clinical implications. Proc Natl Acad Sci U S A. 2001;98:10869–10874. doi: 10.1073/pnas.191367098. [DOI] [PMC free article] [PubMed] [Google Scholar]
- 91.Tozer GM, Ameer-beg SM, Baker J, et al. Intravital imaging of tumor vascular networks using multi-photon fluorescence microscopy. Adv drug deliv rev. 2005;57:135–152. doi: 10.1016/j.addr.2004.07.015. [DOI] [PubMed] [Google Scholar]
- 92.Tozer GM, Prise VE, Wilson J, et al. Mechanisms associated with tumor vascular shut-down induced by combretastatin A-4 phosphate: intravital microscopy and measurement of vascular permeability. Cancer Res. 2001;61:6413–6422. [PubMed] [Google Scholar]
- 93.Serganova I, Doubrovin M, Vider J, et al. Molecular imaging of temporal dynamics and spatial heterogeneity of hypoxia-inducible factor-1 signal transduction activity in tumors in living mice. Cancer Res. 2004;64:6101–6108. doi: 10.1158/0008-5472.CAN-04-0842. [DOI] [PubMed] [Google Scholar]
- 94.Tong RT, Boucher Y, Kozin SV, et al. Vascular normalization by vascular endothelial growth factor receptor 2 blockade induces a pressure gradient across the vasculature and improves drug penetration in tumors. Cancer Res. 2004;64:3731–3736. doi: 10.1158/0008-5472.CAN-04-0074. [DOI] [PubMed] [Google Scholar]
- 95.Winkler F, Kozin SV, Tong RT, et al. Kinetics of vascular normalization by VEGFR2 blockade governs brain tumor response to radiation: Role of oxygenation, angiopoietin-1, and matrix metalloproteinases. Cancer Cell. 2004;6:553–563. doi: 10.1016/j.ccr.2004.10.011. [DOI] [PubMed] [Google Scholar]
- 96.Fruhwirth GO, Matthews DR, Brock A et al (2009) Deep-tissue multiphoton fluorescence lifetime microscopy for intravital imaging of protein-protein interactions. In Periasamy A, So PTC (eds): SPIE BIOS/Photonics West 2009. San Jose, CA, USA: SPIE:71830 L–71839
- 97.Keiichi Koizumi Shtakyis Chemokine receptors in cancer metastasis and cancer cell-derived chemokines in host immune response. Cancer Science. 2007;98:1652–1658. doi: 10.1111/j.1349-7006.2007.00606.x. [DOI] [PMC free article] [PubMed] [Google Scholar]
- 98.Zlotnik A. New insights on the role of CXCR4 in cancer metastasis. J Path. 2008;215:211–213. doi: 10.1002/path.2350. [DOI] [PubMed] [Google Scholar]
- 99.Abd El-Rehim DM, Ball G, Pinder SE, et al. High-throughput protein expression analysis using tissue microarray technology of a large well-characterized series identifies biologically distinct classes of breast cancer confirming recent cDNA expression analyses. Int J Cancer. 2005;116:340–350. doi: 10.1002/ijc.21004. [DOI] [PubMed] [Google Scholar]