

Abstract
Introduction
The HIV/AIDS epidemic in St Petersburg, as in much of Russia, is concentrated among injection drug users (IDU) in whom prevalence reached 30% in 2003. Understanding the dynamics of the epidemic is important in developing appropriate responses in the resource-constrained context of Russian cities such as St Petersburg.
Methods
IDU were contacted and screened to create a seronegative cohort for prevention and vaccine studies. At screening, individuals provided sociodemographic, drug use, and injection and sex-related risk behavior data. Seronegative individuals who enrolled in the cohort were followed for one year and tested for HIV semiannually. Residential addresses were entered into a geographical information system programme and analysed for spatial clustering using Moran’s I and nearest-neighbor analysis.
Results
We mapped 788 of the 900 study participants to discrete locations within St Petersburg; 236 (29.9%) were HIV seropositive at baseline. Although there was no clustering of the study population as a whole, HIV-infected individuals were tightly clustered and prevalence co-clustered with high frequency of heroin injection, receptive syringe sharing, being younger than 24 years, and living with parents. These clusters were restricted to 5% of populated areas of the city. We mapped 18 of 20 incident cases detected among the cohort, and more than half were located within or adjacent to the clusters.
Interpretation
Spatial analysis identified linkages between disease prevalence and risky injection behaviors that were not evident using traditional epidemiological analysis. The analysis also identified where resources might be allocated geographically for maximum impact in slowing the HIV epidemic among IDU.
Keywords: geographical information systems, harm reduction, HIV/AIDS, injection drug use
Introduction
The Russian Federation has witnessed one of the fastest growing HIVepidemics in the world over the past decade [1–3]. The number of registered HIV infections has increased from 1090 at the end of 1995 to more than 330 000 by the end 2005. The city of St Petersburg has been particularly hard hit. By the end of 2005, nearly 29 000 infections had been recorded among its residents, the most for any of the 90 administrative regions within Russia. As is true elsewhere in Russia, most of the HIV infections have occurred in individuals who reported engaging in injection drug abuse. From 1996 to 2001, as many as 90% of infections were attributed to injection drug use [2,4]. During the 2 years covered by this study, 2002–2003, 72 and 54% of newly reported HIV infections were in individuals reporting injection drug use; similar percentages were found for 2004 and 2005, 65 and 66%, respectively [5]. To understand and control the HIV epidemic in places such as St Petersburg it is vital to understand how it is continuing to spread among injectors.
In 2002, we began a study to collect data from active drug injectors in order to recruit a sample of at least 500 individuals into a cohort to determine HIV seroincidence. A total of 900 individuals were screened for HIV based on meeting the study criteria for active injection drug use and 270 (30.0%) were found to be HIV positive [6]. Analysis of the baseline data to identify factors associated with seroprevalence found no significant associations of behavioral risk factors with prevalence, and the only significant association of prevalence with demographic factors was being younger, but the difference in mean and median age between the two groups was only approximately one year. Of those who were seronegative, 520 enrolled in the cohort study, agreeing to make two semi-annual visits for repeat testing. Despite the provision of HIV risk-reduction counseling and free medical care, 20 infections were detected among the 80% who were retained in the cohort, an annualized incidence rate of 4·5 per 100 person-years of exposure [7]. Analysis of data collected from cohort members who returned for follow-up found only one significant risk factor associated with seroconversion, the injection of ephedrine-derived psychostimulants. We were unable to find a common thread that united existing and emergent infections in our study population.
To generate a more sophisticated analysis of the spread of HIVamong drug injectors in St Petersburg, we undertook a spatial analysis of the prevalent and incident HIV infection. We were able to geolocate 788 of the 900 individuals screened using the home addresses provided at screening. This analysis represents a unique example of the power of spatial analysis to integrate otherwise unrelated factors to create a unified picture of an HIV epidemic in a city and to provide the necessary documentation for a rational public health response that will confront the HIV epidemic where it is most expansive and relevant.
Methods
Cohort recruitment and HIV testing
As part of the HIV Prevention Trials Network (HPTN) Protocol 033 that assessed seroincidence in four sites with burgeoning HIV epidemics driven in significant measure by injection drug use, 900 active injection drug users (IDU) in St Petersburg, Russia, were recruited, interviewed, and tested for HIV between January and December 2002. Individuals were tested using the Vironostika HIV-Uni-Form II plus O enzyme-linked immunosorbent assay (BioMerieux, the Netherlands) and positive test results were confirmed by Western blot (New Lav Blot 1; Bio-Rad Laboratories, France). Of these, 520 who tested seronegative were entered into a cohort to be followed for one year to detect new HIV infections. Individuals were provided risk reduction counseling appropriate to their test results, offered free primary healthcare, and compensated with gifts valued at approximately US$5 for each study visit. Follow-up visits were scheduled semi-annually. The protocols for recruitment, testing and counseling, and follow-up were approved by institutional review boards at the University of North Carolina and the Biomedical Center, St Petersburg.
Collection of demographic and behavioral data
Data were collected at baseline using an interview questionnaire common to all four HPTN033 sites. Drug use questions focused on drugs injected lifetime and the past 30 days, injection frequency, and injection risk behaviors, including syringe and non-syringe paraphernalia sharing. Sexual risk was investigated through questions concerning lifetime and past 6 month behaviors. Locator information was collected from each of the 900 participants in the form of their residential address.
Spatial analysis
Spatial analysis was initiated by geolocating residential addresses of respondents using St Petersburg city electronic maps (Institute of Applied Geography, St Petersburg, Russian Federation). Of 900 addresses in the original survey, 112 locations were outside of the area of study, could not be located, or could not be unambiguously mapped. The remaining 788 locations within St Petersburg were mapped using ArcGIS 9.1 (ESRI Corp., Redlands, California, USA). We confirmed that all addresses were located within residential areas and not at non-residential locations such as rail yards or industrial areas.
We then explored the data for significant spatial clustering of demographic and HIV risk behaviors. Spatial analysis, as applied in this study, is derived from earlier efforts to formalize exploratory data analysis [8]. The availability of geographic information systems software has facilitated this process. Spatial autocorrelation, i.e. the correlation of a single variable between pairs of neighboring observations, is the central concept of this form of exploratory data analysis [9]. The term ‘neighboring observation’ is user-defined by creating a contiguity or distance matrix in which the correlation between neighbors is compared with the general variance of the sample as in ordinary correlation analysis. Moran introduced what is now the standard measure of spatial autocorrelation, ‘Moran’s I’ [10]. It estimates the strength of correlation between observations as a function of the distance separating them. CRIMESTAT III software employed in this study calculates Moran’s I using the following equation:
where σ2 is the sample variance and Wij is the proximity matrix [11]. Proximity matrix values are 1 only for those locations i and j that are contiguous, all other values are zero. Similar to Pearson’s correlation coefficient, the values of Moran’s I range from +1 (indicating strong autocorrelation) through 0 (indicating a random pattern) to -1 (indicating over-dispersion and uniformity). Oliveau [9] noted that strong negative values are extremely unusual in demographic and social science data. The CRIMESTAT III algorithm assigns a P value to the calculated Moran’s I value permitting inference as to the degree and significance of spatial clustering compared with an expected random value.
Clusters were identified using nearest-neighbor analysis, a single linkage, hierarchical method in CRIMESTAT III [11]. It uses a constant-distance clustering routine that groups points together on the basis of spatial proximity [12]. The user defines a threshold distance and the minimum number of points that are required for each cluster, and an output size for displaying the clusters with ellipses. The routine identifies first-order clusters, representing groups of points that are closer together than the threshold distance and in which there is at least the minimum number of points specified by the user. Clustering is hierarchical in that the first-order clusters are treated as separate points to be clustered into second-order clusters, and second-order clusters are treated as separate points to be clustered into third-order clusters, and so on. Higher-order clusters are identified only if the distance between their centers is closer than the new threshold distance [11]. In this application only first order clusters were used because no significant higher order clusters were found. In this application we set the minimum number of points to be included in a cluster at 40, the threshold distance to one kilometer for all variables, and the alpha value to 0.05.
Results were graphically displayed as ellipses by exporting ArcGIS shape flies generated in CRIMESTAT III to ArcGIS. Ellipse size was set at one standard deviational ellipse of the cluster (the rotation and the lengths of the X and Y axes) because this specification allowed us to exclude non-residential areas of the city such as rail yards and waterways, yet maintain the statistical significance of clusters contained within known residential areas.
The residential areas within St Petersburg are not randomly arranged, and therefore we used a programme called HawthTools to generate random points in continuous space within the polygons of residential areas [13]. The tool generates points with a uniform distribution for x and y coordinates in the larger spatial domain of interest, which in our case was the residential districts of the city of St Petersburg. HawthTools then determines whether to keep each point based on whether or not it falls within the polygons of interest. The randomly generated points were analysed to exclude the possibility that random points in the residential areas would be clustered because of the configuration of these areas.
Results
We determined that even though the residential areas of St Petersburg have a discrete spatial organization, it was possible to distribute points randomly equivalent to the number of study participants throughout these areas without significant clustering. We then mapped the spatial distribution of the 788 residential addresses within St Petersburg. These were distributed throughout St Petersburg in a pattern more closely resembling random than clustered (Moran’s I=0.049, P>0.1).
Individuals were recruited using different methods at different stages of the one-year recruitment period [6], and therefore we explored the influence of recruitment order on the spatial distribution of individuals recruited into the study. The first 160 geocoded individuals were recruited primarily by venue-based sampling, identifying active IDU at drug treatment programmes. The next 320 geocoded individuals were recruited through a combination of location-based screening, street outreach, and chain referrals from existing participants. Thereafter, chain referral was the predominant method of recruitment. Significant clustering was observed after the recruitment of 160, 320, 480, and 640 individuals, a finding in keeping with the reliance on location-based sampling methods at the outset of the study (Table 1). A pattern more closely resembling random emerged after all individuals were recruited (Fig. 1).
TABLE 1.
GEOGRAPHIC DISTRIBUTION OF INJECTION DRUG USERS IN ST. PETERSBURG AS A FUNCTION OF RECRUITMENT ORDER
| NUMBER MAPPED* | MORAN’S I | P VALUE OF SPATIAL CLUSTERING |
|---|---|---|
| First 160 | 0·078 ± 0·012 | <0·001 |
| First 320 | 0·153 ± 0·012 | <0·0001 |
| First 480 | 0·132 ± 0·012 | <0·0001 |
| First 640 | 0·057 ± 0·012 | <0·01 |
| All 788 | 0·048 ± 0·012 | NS |
The Moran’s I values were calculated by comparison to 900 points generated randomly within the residential areas of St. Petersburg.
Fig. 1. Distribution of injection drug users screened at baseline whose residential address within St Petersburg could be determined (N=788) as a function of the order of recruitment.
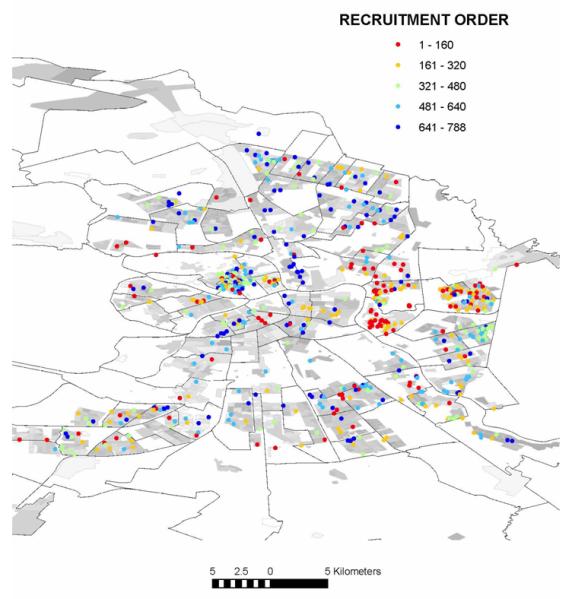
Recruitment order  1–160;
  161–320;
  321–480;
  481–640;
  641–788.
In contrast, the locations of residence for individuals with prevalent HIV infection were found to be strongly clustered (Fig. 2a, Table 2). Four spatial clusters within the city were found to contain 72 of the 236 mapped cases. Clustering was also detected for several of the injection practices. Almost all injectors reported injecting heroin; only 35 of 900 (3.9%) reported not doing so in the month before their baseline interview. Individuals injecting heroin three or more times per week (N=307) were more likely to reside in one of five clusters (Fig. 2b, Table 2). Psychostimulant injection was reported by 299 individuals (37.9%). These injectors were not significantly clustered (Table 2). Injectors who reported frequent (N=603) or daily (N=35) receptive sharing of syringes were likely to reside within four clusters compared with those who did not report sharing (Fig. 2c, Table 2). None of the risky sexual behaviors addressed in the risk assessment survey was significantly clustered. Of the sociodemographic factors covered in the questionnaire, only living with parents and being less than 24 years of age were geographically clustered (Fig. 2d, Table 2).
Fig. 2. Distribution and significant spatial clustering of serological, behavioral, and demographic variables.
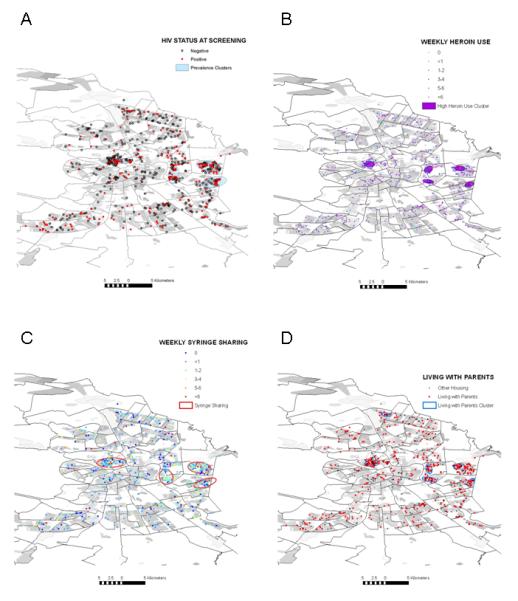
(a) HIV prevalence; (b) High frequency of heroin injection; (c) Receptive syringe sharing; and (d) Residing with parents.
TABLE 2.
SPATIAL DISTRIBUTION OF DEMOGRAPHIC AND BEHAVIORAL CHARACTERISTICS OF INJECTION DRUG USERS IN ST. PETERSBURG
| Moran’s I ± s. d. Expected I = -0·001271 |
p Value for Clustering |
Area of Clustering, in km2 (% of Populated Area) |
|
|---|---|---|---|
| HIV Seropositives (N = 236) | 0·075 ± 0·030 | <0·01 | 15·30 (4·1%) |
| HIV Incidence (N = 18) | NS | ||
| Age <24 years (N = 394) | 0·117 ± 0·030 | <0·0001 | 1·10 (0·3 %) |
| High Frequency Injectors (N = 307/788) | 0·099 ± 0·030 | <0·001 | 4·56 (1·2%) |
| Stimulant Injection (N =299/788) | 0·004 ± 0·030 | NS | |
| Receptive Syringe Sharing (N = 603/788) | 0·070 ± 0·030 | <0.05 | 16·99 (4·6%) |
| Sex for Drug or Money (N = 68 / 227) | 0·009 ± 0·101 | NS | |
| Employed (N = 351/788) | -0·023 ± 0·030 | NS | |
| Living with Parents (N = 502/788) | 0·0763 ± 0·030 | <0·05 | 6·58 (1·8%) |
The results from spatial analysis were compared with results from standard pairwise bivariate analysis to detect correlations between these five factors. As previously reported, younger age and HIV prevalence were correlated [6]. Heroin frequency and needle sharing frequency were correlated, but neither was correlated with HIV prevalence. Living with parents and being younger than 24 years were correlated, but living with parents is not correlated with HIV prevalence and neither was correlated with injection frequency or syringe sharing.
The significant clusters were confined to small regions within the residential regions of the city, which covers 37.13 square kilometers of the 144.27 square kilometers of land within the city limits. The total cluster size for the four significantly clustering variables, HIV prevalence, living with parents, high heroin injection frequency, and receptive syringe sharing, ranged from 0.3 to 4.6% of the total populated area (Table 2). As is evident in Fig. 3, many of these clusters overlapped. The most significant overlaps were located near the Sitniy market on Petrograd Island and surrounding the Ladozhskaya metro stop on the east side of the Neva River.
Fig. 3. Co-clustering of serological, behavioral, and demographic variables.
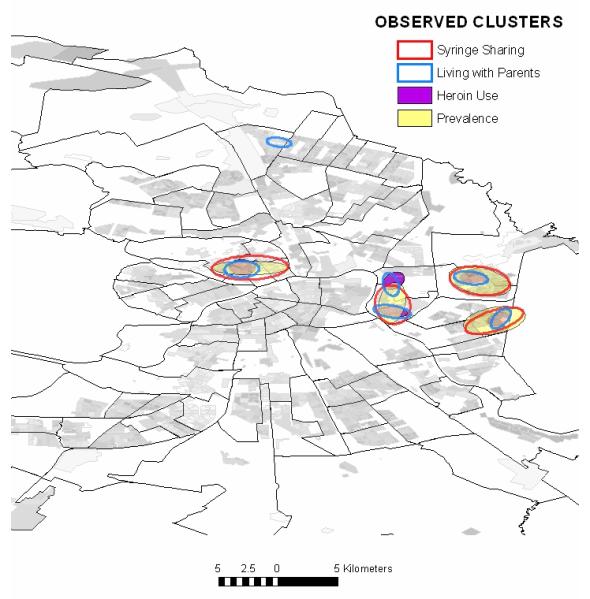
Observed clusters:  Syringe sharing;
  living with parents;
  heroin use;
  prevalence.
We were able to map residences for 18 of the 20 individuals who became infected with HIV while enrolled in the study. These incident cases were themselves not significantly clustered, a finding not surprising because there are so few observations. Nevertheless, 12 of the 18 were located in or near one or more of the clusters. Ten were located in the overlap of at least three clusters, six in the Sitniy cluster and four in the East Neva cluster (Fig. 4).
Fig. 4. Distribution of incident HIV cases within spatial clusters (a) adjacent to the Sitniy market on Petrogradskaya Island and (b) east of the Ladozhskaya metro stop on the east bank of the Neva River.
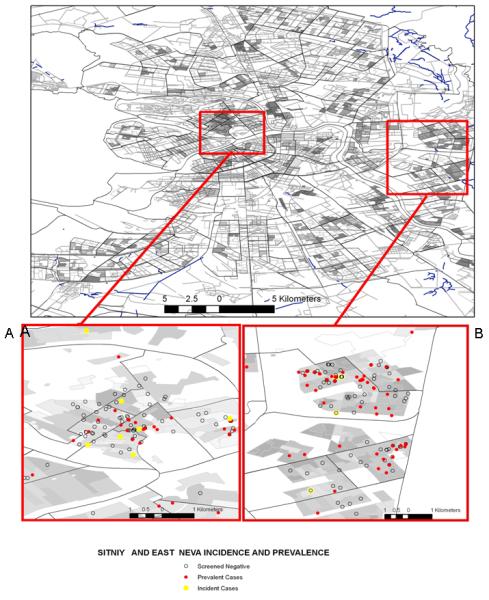
Sitniy and East Neva incidence and prevalence. ○ Screened negative;  prevalent cases;
  incident cases.
Discussion
The analysis presented in this report is a unique combination of spatial, demographic, behavioral, and biological data. Previous published work employing spatial analysis of HIV infection has combined two or three of these elements to look at the distributions of HIV and the association with sociodemiographic factors (e.g. economic status of a community), physical factors (e.g. roads or healthcare facilities), or co-infections (e.g. Leishmania or malaria) [14-18]. A geographical information system has been used to map samples of drug users, but published work has been limited to describing the distribution of drug use or study participation in cities [19,20]. Geographical proximity to syringe exchange programmes and its association with an increased likelihood of programme use and reduced syringe sharing was the object of one study [21]. Only one study has been published that linked the geographical distribution of HIV prevalence and transmission risk factors [22]. Similarly, studies of the geographical distributions of tuberculosis or sexually transmitted infections have not added both sociodemographic and behavioral variables to the analysis simultaneously [23-26].
Our study demonstrates the power of the spatial approach, because it is only with the addition of geographical data that the relationships among HIV prevalence, frequent and unsafe injection, and incident infections become evident. Whereas a tight geographical clustering of risk and infection might be expected, it has not hitherto been demonstrated. Previous studies have shown geographical concentrations of HIV in poor and underserved communities and the dispersion of HIV along roads and highways [27-30]. Not all past studies found such a tight linkage; one study from the San Francisco Bay area using data collected in the late 1990s found that whereas HIV prevalence was indeed concentrated in poor neighborhoods, risky injection practices were, on average, greater among individuals who lived outside of these areas [31]. It was postulated that the emergence of syringe exchange and other harm reduction programmes targeting the poorer communities had resulted in lower risk by the time the study was collected but that prevalence in these communities remained high [32]. Harm reduction was not nearly as widespread or long established in St Petersburg in 2002, when the data for the present report were collected, as it was in the San Francisco Bay area in the late 1990s.
The current study has several limitations. First, the sample of 900 participants, although recruited using three different strategies, must be considered a convenience sample of the estimated 70 000 IDU in St Petersburg. It is thus impossible to determine whether the patterns and associations described in this report are true for the entire population of injectors in the city.
Second, much of the data including residential addresses and injection practices are self-reported. Providing an address was a requirement of the screening process and while many of the study participants were later contacted at the addresses they provided, we have no way of knowing what proportion of the participants gave false or misleading addresses. Third, not all of the 900 HPTN033 study participants are included in this analysis. We could not geocode the residential address for 69 participants, and another 53 lived outside the city and were excluded from our analysis. It is possible that the exclusion of these individuals unmasked correlations among those remaining observations. To exclude this possibility we compared those individuals we could (N=788) and could not (N=112) geocode to a St Petersburg residential address for all variables found to be significantly clustered (Table 3). There were no differences between these groups when it came to HIV prevalence, injection frequency, syringe sharing, and being younger than 24 years of age. Living with parents was significantly more common among those individuals with a valid St Petersburg residential address.
TABLE 3.
COMPARISON OF INDIVIDUALS WITH AND WITHOUT VALID ST. PETERSBURG RESIDENTIAL ADDRESSES
| Valid Address (N = 788) |
Invalid Addresses (N = 112) |
p value | |
|---|---|---|---|
| HIV Prevalence | 29.9% | 30.4% | NS |
| Heroin Injection, mean times per week | 4.06 | 4.46 | NS |
| Syringe Sharing, mean times per week | 2.36 | 2.43 | NS |
| Percent Living with Parents | 63.3% | 61.6% | NS |
| Percent <24 Years Old | 49.1% | 54.5% | NS |
Despite these limitations, the analysis revealed two important findings. First, the analysis demonstrated the inherent power of adding spatial analysis to traditional biobehavioral explorations of disease transmission. Whereas this idea is not novel, dating back to John Snow’s detection of the link between contaminated water supply and cholera in 1854, new tools for geographical analysis and spatial analysis have simplified the process. Second, the findings have serious implications for the efforts to curtail the HIV epidemic in St Petersburg. With more than 35 000 reported HIV infections city-wide and limited resources, this task might seem insurmountable. Our spatial analysis identified where the epidemic, incident and prevalent cases, were clustered and where behavioral risks such as high injection and syringe sharing frequencies were exacerbating transmission. These locations, covering a small, discrete area of the city, provide a manageable target for prevention programmes such as expanded access to syringe exchange, HIV counseling, testing, and care, and drug abuse treatment.
Acknowledgments
Sponsorship: This work was supported by a grant from the US National Institutes of Health (U01 A147987), as part of the HIV Prevention Trials Network (HPTN), to the University of North Carolina at Chapel Hill and the Biomedical Center, St Petersburg; by the Fogarty International Center (2D43 TW001028) as part of an AIDS International Training and Research Program, which provided training in HIV epidemiology and prevention research to many of the HPTN staff; and by the National Institute on Mental Health (5P30 MH062294) as part of the Yale Center on Interdisciplinary Research on AIDS, which provided support for R.H. and R.B. The US National Institutes of Health provided funding for the research activity, but did not participate in the study design development, collection, analysis or interpretation of data, in report writing or the decision to submit this paper for publication.
Footnotes
Conflicts of interest: None.
References
- 1.Hamers FF, Downs AM. HIV in central and eastern Europe. Lancet. 2003;361:1035–1044. doi: 10.1016/S0140-6736(03)12831-0. [DOI] [PubMed] [Google Scholar]
- 2.Rhodes T, Sarang A, Bobrik A, Bobkov A, Platt L. HIV transmission and HIV prevention associated with injecting drug use in the Russian Federation. Int J Drug Policy. 2004;15:1–16. [Google Scholar]
- 3.UNAIDS . The changing HIV/AIDS epidemic in Europe and central Asia. UNAIDS; Geneva, Switzerland: 2004. [Google Scholar]
- 4.Lowndes CM, Alary M, Platt L. Injection drug use, commercial sex work, and the HIV/STI epidemic in the Russian Federation. Sex Transm Dis. 2003;30:46–48. doi: 10.1097/00007435-200301000-00010. [DOI] [PubMed] [Google Scholar]
- 5.Volkova G. 2005 Information bulletin. St Petersburg City AIDS Center; St Petersburg, Russia: 2006. [Google Scholar]
- 6.Shaboltas AV, Toussova OV, Hoffman IF, Heimer R, Verevochkin S, Ryder R, et al. HIV prevalence, socio-demographic and behavioral correlates and recruitment methods among injection drug users in St Petersburg, Russia. J Acquir Immune Defic Syndr. 2006;41:657–663. doi: 10.1097/01.qai.0000220166.56866.22. [DOI] [PubMed] [Google Scholar]
- 7.Kozlov AP, Shaboltas AV, Toussova OV, Verevochkin SV, Masse BR, Perdue T, et al. HIV incidence and factors associated with HIV acquisition among injection drug users in St Petersburg, Russia. AIDS. 2006;20:901–906. doi: 10.1097/01.aids.0000218555.36661.9c. [DOI] [PubMed] [Google Scholar]
- 8.Tukey JW. Exploratory data analysis. Addison-Wesley Co.; Reading, MA: 1977. [Google Scholar]
- 9.Oliveau S. Mapping out fertility in South India: methodology and results. In: Rajan SI, Guilmoto CZ, editors. Currents of demographic change in south India. Sage Press; New Delhi, India: 2004. [Google Scholar]
- 10.Moran PAP. Notes on continuous stochastic phenomena. Biometrika. 1950;37:17–23. [PubMed] [Google Scholar]
- 11.Levine N. CrimeStat III: a spatial statistics program for the analysis of crime incident locations. Ned Levine and Associates and the National Institute of Justice; Houston, TX; Washington, DC: 2004. [Google Scholar]
- 12.Aldenderfer MS, Blashfield RK. Cluster Analysis. Sage Publications, Inc.; Newbury Park, CA: 1984. [Google Scholar]
- 13.Beyer H. Hawth’s analysis tools for ArcGIS. SpatialEcology Co.; Glasgow, Scotland, UK: 2006. Generate random points tool. [Google Scholar]
- 14.Bastos FI, Barcellos C, Lowndes CM, Friedman SR. Co-infection with malaria and HIV in injecting drug users in Brazil: a new challenge to public health? Addiction. 1999;94:1165–1174. doi: 10.1046/j.1360-0443.1999.94811656.x. [DOI] [PubMed] [Google Scholar]
- 15.Desjeux P, Alvar J. Leishmania/HIV co-infections: epidemiology in Europe. Ann Trop Med Parasitol. 2003;97(Suppl 1):3–15. doi: 10.1179/000349803225002499. [DOI] [PubMed] [Google Scholar]
- 16.Fulcher C, Kaukinen C. Mapping and visualizing the location HIV service providers: an exploratory spatial analysis of Toronto neighborhoods. AIDS Care. 2005;17:386–396. doi: 10.1080/09540120512331314312. [DOI] [PubMed] [Google Scholar]
- 17.Noor AM, Amin AA, Gething PW, Atkinson PM, Hay SI, Snow RW. Modelling distances travelled to government health services in Kenya. Trop Med Int Health. 2006;11:188–196. doi: 10.1111/j.1365-3156.2005.01555.x. [DOI] [PMC free article] [PubMed] [Google Scholar]
- 18.Shaikh N, Abdullah F, Lombard CJ, Smit L, Bradshaw D, Makubalo L. Masking through averages — intraprovincial heterogeneity in HIV prevalence within the Western Cape. South Afr Med J. 2006;96:538–543. [PubMed] [Google Scholar]
- 19.Latkin C, Glass GE, Duncan T. Using geographic information systems to assess spatial patterns of drug use, selection bias and attrition among a sample of injection drug users. Drug Alcohol Depend. 1998;50:167–175. doi: 10.1016/s0376-8716(98)00025-8. [DOI] [PubMed] [Google Scholar]
- 20.Muth SQ, Potterat JJ, Rothenberg RB. Birds of a feather: using a rotational box plot to assess ascertainment bias. Int J Epidemiol. 2000;29:899–904. doi: 10.1093/ije/29.5.899. [DOI] [PubMed] [Google Scholar]
- 21.Rockwell R, Des Jarlais DC, Friedman SR, Perlis TE, Paone D. Geographic proximity, policy and utilization of syringe exchange programmes. AIDS Care. 1999;11:437–442. doi: 10.1080/09540129947811. [DOI] [PubMed] [Google Scholar]
- 22.Tomazelli J, Czeresnia D, Barcellos C. Distribution of AIDS cases in women in Rio de Janeiro, Brazil, 1982–1997: a spatial analysis [in Portuguese] Cadernos Saude Pub. 2003;19:1049–1061. doi: 10.1590/s0102-311x2003000400027. [DOI] [PubMed] [Google Scholar]
- 23.Becker KM, Glass GE, Brathwaite W, Zenilman JM. Geographic epidemiology of gonorrhea in Baltimore, Maryland, using a geographic information system. Am J Epidemiol. 1998;147:709–716. doi: 10.1093/oxfordjournals.aje.a009513. [DOI] [PubMed] [Google Scholar]
- 24.Kistemann T, Munzinger A, Dangendorf F. Spatial patterns of tuberculosis incidence in Cologne (Germany) Soc Sci Med. 2002;55:7–19. doi: 10.1016/s0277-9536(01)00216-7. [DOI] [PubMed] [Google Scholar]
- 25.Zenilman JM, Glass G, Shields T, Jenkins PR, Gaydos JC, McKee KTJ. Geographic epidemiology of gonorrhoea and chlamydia on a large military installation: application of a GIS system. Sex Transm Infect. 2002;78:40–44. doi: 10.1136/sti.78.1.40. [DOI] [PMC free article] [PubMed] [Google Scholar]
- 26.Serre ML, Christakos G, Leone PA, Miller WC. Spatial analysis and mapping of sexually transmitted diseases to optimise intervention and prevention strategies. Sex Transm Infect. 2004;80:294–299. doi: 10.1136/sti.2003.006700. [DOI] [PMC free article] [PubMed] [Google Scholar]
- 27.Watters JK, Bluthenthal RN, Kral AH. HIV seroprevalence in injection drug users. JAMA. 1995;273:1178. [PubMed] [Google Scholar]
- 28.Wallace R, Wallace D. U.S. apartheid and the spread of AIDS to the suburbs: a multicity analysis of the political economy of spatial epidemic threshold. Soc Sci Med. 1995;41:333–345. doi: 10.1016/0277-9536(94)00349-x. [DOI] [PubMed] [Google Scholar]
- 29.Adimora AA, Schoenbach VJ, Martinson FE, Donaldson KH, Fullilove RE, Aral SO. Social context of sexual relationships among rural African Americans. Sex Transm Dis. 2001;28:69–76. doi: 10.1097/00007435-200102000-00002. [DOI] [PubMed] [Google Scholar]
- 30.Wallace RG. AIDS in the HAART era: New York’s heterogeneous geography. Soc Sci Med. 2003;56:1155–1171. doi: 10.1016/s0277-9536(02)00121-1. [DOI] [PubMed] [Google Scholar]
- 31.Bluthenthal RN. Poverty, and disease: HIV/AIDS among African American injection drug users in the San Francisco Bay area. University of California, Berkeley; Berkeley, CA: 1998. [Google Scholar]
- 32.Bluthenthal RN. Syringe exchange as a social movement: a case study of harm reduction in Oakland, California. Subst Use Misuse. 1998;33:1147–1171. doi: 10.3109/10826089809062212. [DOI] [PubMed] [Google Scholar]