

Abstract
Objective
Hippocampal atrophy and reductions in basal cerebral blood volume (CBV), a hemodynamic correlate of brain function, occur with cognitive impairment in Alzheimer's disease but whether these are early or late changes remains unclear. Magnetic resonance imaging (MRI) assesses structure and function in the hippocampal formation. The objective of the present study was to estimate differences in the associations of hippocampus and entorhinal cortex volumes and CBV with memory function in early and late stages of cognitive impairment by relating these measures with memory function in demented and nondemented persons with detailed brain imaging and neuropsychological assessment.
Design and Setting
Multivariate regression analyses were used to relate entorhinal cortex volume, entorhinal cortex CBV, hippocampus volume and hippocampus-CBV with measures of memory performance in 231 elderly persons from a community-based cohort. The same measures were related with language function as a reference cognitive domain.
Results
There was no association between entorhinal cortex volume or hippocampus-CBV and memory. Decreased hippocampus volume was strongly associated with worse performance in total recall, while lower entorhinal cortex CBV was significantly associated with lower performance in delayed recall. Excluding persons with Alzheimer's disease (AD), the associations of entorhinal cortex CBV with memory measures was stronger, while the association between hippocampus volume and total recall became non-significant.
Conclusions
These finding suggest that in the early stages of AD or in nondemented persons with worse memory ability functional/metabolic hippocampal hypofunction contribute to memory impairment, while in the later stages both functional and structural changes play a role.
Keywords: entorhinal cortex cerebral blood volume, hippocampus volume, memory performance
Introduction
Atrophic changes in the hippocampus and entorhinal cortex play a major role in the memory impairment observed at early stages of Alzheimer's disease (AD).1, 2 The hippocampus is central to the formation of new memories and memory consolidation, the process for converting short-term memory into stored or long-term memory.3 The entorhinal cortex relays multimodal processed information from the sensory cortical areas to the hippocampus as well as information processed by the hippocampus to permanent storage sites in the neocortex.4
It is clear that cell loss and dysfunction of these regions lead to impairment in several types of memory, including spatial and recognition memory and forms of operant learning. 5-7 Pathological studies of brains from patients with AD show the earliest and greatest neurodegenerative changes in the entorhinal cortex8, 9 which then spread to the hippocampus.10 In accordance with these findings, structural MRI studies have consistently shown atrophy of the hippocampal formation in patients with AD,11-13 in addition to generalized brain atrophy, loss of grey matter, and increased frequency and volume of white matter lesions.14-18 A number of functional imaging modalities sensitive to basal hypofunction have been applied to AD, including basal changes in glucose uptake with PET, basal changes in cerebral blood flow with PET, MRI, and SPECT, and basal changes in cerebral blood volume measured with MRI. MRI-based techniques that assess regional cerebral blood volume (CBV) – a hemodynamic correlate of oxygen metabolism19- have been found well suited to image the function of the hippocampal formation and its subregions across different species.20, 21 Previous studies using this technique showed that MRI measures of CBV can detect AD-related hypofunction22, 23 and that in AD, CBV tightly correlates with PET measures of glucose uptake.22 According to the studies using this technique, among all hippocampal subregions, the entorhinal cortex seems to be the dominant site of hypofunction observed in human AD patients and AD animal models.24
Whether hippocampal atrophy, presumably related to cell loss, or reduced CBV, a surrogate measure of metabolic deficit, are associated with early or late changes in cognitive impairment remains unclear. We hypothesized that metabolic hypofunction in the hippocampus would precede changes in hippocampus volume.
The objective of the present study was to estimate differences in the associations of hippocampus and entorhinal cortex volumes and CBV with memory function by relating these measures with memory function in demented and nondemented persons with detailed brain imaging and neuropsychological assessment. Non-demented persons with worse memory function may be at higher risk to progress to dementia.25-29
Methods
Subjects
Participants were selected from a cohort participating in the prospective study of aging and dementia in Medicare recipients, 65 years and older and residing in northern Manhattan (Washington Heights/Inwood Columbia Aging Project (WHICAP)).30 These participants were recruited at two time points (1992 and 1999) and followed up at regular intervals of 18-24 months. The sampling strategies and recruitment outcomes have been described in detail.31 Recruitment, informed consent and study procedures were approved by the Institutional Review Boards of Columbia University Medical Center and Columbia University Health Sciences and the New York State Psychiatric Institute.
The WHICAP MRI project was concurrent with the second follow-up visit of the cohort recruited in 1999 and the 6th follow-up of the cohort recruited in 1992. Participants were deemed eligible for MR imaging if they did not meet criteria for dementia at the most recent visit before the MRI.30 Persons with illnesses other than dementia were deemed eligible and therefore included in the study. As described in detail previously,30 769 participants received MRI scans, out of these 231 persons (30.0%) received in addition to structural imaging assessment of entorhinal cortex and hippocampus CBV and constituted therefore the final analytic sample. Persons that received CBV assessment and were included in the final sample were more likely to be women (59.3% vs. 40.7%) than persons excluded from the final sample. There were no differences in age, APOEε4 carrier status, or prevalence in vascular risk factors between included and excluded persons.
Clinical Assessment
At each follow-up evaluation, each participant underwent an assessment of medical history, a physical/neurological examination and a neuropsychological battery that included measures of memory, orientation, language, abstract reasoning, and visuospatial ability.32 Memory was evaluated using the multiple choice version of the Benton Visual Retention Test33 and the seven subtests of the Selective Reminding Test:34 total recall, long-term recall, long-term storage, continuous long-term storage, words recalled on last trial, delayed recall, and delayed recognition. Orientation was evaluated using parts of the modified Mini-Mental State Examination.35 Language was assessed using the Boston Naming Test,36 the Controlled Word Association Test,37 category naming, and the Complex Ideational Material and Phrase Repetition subtests from the Boston Diagnostic Aphasia Evaluation.38 Abstract Reasoning was evaluated using WAIS-R Similarities subtest,39 and the non-verbal Identities and Oddities subtest of the Mattis Dementia Rating Scale.40 Visuospatial ability was examined using the Rosen Drawing Test,41 and a matching version of the Benton Visual Retention Test.33 This neuropsychological test battery has established norms for the same community and has been shown to effectively distinguish between normal aging and dementia.32, 42, 43
Diagnosis of Dementia and MCI
Diagnosis of dementia and assignment of specific cause was made by consensus of neurologists, psychiatrists, and neuropsychologists based on baseline and follow-up information. The diagnosis of dementia was based on DSM-IV criteria44 and required evidence of cognitive deficits on the neuropsychological test battery as well as evidence of impairment in social or occupational function (Clinical Dementia Rating of 1 or more).45 Diagnosis of AD was based on the NINCDS-ADRDA criteria.46 Consistent with standard criteria47 for all subtypes of MCI, those considered for MCI were required to have: 1) memory complaint 2) objective impairment in at least one cognitive domain based on the average of the scores on the neuropsychological measures within that domain and a 1.5 SD cutoff using normative corrections for age, years of education, ethnicity, and sex, 3) essentially preserved activities of daily living, and 4) no dementia. Participants with MCI were stratified into those with 1) isolated impairment in memory or impairment in memory and one or more other cognitive domains (“amnestic MCI”) or 2) no impairment in memory but impairment in two or more other cognitive domains (“non-amnestic MCI”), as described in detail previously.48
Magnetic resonance imaging
Subjects underwent imaging with a 1.5-T scanner (Intera; Royal Philips Electronics, Eindhoven, the Netherlands) at Columbia University Medical Center. For derivation of CBV, two sets of oblique coronal 3-dimensional T1-weighted images (repetition time, 20 milliseconds; echo time, 4.6 milliseconds; flip angle, 25°; in-plane resolution, 0.86 × 0.86 mm; slice thickness, 3 mm) were acquired for each subject perpendicular to hippocampal long axis. The first series of images was acquired before and the second was acquired 4 minutes after IV administration of a standard dose of gadodiamide (Omniscan; 0.1 mmol/kg). For volumetric analysis of the hippocampus and entorhinal cortex, T1-weighted images (repetition time, 20 milliseconds, echo time, 2.1 milliseconds, field of view240cm, 25 × 160 pixel matrix with 1.3 mm section thickness) were acquired in the axial plane. The voxel size of these images was 0.9375 mm × 0.9375 mm × 1.3 mm.
Hippocampus volume
The images were transferred electronically to the Imaging of Dementia and Aging Laboratory at the University of California at Davis for morphometric analysis. Images were analyzed manually on a workstation (Ultra 5, Sun Microsystems, Santa Clara, California) by operators blind to subject status. Before, tracing the hippocampus, the T1-weighted images were reoriented into coronal plane perpendicular to the long axis of the left hippocampus (Figure 1), following procedures that are described in more detail elsewhere.30 Briefly, borders of the hippocampus were traced manually in the coronal orientation with simultaneous monitoring for accuracy in the sagittal and axial orthogonal views. The rostral end of the hippocampus was defined by the emergence of the amygdala. In sections in which the uncus lies ventral to caudal amygdala, the uncus was included in the hippocampus. The superior boundary in posterior regions that do not contain amygdale was defined by the hippocampal (choroid) fissure and the superior portion of the inferior horn of the lateral ventricle formed the superior boundary, excluding fimbria. The inferior boundary of the hippocampus was the white matter of the parahippocampal gyrus. The lateral boundary was the inferior (temporal) horn of the lateral ventricle. The posterior boundary of the hippocampus was the first slice in which the fornices were completely distinct from any gray/white matter of the thalamus. Intra-rater reliability right and left hippocampus using this method was good (intraclass correlation coefficients of 0.98 and 0.96, respectively).
Figure 1.
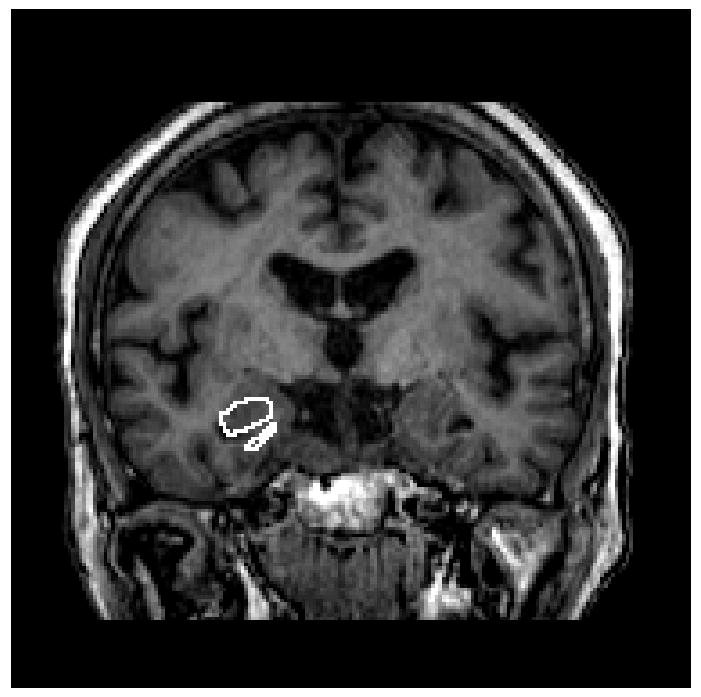
T1-weighted images for acquisition of hippocampus volume. Borders of the hippocampus were traced manually in the coronal orientation with simultaneous monitoring for accuracy in the sagittal and axial orthogonal views.
Entorhinal cortex volume
Entorhinal cortex volume determination followed a protocol put forth by Killiany and colleagues49 and described in greater detail elsewhere.30 Briefly, the entorhinal cortex area was manually derived on 3 consecutive coronal images, centered at the level of the mammillary bodies. The outline of the entorhinal cortex region began at the junction of the rhinal sulcus and the surface of the brain. The outline then transected the angle formed by the rhinal sulcus and the inferior/medial surface of the brain, cutting across the gray matter to the level of the white matter. The edge of the white matter was then followed to the inferior surface of the hippocampus. The outline continued along the surface of the brain back to the starting point. This procedure was repeated using the same landmarks on the immediately adjacent rostral and caudal slices to calculate the total entorhinal area. Inter-rater reliabilities for this process averaged 0.90.
Hippocampus CBV maps
Images acquired for CBV quantification were transferred to a workstation containing an analysis software package (MEDx Sensor Systems, Sterling, Virginia). An investigator blinded to subject grouping performed all image processing. To generate CBV maps, the pre- and post-contrast images were coregistered to each other using an automated image registration program.50 A Gnu plot was generated to assess the quality of the coregistration, and an individual study was rejected if a shift greater than 1-pixel dimension was detected. Three studies (two in subjects with AD, and one in a control subject) were rejected for poor motion correction. The precontrast image was subtracted from the postcontrast image, and the difference in the sagittal sinus, which serves as an estimate of the image intensity change of 100% blood, was recorded. The subtracted image was then divided by the difference in the 4 pixels with the highest intensity values measured from the sagittal sinus and multiplied by 100, yielding relative CBV maps.51, 52 The voxel size for these CBV maps was 0.78125 mm × 0.78125 mm × 3 mm. As described before,24 among the series of oblique coronal images, we have consistently found that a section anterior to the lateral geniculate nucleus and posterior to the uncus provides optimal visualization of hippocampal morphologic features and internal architecture. The external structure of the hippocampus was manually traced, as was the internal architecture that follows the hippocampal sulcus and the internal white matter tracts (Figure 2). With the aid of standard atlases,53, 54 regions of interest (ROIs) of 4 subregions of the hippocampal formation were identified according to the following anatomic criteria: 1) Entorhinal cortex: The inferolateral boundary follows the collateral sulcus; the medial boundary is the medial aspect of the temporal lobe; the superior boundary is the hippocampal sulcus and gray-white distinction between the subiculum and the entorhinal cortex; 2) Subiculum: The medial boundary is the medial extent of the hippocampal sulcus and/or the horizontal inflection of the hippocampus; the inferior boundary is the white matter of the underlying parahippocampal gyrus; the superior boundary is the hippocampal sulcus; the lateral boundary is a few pixels medial to the vertical inflection of the hippocampus. 3) CA1 subregion: The medial boundary is 2 to 3 pixels lateral to the end of the subiculum ROI, approximately at the beginning of the vertical inflection of the hippocampus, and the extension of the hippocampal sulcus/white matter tracts; the inferior boundary is the white matter of the underlying parahippocampal gyrus; the superior boundary is the top of the hippocampal formation. 4) Dentate gyrus: The medial boundary is the medial extent of the temporal lobe; the inferolateral boundary is the hippocampal sulcus–white matter tracts; the superior boundary is the top of the hippocampal formation, where the alveus is typically identified.
Figure 2.
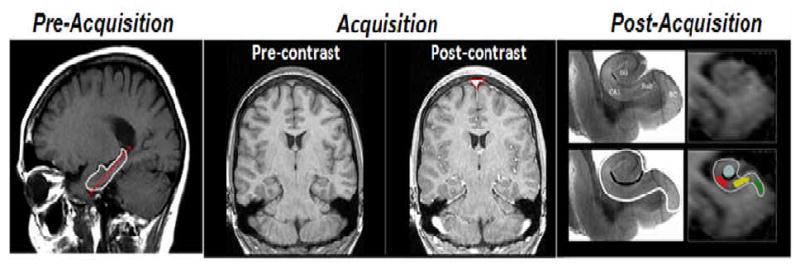
CBV maps of the hippocampal formation. As described in the methods section, a sagital scout image is used to identify the long axis of the hippocampal formation (red stippled line in the ‘pre-acquisition panel), and slices are then acquired perpendicular to this axis. High-resolution T1-weighted images are subsequently acquired before and after injection of a contrast agent. Cerebral blood volume (CBV) maps are generated by subtracting the pre-contrast from the post-contrast scan and dividing the subtracting images by the degree of contrast enhancement observed in the sagital sinus (red triangle in ‘post-acquisition’ panel). Post acquisition, anatomical criteria are used to identify regions-of-interest (ROIs) of the hippocampal subregions. The anatomic locations of the four hippocampal subregions are shown in a postmortem hippocampal slice (top left panel of post-acquisition images; EC: entorhinal cortex, DG: dentate gyrus, CA1: CA1 subfield, SuB: subiculum). By identifying the external morphology of the hippocampal formation (white line in bottom left and right panels) and its internal architecture (black line in the bottom left and right panels), regions of interest can be drawn in the entorhinal cortex (green), dentate gyrus (blue), CA1 subfield (red), and the subiculum (yellow).
As the border zones between any 2 subregions cannot be identified without histologic landmarks they were excluded from the ROIs. Mean relative CBV from the ROI of each hippocampal subregion was measured from each subject and used for group data analysis. Relative CBV values from the subiculum, CA1 subregion, and dentate gyrus were averaged to yield a single measurement of relative CBV in the hippocampus proper.
Examination of regional CBV versus regional volumetry yields different information. The former, provides an estimate of the basal metabolic rate. The latter provides a measurement of parenchymal integrity, or atrophy, due to neuronal or glial loss. CBV estimates are derived within voxels that are representative of each region of interest, whereas volume is calculated by summing across the same regions. Thus, while the two approaches differ in the quantification of the region, they are regionally comparable
Quality Control of MRI measures
Each image was rated for image quality based on signal to noise, susceptibility artifact and movement. Those deemed of “poor quality” were not analyzed. Of the 769 images available, 623 images were of satisfactory quality to analyze entorhinal cortex volume and 749 images were of satisfactory quality to analyze hippocampal volume. 392 were dropped from the CBV analysis. This left the 231 subjects available for this analysis.
APOE Genotyping
APOE genotypes were determined as described by Hixson and Vernier with slight modification.55 We classified persons as homozygeous or heterozygeous for the APOEε4 allele or not having any ε4 allele.
Statistical Methods
First we evaluated the demographic and clinical characteristics of the study sample at baseline. Then we used multivariate regression models to estimate all main effects of entorhinal cortex CBV, entorhinal cortex volume, hippocampus volume and hippocampus-CBV on measures of memory performance, adjusting all models for sex, age, race, education. We focused on measures of total recall and delayed recall, as learning and memory are the hallmarks and most sensitive measures of cognitive impairment in AD. To determine whether potentially observed associations remained consistent in persons without dementia, we then repeated all analyses excluding persons with dementia (n=17). To determine whether potentially observed associations were specific to memory function we finally repeated all analyses using a language summary score as the outcome, which was derived by a factor analysis of data from all 15 neuropsychological measures in the entire cohort.56 Main contributors to this language factor score were the Boston Naming Test, Controlled Oral Word Association Test, and the WAIS-R Similarities. All data analysis was performed using SPSS version 16.0 software (SPSS Inc, Chicago, Ill).
Results
The mean age of the sample was 79.9±5.7 years, and 59.3% were women, 26.8% were white (non Hispanic), 38.1% black (non Hispanic) and 35.1% were of mixed race and Hispanic. The mean of years of education was 10.6± 4.9, and 26.4% of the sample were homo- or heterozygeous for the APOEε4 allele. 162 persons (70.1%) were without cognitive impairment or dementia, 22 persons (9.5%) had non-amnestic MCI, 30 (13.0%) amnestic MCI and 17 persons (7.4%) had dementia (table 1). These 17 persons, who had dementia at time of MRI, were included in the study because at last visit before MRI they were not yet demented and thus met the inclusion criteria. Out of the 17 persons with dementia, 10 (66.7%) had probable AD without concomitant disease, 4 persons (26.7%) had probable AD with stroke, and 3 persons (17.7%) had probable AD with other concomitant disease. Persons with mild cognitive impairment or dementia had on average smaller hippocampal volumes and worse memory function than persons without cognitive impairment (table 2).
Table 1.
Clinical and demographic characteristics of the study sample
| Women, n (%) | 137 (59.3) |
| Age, mean (SD), year | 79.9 (5.7) |
| Education, mean (SD), year | 10.6 (4.9) |
| Ethnic group, n (%) † | |
| White/Non-Hispanic | 62 (26.8) |
| Black/Non-Hispanic | 88 (38.1) |
| Hispanic | 81 (35.1) |
| APOE genotype 4/- or 4/4, n (%) | 61 (26.4) |
| Dementia, n (%) | 17 (7.4) |
| MCI, n (%) | |
| No | 162 (70.1) |
| Non-amnestic | 22 (9.5) |
| amnestic | 30 (13.0) |
| Hippocampus Volume, mean (SD) | 0.29 (0.06) |
| Hippocampus CBV, mean (SD) | 0.05 (0.02) |
| Entorhinal Cortex volume, mean (SD) | 0.09 (0.03) |
| Entorhinal Cortex CBV, mean (SD) | 0.02 (0.01) |
Some percentages are based on an incomplete sample due to small amounts of missing data.
Classified by self-report using the format of the 1990 US census. CBV = cerebral blood volume
Table 2.
Mean values (SD) of memory function, hippocampus volume, hippocampus CBV, entorhinal cortex volume and entorhinal cortex CBV across cognitive impairment group.
| Memory performance | Hippocampus volume | Hippocampus CBV | Entorhinal Cortex Volume | Entorhinal Cortex CBV | |
|---|---|---|---|---|---|
| No cognitive impairment | 0.25 (0.73) | 0.29 (0.06) | 0.07 (0.03) | 0.008 (0.003) | 0.02 (0.01) |
| Non-amnestic MCI | 0.04 (0.56)* | 0.29 (0.05) | 0.06 (0.03) | 0.007 (0.002) | 0.01 (0.008) |
| Amnestic MCI | -0.81 (0.45)* | 0.29 (0.06) | 0.06 (0.02) | 0.008 (0.003) | 0.01 (0.008) |
| dementia | -1.44 (0.72)* | 0.24 (0.05)* | 0.06 (0.02) | 0.006 (0.003)* | 0.01 (0.006) |
sign. at a 0.05 level vs persons without cognitive impairment
MCI=mild cognitive impairment
There was no association between entorhinal cortex volume or hippocampus-CBV and memory as measured by total and delayed recall. However, decreased hippocampus volumes were associated with significantly worse performance in total recall (β (SE)=26.38 (12.18), p=0.03, table 3) and lower entorhinal cortex CBV was associated with worse performance in delayed recall (β (SE)=8.43 (4.51), p=0.05).
Table 3.
Regression coefficients -relating hippocampus volume, hippocampus CBV, entorhinal cortex volume and entorhinal cortex CBV with memory and language performance
| All persons (n=231) |
Persons with dementia excluded (n=214) |
|||
|---|---|---|---|---|
| β (SE) | p-value | β (SE) | p-value | |
| Total recall | ||||
| Hippocampus volume | 26.38 (12.18) | 0.03* | 9.07 (12.01) | 0.45 |
| Hippocampus CBV | 26.48 (36.14) | 0.47 | 28.54 (36.16) | 0.43 |
| Entorhinal cortex volume | -177.23 (259.39) | 0.49 | -380.79 (256.11) | 0.13 |
| Entorhinal cortex CBV | 37.32 (79.96) | 0.64 | 84.62 (77.83) | 0.28 |
| Delayed recall | ||||
| Hippocampus volume | 1.19 (0.71) | 0.09 | 0.79 (0.69) | 0.25 |
| Hippocampus CBV | 3.36 (2.03) | 0.10 | 3.12 (2.03) | 0.13 |
| Entorhinal cortex volume | -2.93 (14.99) | 0.85 | 1.69 (14.53) | 0.91 |
| Entorhinal cortex CBV | 8.43 (4.51) | 0.05* | 10.92 (4.44) | 0.01* |
| Language performance | ||||
| Hippocampus volume | 0.65 (0.64) | 0.31 | -0.06 (0.63) | 0.92 |
| Hippocampus CBV | -2.09 (1.92) | 0.28 | -1.33 (1.91) | 0.49 |
| Entorhinal cortex volume | 8.94 (13.77) | 0.52 | 2.71 (13.51) | 0.84 |
| Entorhinal cortex CBV | 4.45 (4.25) | 0.29 | 5.78 (4.11) | 0.16 |
β = regression coefficient, SE= standard error. All models are adjusted for age, gender, education, race and APOE.
sign. at a 0.05 level
When we repeated all analyses excluding persons with dementia (n=17), the strength of the association between entorhinal cortex CBV and delayed recall was increased (β(SE) =10.92 (4.44), p=0.01), while the association between hippocampus volume and memory performance was attenuated and no longer statistically significant (β(SE) =9.07 (12.01), p=0.45) (table 3). Additional exclusion of persons with MCI (n=52) subsequently attenuated the association between entorhinal cortex CBV and delayed recall (β(SE) =10.24 (4.16), p=0.02), and further attenuated the association between hippocampus volume and memory performance (β(SE) =2.69 (12.29), p=0.83). There were no associations of entorhinal cortex CBV, entorhinal cortex volume, hippocampus volume or hippocampus-CBV with language performance.
When we repeated all analyses stratifying by APOE genotype (APOEε4 carriers vs. non-carriers) or brain hemispheres, all results were similar across strata.
Discussion
MRI technology provides the opportunity to image functional and structural correlates of changes in the hippocampal formation simultaneously. We investigated the stage at which changes in hippocampus volume, hippocampus CBV, entorhinal cortex volume and entorhinal cortex CBV best reflected changes in memory performance. In a combined group of demented and non-demented persons, lower hippocampus volume was associated with worse total recall and lower entorhinal cortex CBV was weakly associated with worse delayed recall. When persons with dementia and were excluded, however, the association between hippocampus volume and memory was attenuated and non-significant while the association between entorhinal cortex CBV and delayed recall became stronger. Additional exclusion of persons with MCI subsequently attenuated the increased association between entorhinal cortex CBV and delayed recall, and further attenuated the association between hippocampus volume and memory performance. There were no associations of entorhinal cortex CBV, entorhinal cortex volume, hippocampus volume or hippocampus-CBV with language performance suggesting that the observed effects are specific to the memory domain.
Human and animal studies have suggested different stages through which AD progresses: neuronal malfunction manifesting as synaptic or metabolic deficit followed by insoluble protein aggregates typified by amyloid plaques and neurofibrillary tangles and finally by neuronal cell death. At this point, however, this pattern of progression serves only as a working model. The functional and structural stages in AD are not categorically exclusive and the temporal sequence of malfunction and cell loss is not proven. Structural and functional changes in the hippocampal formation could simultaneously or sequentially contribute to memory impairment. Structural and functional imaging techniques as utilized in the present study have the potential to help clarify the relation between structural and functional hippocampal changes during the course of the disease, and the molecular mechanisms by which these changes lead to memory impairment.
Our findings are consistent with previous imaging studies that have reported associations between hippocampus volume and entorhinal cortex defects with memory function. After early structural MRI studies57 showed atrophy of the hippocampus in patients with dementia of moderate severity, later studies58-60 found atrophy in patients with milder dementia. Atrophy on MRI is also observed in high-risk populations, such as patients with MCI58, 61 or persons at risk for autosomal dominant familial Alzheimer disease,62, 63 but also persons without cognitive impairment.64-69 Both within persons without any cognitive impairment and patients who have MCI, hippocampal atrophy severity predicts conversion to dementia independently of neuropsychological performance.59, 65, 70 Within the hippocampal formation, the entorhinal cortex was observed to be the region predominantly affected by the effects of AD,70, 71 and there is evidence that it is superior to hippocampal volume in predicting future cognitive decline.1, 70
Functional imaging can in general estimate hippocampal hypofunction by mapping disease-related changes in glucose uptake, reflecting glucose metabolism, or by mapping changes in any of the three correlates of oxygen metabolism: cerebral blood flow, cerebral blood volume, and deoxyhemoglobin content.72 All four variables can successfully detect regional dysfunction in AD. However, MRI maps of cerebral blood volume (CBV) are preferable because they are more directly coupled to brain metabolism and give a more accurate functional view of the tissue that may indicate disease via cell dysfunction prior to cell loss and atrophy.73 Indeed, previous AD studies have shown that CBV tightly correlates with measures of glucose metabolism,22 obviating the concern that AD-related vascular pathology uncouples basal CBV from underlying neuronal function. Our finding of an association between lower entorhinal cortex CBV and worse delayed recall is consistent with a previous CBV study which reported that among all hippocampal subregions, the entorhinal cortex was the dominant site of dysfunction observed in both human AD patients and J20 mice.24
The present study extends previous works in that we explored the effects of hippocampus and entorhinal cortex volume and CBV in both affected and unaffected individuals, explored at what stage of cognitive impairment these measures exert their effects on memory performance, and explored whether they are specific for memory function. The exclusion of persons with dementia from the analyses caused the associations between hippocampus volume and memory measures to attenuate, while the weak association between entorhinal cortex CBV with delayed recall became stronger. Additional exclusion of persons with MCI subsequently further attenuated the association between hippocampus volume and memory performance, and also attenuated the increased association between entorhinal cortex CBV and delayed recall observed after exclusion of dementia cases. These findings suggest that in the early stages of disease (MCI) or in nondemented persons functional and metabolic effects correlate with memory, while in the later stages both functional and structural changes are present. This notion is supported by the fact that not only persons with AD but also persons with amnestic MCI had on average smaller hippocampal CBV than persons without cognitive impairment. As neuronal dysfunction is -compared with neuronal cell death considered the disease's cytopathological feature most amenable to pharmacologic intervention- this finding is of major implication.
A limitation of our study is its cross-sectional nature, which limits the inferences that can be made from our results, and the selection of a subpopulation that limits generalization. Further, we had only 17 dementia cases, and these cases were mild. It is likely that both inclusion of more persons with dementia, and more severe dementia cases would have increased the power of the study and would have led to stronger associations. Important strengths of the study include the detailed structural and functional MRI measures with CBV assessment, and the detailed neuropsychological test battery especially designed for diagnosis of cognitive impairment and dementia. To the best of our knowledge, this is the first study exploring and demonstrating the relation between structural and functional (para)hippocampal changes in cognitive impairment, and demonstrating the specificity of this effect for the memory domain.
Mapping a temporal, cognitive and molecular pattern of hippocampal hypofunction is an important step toward a greater mechanistic understanding of the AD disease process. Our findings set the stage for future studies to focus on the molecular level of analysis. Studies are needed that clarify the mechanisms underlying the observed temporal course of structural and functional molecular changes in the hippocampal formation.
Acknowledgments
This work was supported by National Institutes of Health grants AG007232 and AG029949.
References
- 1.deToledo-Morrell L, Stoub TR, Bulgakova M, Wilson RS, Bennett DA, Leurgans S, et al. MRI-derived entorhinal volume is a good predictor of conversion from MCI to AD. Neurobiol Aging. 2004;25(9):1197–203. doi: 10.1016/j.neurobiolaging.2003.12.007. [DOI] [PubMed] [Google Scholar]
- 2.Stoub TR, deToledo-Morrell L, Stebbins GT, Leurgans S, Bennett DA, Shah RC. Hippocampal disconnection contributes to memory dysfunction in individuals at risk for Alzheimer's disease. Proc Natl Acad Sci U S A. 2006;103(26):10041–5. doi: 10.1073/pnas.0603414103. [DOI] [PMC free article] [PubMed] [Google Scholar]
- 3.Wittenberg GM, Tsien JZ. An emerging molecular and cellular framework for memory processing by the hippocampus. Trends Neurosci. 2002;25(10):501–5. doi: 10.1016/s0166-2236(02)02231-2. [DOI] [PubMed] [Google Scholar]
- 4.Heinemann U, Schmitz D, Eder C, Gloveli T. Properties of entorhinal cortex projection cells to the hippocampal formation. Ann N Y Acad Sci. 2000;911:112–26. doi: 10.1111/j.1749-6632.2000.tb06722.x. [DOI] [PubMed] [Google Scholar]
- 5.Davis AE, Gimenez AM, Therrien B. Effects of entorhinal cortex lesions on sensory integration and spatial learning. Nurs Res. 2001;50(2):77–85. doi: 10.1097/00006199-200103000-00003. [DOI] [PubMed] [Google Scholar]
- 6.Eijkenboom M, Blokland A, van der Staay FJ. Modelling cognitive dysfunctions with bilateral injections of ibotenic acid into the rat entorhinal cortex. Neuroscience. 2000;101(1):27–39. doi: 10.1016/s0306-4522(00)00342-0. [DOI] [PubMed] [Google Scholar]
- 7.Kopniczky Z, Dochnal R, Macsai M, Pal A, Kiss G, Mihaly A, et al. Alterations of behavior and spatial learning after unilateral entorhinal ablation of rats. Life Sci. 2006;78(23):2683–8. doi: 10.1016/j.lfs.2005.10.014. [DOI] [PubMed] [Google Scholar]
- 8.Haroutunian V, Perl DP, Purohit DP, Marin D, Khan K, Lantz M, et al. Regional distribution of neuritic plaques in the nondemented elderly and subjects with very mild Alzheimer disease. Arch Neurol. 1998;55(9):1185–91. doi: 10.1001/archneur.55.9.1185. [DOI] [PubMed] [Google Scholar]
- 9.Haroutunian V, Purohit DP, Perl DP, Marin D, Khan K, Lantz M, et al. Neurofibrillary tangles in nondemented elderly subjects and mild Alzheimer disease. Arch Neurol. 1999;56(6):713–8. doi: 10.1001/archneur.56.6.713. [DOI] [PubMed] [Google Scholar]
- 10.Braak H, Braak E, Bohl J. Staging of Alzheimer-related cortical destruction. Eur Neurol. 1993;33(6):403–8. doi: 10.1159/000116984. [DOI] [PubMed] [Google Scholar]
- 11.Devanand DP, Pradhaban G, Liu X, Khandji A, De Santi S, Segal S, et al. Hippocampal and entorhinal atrophy in mild cognitive impairment: prediction of Alzheimer disease. Neurology. 2007;68(11):828–36. doi: 10.1212/01.wnl.0000256697.20968.d7. [DOI] [PubMed] [Google Scholar]
- 12.Tapiola T, Pennanen C, Tapiola M, Tervo S, Kivipelto M, Hanninen T, et al. MRI of hippocampus and entorhinal cortex in mild cognitive impairment: a follow-up study. Neurobiol Aging. 2008;29(1):31–8. doi: 10.1016/j.neurobiolaging.2006.09.007. [DOI] [PubMed] [Google Scholar]
- 13.Jack CR, Jr, Petersen RC, Xu Y, O'Brien PC, Smith GE, Ivnik RJ, et al. Rates of hippocampal atrophy correlate with change in clinical status in aging and AD. Neurology. 2000;55(4):484–89. doi: 10.1212/wnl.55.4.484. [DOI] [PMC free article] [PubMed] [Google Scholar]
- 14.Au R, Massaro JM, Wolf PA, Young ME, Beiser A, Seshadri S, et al. Association of white matter hyperintensity volume with decreased cognitive functioning: the Framingham Heart Study. Arch Neurol. 2006;63(2):246–50. doi: 10.1001/archneur.63.2.246. [DOI] [PubMed] [Google Scholar]
- 15.de Groot JC, de Leeuw FE, Oudkerk M, van Gijn J, Hofman A, Jolles J, et al. Cerebral white matter lesions and cognitive function: the Rotterdam Scan Study. Ann Neurol. 2000;47(2):145–51. doi: 10.1002/1531-8249(200002)47:2<145::aid-ana3>3.3.co;2-g. [DOI] [PubMed] [Google Scholar]
- 16.Longstreth WT, Jr, Manolio TA, Arnold A, Burke GL, Bryan N, Jungreis CA, et al. Clinical correlates of white matter findings on cranial magnetic resonance imaging of 3301 elderly people. The Cardiovascular Health Study. Stroke. 1996;27(8):1274–82. doi: 10.1161/01.str.27.8.1274. [DOI] [PubMed] [Google Scholar]
- 17.Schmidt R, Ropele S, Enzinger C, Petrovic K, Smith S, Schmidt H, et al. White matter lesion progression, brain atrophy, and cognitive decline: the Austrian stroke prevention study. Ann Neurol. 2005;58(4):610–6. doi: 10.1002/ana.20630. [DOI] [PubMed] [Google Scholar]
- 18.Vermeer SE, Prins ND, den Heijer T, Hofman A, Koudstaal PJ, Breteler MM. Silent brain infarcts and the risk of dementia and cognitive decline. N Engl J Med. 2003;348(13):1215–22. doi: 10.1056/NEJMoa022066. [DOI] [PubMed] [Google Scholar]
- 19.Kida I, Hyder F. Physiology of functional magnetic resonance imaging: energetics and function. Methods Mol Med. 2006;124:175–95. doi: 10.1385/1-59745-010-3:175. [DOI] [PubMed] [Google Scholar]
- 20.Small SA, Chawla MK, Buonocore M, Rapp PR, Barnes CA. Imaging correlates of brain function in monkeys and rats isolates a hippocampal subregion differentially vulnerable to aging. Proc Natl Acad Sci U S A. 2004;101(18):7181–6. doi: 10.1073/pnas.0400285101. [DOI] [PMC free article] [PubMed] [Google Scholar]
- 21.Wu W, Small SA. Imaging the earliest stages of Alzheimer's disease. Curr Alzheimer Res. 2006;3(5):529–39. doi: 10.2174/156720506779025161. [DOI] [PubMed] [Google Scholar]
- 22.Gonzalez RG, Fischman AJ, Guimaraes AR, Carr CA, Stern CE, Halpern EF, et al. Functional MR in the evaluation of dementia: correlation of abnormal dynamic cerebral blood volume measurements with changes in cerebral metabolism on positron emission tomography with fludeoxyglucose F 18. AJNR Am J Neuroradiol. 1995;16(9):1763–70. [PMC free article] [PubMed] [Google Scholar]
- 23.Harris GJ, Lewis RF, Satlin A, English CD, Scott TM, Yurgelun-Todd DA, et al. Dynamic susceptibility contrast MR imaging of regional cerebral blood volume in Alzheimer disease: a promising alternative to nuclear medicine. AJNR Am J Neuroradiol. 1998;19(9):1727–32. [PMC free article] [PubMed] [Google Scholar]
- 24.Moreno H, Wu WE, Lee T, Brickman A, Mayeux R, Brown TR, et al. Imaging the Abeta-related neurotoxicity of Alzheimer disease. Arch Neurol. 2007;64(10):1467–77. doi: 10.1001/archneur.64.10.1467. [DOI] [PubMed] [Google Scholar]
- 25.Manly JJ, Tang MX, Schupf N, Stern Y, Vonsattel JP, Mayeux R. Frequency and course of mild cognitive impairment in a multiethnic community. Ann Neurol. 2008;63(4):494–506. doi: 10.1002/ana.21326. [DOI] [PMC free article] [PubMed] [Google Scholar]
- 26.Bowen J, Teri L, Kukull W, McCormick W, McCurry SM, Larson EB. Progression to dementia in patients with isolated memory loss. Lancet. 1997;349(9054):763–5. doi: 10.1016/S0140-6736(96)08256-6. [DOI] [PubMed] [Google Scholar]
- 27.Dickerson BC, Sperling RA, Hyman BT, Albert MS, Blacker D. Clinical prediction of Alzheimer disease dementia across the spectrum of mild cognitive impairment. Arch Gen Psychiatry. 2007;64(12):1443–50. doi: 10.1001/archpsyc.64.12.1443. [DOI] [PMC free article] [PubMed] [Google Scholar]
- 28.Panza F, Capurso C, D'Introno A, Colacicco AM, Santamato A, Capurso A, et al. Progression to dementia in probable and possible mild cognitive impairment. Arch Neurol. 2007;64(8):1209–10. doi: 10.1001/archneur.64.8.1209-b. author reply 1210-1. [DOI] [PubMed] [Google Scholar]
- 29.Tabert MH, Manly JJ, Liu X, Pelton GH, Rosenblum S, Jacobs M, et al. Neuropsychological prediction of conversion to Alzheimer disease in patients with mild cognitive impairment. Arch Gen Psychiatry. 2006;63(8):916–24. doi: 10.1001/archpsyc.63.8.916. [DOI] [PubMed] [Google Scholar]
- 30.Brickman AM, Schupf N, Manly JJ, Luchsinger JA, Andrews H, Tang MX, et al. Brain Morphology in Older African Americans, Caribbean Hispanics, and Whites From Northern Manhattan. Arch Neurol. 2008;65(8):1053–1061. doi: 10.1001/archneur.65.8.1053. [DOI] [PMC free article] [PubMed] [Google Scholar]
- 31.Tang MX, Cross P, Andrews H, Jacobs DM, Small S, Bell K, et al. Incidence of AD in African-Americans, Caribbean Hispanics, and Caucasians in northern Manhattan. Neurology. 2001;56(1):49–56. doi: 10.1212/wnl.56.1.49. [DOI] [PubMed] [Google Scholar]
- 32.Stern Y, Andrews H, Pittman J, Sano M, Tatemichi T, Lantigua R, et al. Diagnosis of dementia in a heterogeneous population. Development of a neuropsychological paradigm-based diagnosis of dementia and quantified correction for the effects of education. Arch Neurol. 1992;49(5):453–60. doi: 10.1001/archneur.1992.00530290035009. [DOI] [PubMed] [Google Scholar]
- 33.Benton A. The Benton Visual Retention Test. The Psychological Corporation; New York: 1955. [Google Scholar]
- 34.Buschke H, Fuld P. Evaluating storage, retention, and retrieval in disordered memory and learning. Neurology. 1974 Nov;24(11):1019–1025. doi: 10.1212/wnl.24.11.1019. [DOI] [PubMed] [Google Scholar]
- 35.Folstein MF, Folstein SE, McHugh PR. “Mini-mental state”. A practical method for grading the cognitive state of patients for the clinician. J Psychiatr Res. 1975;12(3):189–98. doi: 10.1016/0022-3956(75)90026-6. [DOI] [PubMed] [Google Scholar]
- 36.Kaplan E, Goodglass H, Weintraub S. Boston Naming Test. Lea & Febiger; Philadelphia, PA: 1983. [Google Scholar]
- 37.Benton A. FAS Test. University of Victoria; Victoria, B.C.: 1967. [Google Scholar]
- 38.Goodglass H, Kaplan E. The Assessment of Aphasia and Related Disorders. 2. Lea & Febiger; Philadelphia, PA: 1983. [Google Scholar]
- 39.Wechsler D. Wechsler Adult Intelligence Scale-Revised. The Psychological Corporation; New York, NY: 1981. [Google Scholar]
- 40.Mattis S. Mental status examination for organic mental syndrome in the elderly patient. Grune & Stratton; New York, NY: 1976. [Google Scholar]
- 41.Rosen W. The Rosen Drawing Test. Veterans Administration Medical Center; Bronx, NY: 1981. [Google Scholar]
- 42.Stricks L, Pittman J, Jacobs DM, Sano M, Stern Y. Normative data for a brief neuropsychological battery administered to English- and Spanish-speaking community-dwelling elders. J Int Neuropsychol Soc. 1998;4(4):311–8. [PubMed] [Google Scholar]
- 43.Jacobs DM, Sano M, Albert S, Schofield P, Dooneief G, Stern Y. Cross-cultural neuropsychological assessment: a comparison of randomly selected, demographically matched cohorts of English- and Spanish-speaking older adults. J Clin Exp Neuropsychol. 1997;19(3):331–9. doi: 10.1080/01688639708403862. [DOI] [PubMed] [Google Scholar]
- 44.Diagnostic and Statistical Manual of Mental Disorders. 4th. Washington, D.C.: American Psychiatric Association; 1994. [Google Scholar]
- 45.Hughes CP, Berg L, Danziger WL, Coben LA, Martin RL. A new clinical scale for the staging of dementia. Br J Psychiatry. 1982;140:566–72. doi: 10.1192/bjp.140.6.566. [DOI] [PubMed] [Google Scholar]
- 46.McKhann G, Drachman D, Folstein M, Katzman R, Price D, Stadlan EM. Clinical diagnosis of Alzheimer's disease: report of the NINCDS-ADRDA Work Group under the auspices of Department of Health and Human Services Task Force on Alzheimer's Disease. Neurology. 1984;34(7):939–44. doi: 10.1212/wnl.34.7.939. [DOI] [PubMed] [Google Scholar]
- 47.Petersen RC, Smith GE, Waring SC, Ivnik RJ, Tangalos EG, Kokmen E. Mild cognitive impairment: clinical characterization and outcome. Arch Neurol. 1999;56(3):303–8. doi: 10.1001/archneur.56.3.303. [DOI] [PubMed] [Google Scholar]
- 48.Manly JJ, Bell-McGinty S, Tang MX, Schupf N, Stern Y, Mayeux R. Implementing diagnostic criteria and estimating frequency of mild cognitive impairment in an urban community. Arch Neurol. 2005;62(11):1739–46. doi: 10.1001/archneur.62.11.1739. [DOI] [PubMed] [Google Scholar]
- 49.Killiany RJ, Gomez-Isla T, Moss M, Kikinis R, Sandor T, Jolesz F, et al. Use of structural magnetic resonance imaging to predict who will get Alzheimer's disease. Ann Neurol. 2000;47(4):430–9. [PubMed] [Google Scholar]
- 50.Woods RP, Grafton ST, Watson JD, Sicotte NL, Mazziotta JC. Automated image registration: II. Intersubject validation of linear and nonlinear models. J Comput Assist Tomogr. 1998;22(1):153–65. doi: 10.1097/00004728-199801000-00028. [DOI] [PubMed] [Google Scholar]
- 51.Lin W, Celik A, Paczynski RP. Regional cerebral blood volume: a comparison of the dynamic imaging and the steady state methods. J Magn Reson Imaging. 1999;9(1):44–52. doi: 10.1002/(sici)1522-2586(199901)9:1<44::aid-jmri6>3.0.co;2-7. [DOI] [PubMed] [Google Scholar]
- 52.Lin W, Paczynski RP, Kuppusamy K, Hsu CY, Haacke EM. Quantitative measurements of regional cerebral blood volume using MRI in rats: effects of arterial carbon dioxide tension and mannitol. Magn Reson Med. 1997;38(3):420–8. doi: 10.1002/mrm.1910380311. [DOI] [PubMed] [Google Scholar]
- 53.Amaral DG, Insausti R. The hippocampal formation. In: Paxinos R, editor. The Human Nervous System. San Diego, CA: Academic Press; 1990. [Google Scholar]
- 54.Duvernoy HM. The Human Hippocampus: an Atlas of Applied Anatomy. 2nd. Munich, Germany: JF Bergman; 1998. [Google Scholar]
- 55.Hixson JE, Vernier DT. Restriction isotyping of human apolipoprotein E by gene amplification and cleavage with HhaI. J Lipid Res. 1990;31(3):545–8. [PubMed] [Google Scholar]
- 56.Kleinbaum D, Klipper L, Muller K. Applied regression analysis and other multivariable methods. 2nd. Boston: PWS-Kent; p. 631. [Google Scholar]
- 57.Lehericy S, Baulac M, Chiras J, Pierot L, Martin N, Pillon B, et al. Amygdalohippocampal MR volume measurements in the early stages of Alzheimer disease. AJNR Am J Neuroradiol. 1994;15(5):929–37. [PMC free article] [PubMed] [Google Scholar]
- 58.Du AT, Schuff N, Amend D, Laakso MP, Hsu YY, Jagust WJ, et al. Magnetic resonance imaging of the entorhinal cortex and hippocampus in mild cognitive impairment and Alzheimer's disease. J Neurol Neurosurg Psychiatry. 2001;71(4):441–7. doi: 10.1136/jnnp.71.4.441. [DOI] [PMC free article] [PubMed] [Google Scholar]
- 59.Jack CR, Jr, Petersen RC, Xu YC, Waring SC, O'Brien PC, Tangalos EG, et al. Medial temporal atrophy on MRI in normal aging and very mild Alzheimer's disease. Neurology. 1997;49(3):786–94. doi: 10.1212/wnl.49.3.786. [DOI] [PMC free article] [PubMed] [Google Scholar]
- 60.Laakso MP, Partanen K, Riekkinen P, Lehtovirta M, Helkala EL, Hallikainen M, et al. Hippocampal volumes in Alzheimer's disease, Parkinson's disease with and without dementia, and in vascular dementia: An MRI study. Neurology. 1996;46(3):678–81. doi: 10.1212/wnl.46.3.678. [DOI] [PubMed] [Google Scholar]
- 61.Convit A, de Leon MJ, Tarshish C, De Santi S, Kluger A, Rusinek H, et al. Hippocampal volume losses in minimally impaired elderly. Lancet. 1995;345(8944):266. doi: 10.1016/s0140-6736(95)90265-1. [DOI] [PubMed] [Google Scholar]
- 62.Fox NC, Warrington EK, Freeborough PA, Hartikainen P, Kennedy AM, Stevens JM, et al. Presymptomatic hippocampal atrophy in Alzheimer's disease. A longitudinal MRI study. Brain. 1996;119(Pt 6):2001–7. doi: 10.1093/brain/119.6.2001. [DOI] [PubMed] [Google Scholar]
- 63.Schott JM, Fox NC, Frost C, Scahill RI, Janssen JC, Chan D, et al. Assessing the onset of structural change in familial Alzheimer's disease. Ann Neurol. 2003;53(2):181–8. doi: 10.1002/ana.10424. [DOI] [PubMed] [Google Scholar]
- 64.Golomb J, Kluger A, de Leon MJ, Ferris SH, Convit A, Mittelman MS, et al. Hippocampal formation size in normal human aging: a correlate of delayed secondary memory performance. Learn Mem. 1994;1(1):45–54. [PubMed] [Google Scholar]
- 65.Ikram MA, Vrooman HA, Vernooij MW, Heijer TD, Hofman A, Niessen WJ, et al. Brain tissue volumes in relation to cognitive function and risk of dementia. Neurobiol Aging. 2008 doi: 10.1016/j.neurobiolaging.2008.04.008. [DOI] [PubMed] [Google Scholar]
- 66.Small SA, Tsai WY, DeLaPaz R, Mayeux R, Stern Y. Imaging hippocampal function across the human life span: is memory decline normal or not? Ann Neurol. 2002;51(3):290–5. doi: 10.1002/ana.10105. [DOI] [PubMed] [Google Scholar]
- 67.Yonelinas AP, Widaman K, Mungas D, Reed B, Weiner MW, Chui HC. Memory in the aging brain: doubly dissociating the contribution of the hippocampus and entorhinal cortex. Hippocampus. 2007;17(11):1134–40. doi: 10.1002/hipo.20341. [DOI] [PMC free article] [PubMed] [Google Scholar]
- 68.De Leon MJ, George AE, Golomb J, Tarshish C, Convit A, Kluger A, et al. Frequency of hippocampal formation atrophy in normal aging and Alzheimer's disease. Neurobiol Aging. 1997;18(1):1–11. doi: 10.1016/s0197-4580(96)00213-8. [DOI] [PubMed] [Google Scholar]
- 69.Golomb J, Kluger A, de Leon MJ, Ferris SH, Mittelman M, Cohen J, et al. Hippocampal formation size predicts declining memory performance in normal aging. Neurology. 1996;47(3):810–3. doi: 10.1212/wnl.47.3.810. [DOI] [PubMed] [Google Scholar]
- 70.Killiany RJ, Hyman BT, Gomez-Isla T, Moss MB, Kikinis R, Jolesz F, et al. MRI measures of entorhinal cortex vs hippocampus in preclinical AD. Neurology. 2002;58(8):1188–96. doi: 10.1212/wnl.58.8.1188. [DOI] [PubMed] [Google Scholar]
- 71.Pennanen C, Kivipelto M, Tuomainen S, Hartikainen P, Hanninen T, Laakso MP, et al. Hippocampus and entorhinal cortex in mild cognitive impairment and early AD. Neurobiol Aging. 2004;25(3):303–10. doi: 10.1016/S0197-4580(03)00084-8. [DOI] [PubMed] [Google Scholar]
- 72.Small SA. Imaging Alzheimer's disease. Curr Neurol Neurosci Rep. 2003;3(5):385–92. doi: 10.1007/s11910-003-0021-1. [DOI] [PubMed] [Google Scholar]
- 73.Small SA. Measuring correlates of brain metabolism with high-resolution MRI: a promising approach for diagnosing Alzheimer disease and mapping its course. Alzheimer Dis Assoc Disord. 2003;17(3):154–61. doi: 10.1097/00002093-200307000-00007. [DOI] [PubMed] [Google Scholar]