Abstract
A chip-based immunocapillary electrophoresis system has been employed to measure the concentrations of brain-derived neurotrophic factor (BDNF) in human skin biopsies, taken during atopic inflammatory events. The device employs a replaceable immunoaffinity disk to which capture antibodies have been chemically immobilized. Homogenates obtained from micro-dissected human skin samples were injected into the system where the analyte of interest was captured in the immunoextraction port, thus allowing non-reactive materials to be removed prior to analysis. The captured analyte was labeled in situ with a red-emitting laser dye before being released from the capture antibody, separated by electrophoresis, and the resolved peaks detected by on-line laser-induced fluorescence. Comparison of this chip-based system to conventional immunoassay demonstrated good correlation when analyzing both standards and patient samples. The system was semi-automated resulting in a CE analysis within 1.5 min and a total of circa 5 min. Intra- and inter-assay CV’s of 3.85 and 4.19 were achieved with circa 98.8% recovery of BDNF at a concentration of 100 pg/mL. The assay demonstrated clear differences between clinical stages of atopic dermatitis in human patients and could run 10–15 samples per hour. This system holds the potential for being modified to be a portable unit that could be used in clinics and other biomedical screening studies.
Keywords: Chip-based CE, Immunoaffinity, Inflammation, Clinical assessment, Allergic dermatitis
Introduction
Neuropeptides and their role in regulating inflammatory processes is becoming a topic of major interest in clinical medicine. It has been established that substance P and calcitonin-gene related peptide are associated with inflammation-associated pain [1–3]. Recently, the role of other neuropeptides has been investigated, especially the neurotrophin family, of which brain-derived neurotrophic factor (BDNF) belongs, and have been shown to play a role in airway inflammation [4]. BDNF has been shown to occur in high concentrations in several other lung inflammatory conditions such as asthma and hypoxic lung injury where it altered nitric oxide production and airway hyper-reactivity [5]. Further, it has been shown that dendritic accessory cells of the immune system are able to produce BDNF following stimulation with allergens and other mediators of inflammation [6] and also that monocytes actively produce and release neurotrophins, including BDNF, during allergic episodes [7]. Serum concentrations of BDNF in patients with atopic dermatitis have been shown to be elevated and correlate with disease severity [8, 9].
Measurement of BDNF in skin biopsies of atopic patients holds potential as a diagnostic aid provided correlation with clinical assessment could be established. Although serum concentrations of BDNF have shown correlations with clinical assessment in patients with atopic dermatitis [9], the evidence that BDNF is produced by infiltrating cells would indicate that measurement of in situ concentrations would better reflect the true situation. To date little work has been performed on developing a quick, reliable approach to the measurement of BDNF in skin biopsies mainly due to the small amounts of tissue that are available. A logical approach to this situation is the application of microfluidics devices to the analysis of BDNF. Previously, our group has combined microfluidics chips with pre-analysis immunoaffinity selection [10] to measure inflammatory biomarkers in skin biopsies. Immobilized antibodies act as concentrators, improving both the selectivity and resolving power of the electrophoretic separation. Immunoaffinity capillary electrophoresis (ICE) can further be enhanced by using laser-induced fluorescence (LIF) detection.
The potential of miniaturized analytical techniques is expanding and the applications of techniques such as CE, microchip-based CE and ICE in biomedical research is beginning to become popular. This popularity is demonstrated be a series of recent reviews [11–14]. In the present study, we describe the development of a semiautomatic chip-based ICE system with a pre-separation immunoaffinity port and LIF detection. This system was used to measure BDNF in human skin biopsies, using selected micro-dissected tissue samples from allergic patients and controls.
2. Materials and methods
2.1. Reagents
Recombinant BDNF and its reactive biotinylated antibody were obtained from R & D Systems (Minneapolis, MN, USA). Both reagents were reconstituted to stock solutions of 1 μg/mL in 100 mM phosphate buffer, pH 7.4. Carbonyl diimidazole and streptavidin were purchased from Pierce Biotechnology (Rockford, IL, USA). All other chemicals were purchased from Acros Chemicals (Fisher Scientific, Pittsburgh, PA, USA). Immediately prior to use, all solutions were passed through 0.2 μm NC filters (Millipore, Bedford, MA, USA) to remove particulate impurities.
2.2 Standards and patient samples
The stock solution of BDNF was diluted in 100 mM phosphate buffer, pH 7.4 and used to construct calibration curves for calculating the concentrations of BDNF present in the patient biopsy samples. Additionally, these standards were used to determine the LOD and saturation parameters of the system.
Skin biopsies were collected from patients diagnosed with atopic dermatitis to nickel at the Allergy Clinic of the George Washington University Hospital, Washington, DC, USA. These patients were broken into three groups: 20 patients with severe allergic skin lesions, 20 patients with moderate allergic lesions and 20 patients with mild allergic lesions. Additionally, a further group of non-allergic, normal subjects were collected. All patients and controls were 25–40 years of age. Consent to use the samples were obtained from all subjects and no name indicators were assigned to any samples as required by the hospital institutional review board.
In this study, it was decided to continue to use frozen sections of the patient biopsies rather than formalin-fixed tissue as previous experience had demonstrated that formalin, which is a routine fixative in pathology departments, cross-links proteins thus greatly reducing their availability to the capture antibodies. Previously, we had discovered that formalin-fixed tissue was unsuitable for the recovery of inflammatory cytokines from skin biopsies and thus choose to continue to use frozen sections as previously described [10].
All samples were prepared for ICE analysis by micro-dissection as previously described [10]. Six-μm frozen sections from each biopsy were air-dried on glass microscope slides and stained with a 0.01% aqueous solution of cotton blue, to aid in morphological identification. Tissue areas containing either cellular-infiltration or normal tissue taken 2-mm and 10-mm from the lesion, were dissected using an Eppendorf Micro-dissector (Eppendorf North America, Westbury, NY, USA) equipped with an oscillating micro-chisel. This was moved around the area of interest to leave an island of tissue surrounded by a circle of clear glass, which was extracted by placing 100-μL of warm (22°C) 100 mM phosphate buffer, pH 7.4, containing 0.1% v/v Brij 35 detergent and 1 mM of leupeptin over the sample, using the Micro-dissector’s micropipette. The fluid was recovered with the micropipette and clarified by passage through a 100 kDa cut-off ultramicro Spin Con dialyzer (The Nest Group, Southborough, MA, USA) to remove extraneous macromolecules prior to analysis. Measurement of the total protein content of each sample was performed by direct spectrophotometry at 280/260 nm using a NanoDrop ND-100 micro-spectrophotometer (NanoDrop Technologies, Wilmington, DE, USA) using a molar absorption coefficient of 10 as recommended by the Pierce Biotechnology [15]. Each sample was then adjusted to a protein concentration of 1 μg/mL in 100 mM phosphate buffer/0.1%Brij 35, pH 7.4 prior to analysis.
2.3 Instrumentation
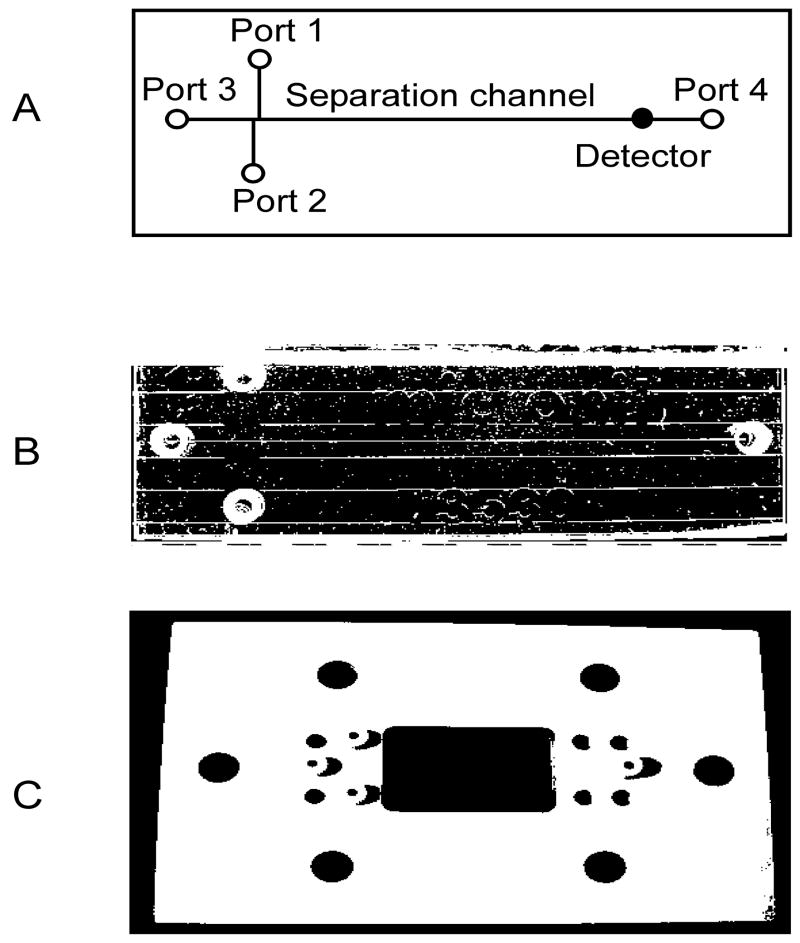
The ICE analyses were performed on a Micralyne μTK microfluidic electrophoresis system (Micralyne, Edmonton, Alberta Canada). This instrument was equipped with four dual-channel 6 kV power boards and an integrated 635 nm, 8 mW red diode laser. Detection was achieved by an epi-illumination microscope equipped with a Hamamatsu H5773-03 photomultiplier tube and a 16-bit data acquisition board. In the present studies, the instrument was equipped with four platinum electrodes plus a custom-designed chip stage that accepted standard T3530 CE chips from Micronit Microfluidics BV (Enschede, The Netherlands). This chip had a double T injection, channels that were 50-μm wide and 20-μm deep, and a separation channel length of 35 mm. A Harvard “11” syringe pump (Harvard Apparatus, Holliston, MA, USA) was connected via an automatic injection valve (Upchurch Scientific) fitted with a calibrated 200-nL loop to port 1 of the chip (figure 1A). This was achieved by placing poly-ether-ether-ketone (PEEK) tubing (20 mm id, 360 mm od – Upchurch Scientific) into port 1(figure 1A), alongside the electrode using a modified F-123 Nanoport nut fitting (Upchurch Scientific, Oak Harbor, WA, USA), which was used for sample injection and port washing. Control of the entire system was achieved by a PC, running Microsoft Windows XP with a compiled LabView interface (National Instruments, Austin, TX, USA).
Figure 1.
The ICE chip. A. A diagrammatic representation of the ICE chip illustrating the port designations used in the text of Section 2.5, the separation channel and the position of the detector; B. Photograph of the chip; C. A photograph of the top template used for attaching the electrodes.
To facilitate sample and reagent loading in addition to ensuring tight port plugging Upchurch F-121H nuts (Upchurch Scientific) were placed in all of the ports using a PEEK cover plate (figure 1C).
2.4 Preparation of the immunoaffinity inserts
The immunoaffinity insert was prepared by a modification of the techniques previously described for [10]. Briefly, 2-mm diameter disks were punched from AP40 glass fiber filters (Millipore) and soaked in 10% v/v aqueous 3-aminopropyl-triethoxysilane for 10 min then heated at 100°C for 60 min and cooled to room temperature. Fresh silane was applied and the process repeated four times. The disks were then placed into 10 mM hydrochloric acid, incubated for 60 min at 100°C, washed twice in distilled water and finally incubated in a solution of 1 mg/ml carbonyl diimidazole dissolved in formamide for 6h at room temperature. Prior to immobilization of the allergen, the disks were washed 5 times in formamide and then placed in a 1 μg/mL solution of streptavidin dissolved in 100 mM phosphate buffer, pH 7.4 and incubated overnight on a rotary plate mixer at room temperature. The excess or non-bound streptavidin was removed by extensive washing to the phosphate buffer and excess carbodiimide side chains blocked by a further incubation in 200 mM Tris-HCl buffer, pH 9.0.
2.5 ICE measurement of BDNF
The CE-immunoassay programme together with separation and analysis steps was programmed into the LabView interface sequence, which then controlled the sample injection, flushing, labeling, elution, separation, and detection. Basically, the entire system was primed with running buffer (100 mM phosphate/0.1% Brij 35 buffer, pH 7.4) before the pump was programmed to introduce a 200-nL sample into the immunoaffinity port (port 1) at a flow rate of 400-μL/min. Following a 1 min incubation, during which the immunoaffinity port extracted the appropriate analyte, port 1 was flushed to remove non-reactive materials by passing 0.5-mL of buffer from port 1 to port 2. Laser dye (200-nL) was pumped into port 1 and allowed to react with the bound analytes for 1 min before being flushed out of the system in a similar manner as previously described. The bound analyte were recovered by introducing 200-nL of 100 mM phosphate buffer, pH 1.0 into port 1 and allowing the mixture to remain in port 1 for 1 min before applying a 6 kV potential between ports 1 and 4 for 2 min. Online detection was achieved by focusing the detector at a point 0.5-cm from port 4. In this assay system, port 3 was not used and was blocked using an Upchurch P411 headless plug. All of the assays were run at room temperature and the concentrations of each separated peak calculated from a calibration curve constructed from known amounts of BDNF run under identical separation conditions. No internal standards were added to any of the samples.
2.6 Validation
The ICE measurements were validated by using split samples; the second sample being tested by a commercially available enzyme-linked immunosorbent assay (R & D Systems) run according to the manufacturer’s instructions.
3. Results
3.1 Characteristics of the system
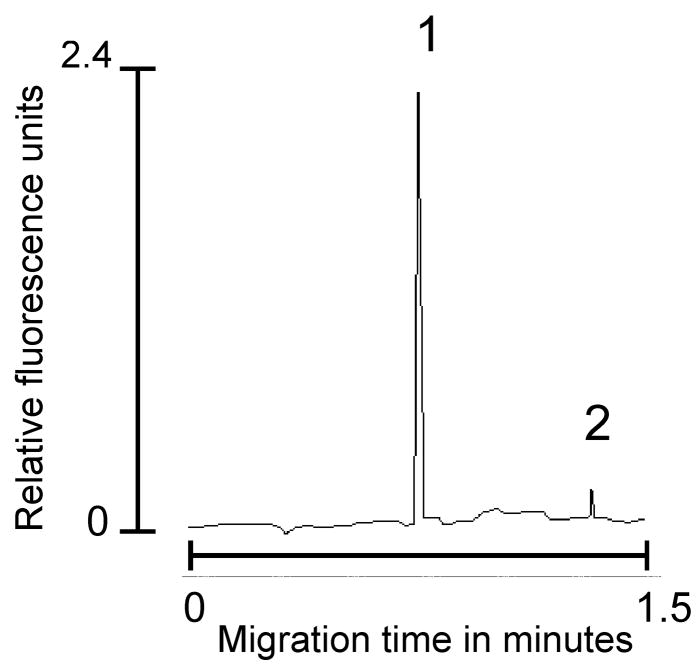
A complete cycle of the chip was circa 5 min during which BDNF was reliably captured, labeled, recovered, separated and measured. A typical electropherogram produced by the ICE immunoassay is shown in figure 2, representing recovery and detection of a 100 pg standard of recombinant BDNF. Protein studies on the immunoaffinity disk indicated that approximately 4.1 ng of antibody could be reliably immobilized on a 2-mm disk and that the LOD of the disk was 20 femtograms as determined by running dilutions of a BDNF standard through the system until no further signal was detected. Saturation was determined in a similar manner by applying increasing BDNF concentrations to the immunoaffinity disk until no further increase could be detected - the saturation was calculated to be 2.9 ng/mL. Recovery of BDNF from spiked normal human tissue extract was shown to be 97.1% at a concentration of 10 pg and 98.8% for BDNF at a concentration of 100 pg. Intra and inter-assay coefficients of variance were calculated from data obtained by applying a 100 pg standard for five repetitive runs on five separate days and demonstrated an intra-assay CV of 3.85% and inter-assay CV of 4.19%. Each batch of immunoaffinity disks were subjected to quality control studies in order to guarantee batch-to-batch uniformity. Disks were discarded when the performance of five randomly selected disks failed a 5% loss of selectivity or recovery.
Figure 2.
Typical electropherogram produced by running a 100 pg sample of BDNF in normal human tissue extract. Peak 1 is BDNF and peak 2 represents free dye which was always present and indicates inadequate flushing of port 1 following analyte labeling. Running parameters as described in Section 2.5.
3.2 Comparison with commercial immunoassays
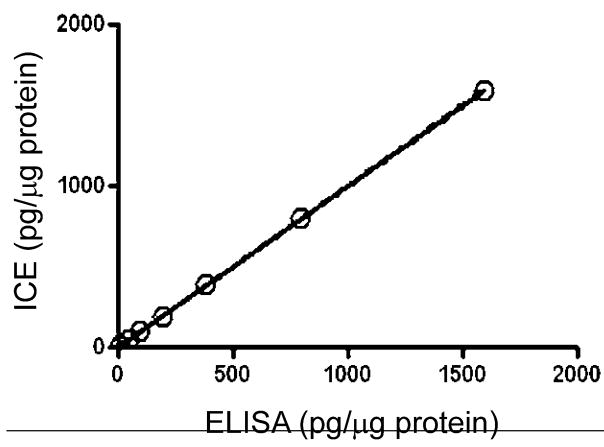
Comparison of the ICE immunoassay was made to a commercial high-sensitivity immunoassay kit, with an estimated LOD of circa 0.5 pg/mL. This comparison demonstrated a high degree of agreement as shown in Figure 3, by a least squares linear regression analysis of the results obtained by the two assays when measuring BDNF standards at 10, 50, 100, 200, 400, 800, and 1600 pg. This analysis was performed using the linear regression module of the Prism 4 software program (GraphPad Software, San Diego, CA, USA). Likewise, a similar high degree of agreement was seen when split patient samples were run by the same assays (slope = 0.9693 ± 0.0068 with an r2 value of 0.977).
Figure 3.
Comparison between the ICE system and a commercial ELISA immunoassay illustrating the linear regression analysis of BDNF in normal human tissue extract. The slope + 0.9972 ± 0.0032 with an r2 value of 0.999.
3.3 Measurement of BDNF in patient and control groups
Examination of the micro-dissected biopsy samples taken from the patient and control groups demonstrated the ability of the chip-based system to distinguish between the different patient and control groups (Fig. 4). Baseline concentrations of BDNF (less than 20 pg/mg protein) were found in the normal controls, whereas the patient groups demonstrated elevated concentrations of the analyte ranging from 89.8 ± 10.8 pg/μg extracted protein in the mild group to 260 ± 36.4 pg/μg extracted protein in the moderate group and 651.4 ± 97.6 pg/μg extracted protein in the severe group. In the patient groups, ICE analysis was able to distinguish not only differences in the severity of the lesions but could also detect different patterns in analyte concentrations at different sampling sites. Within the lesion site, BDNF concentrations were found to be highest with a gradual reduction at sites taken from areas distant from the lesion itself (figure 4). These diminishing concentrations of BDNF indicate that the analyte of interest is being produced locally by the infiltrating cells and emphasizes the importance of measuring BDNF in situ. This data also indicates that sampling taken a short distance from the lesion could potentially be a better baseline measurement than comparison to normal tissues.
Figure 4.
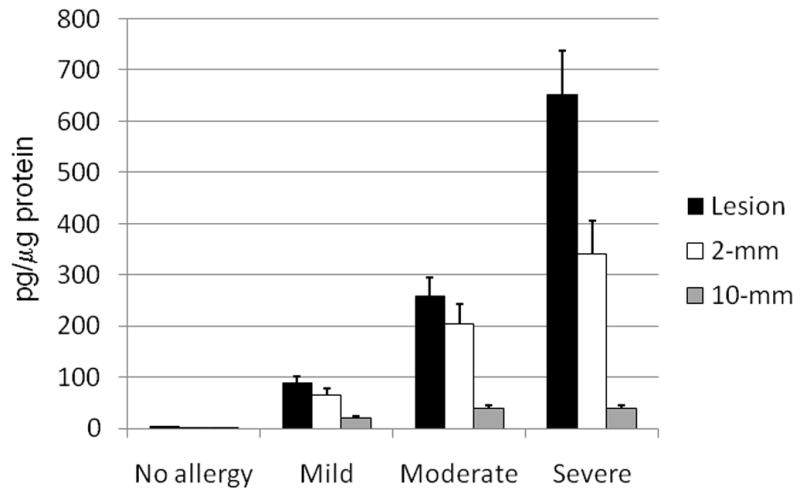
Concentrations of BDNF in the subject and control groups measured by ICE at 18 h post-initial onset of the reaction. The black filled bars represent the amount of BDNF measured within the lesion, while the unfilled bars represent the background amounts of BDNF measured in tissue taken 5 mm from the periphery of the lesion. The grey filled bars represent the amount of background BDNF measured in tissue taken 10 mm from the periphery of the lesion. All values are the mean ± S.E.M.
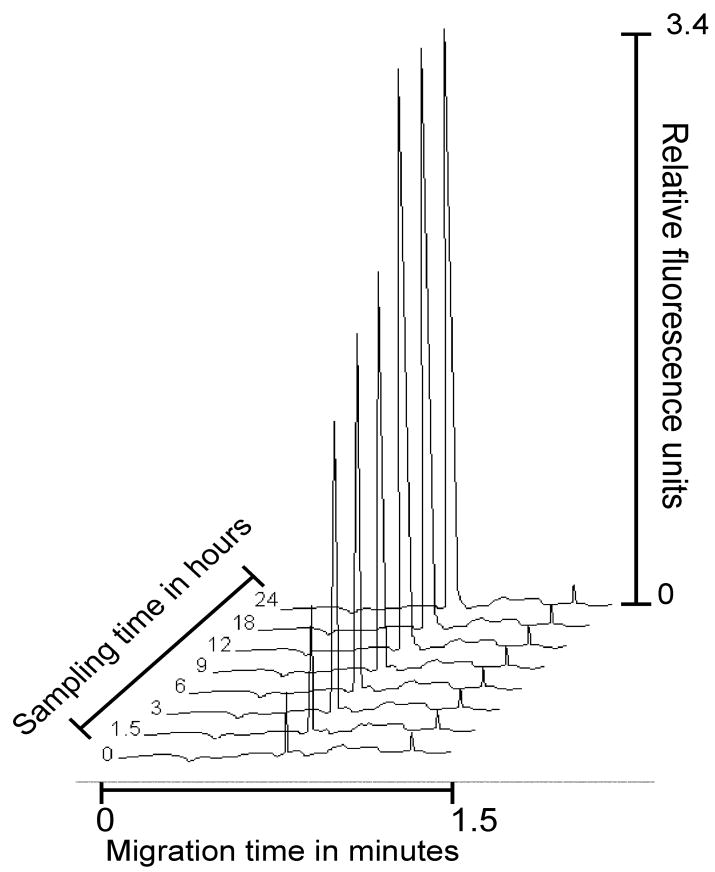
Examination of sequential biopsies taken from the same lesion, of a patient undergoing a severe reaction, over time demonstrated that the concentration of BDNF became elevated over a 12 h period, reaching concentrations of 650.4 ± 21.8 pg/μg extracted protein then becoming stabilized for the next 12 hours (figure 5). Comparison of the ICE findings with classical histopathology of the same biopsies showed a close correlation with the degree of cellular infiltration corresponding to the concentrations of BDNF measured in the tissue. However, ICE analysis including micro-dissection was achieved within the same day, whereas classical histopathology took several days to complete. Even when frozen sections were used in both assessments, ICE still proved to be the more rapid of the two techniques. Further, ICE was able to give a quantitative measurement of the tissue resident BDNF.
Figure 5.
Sequential ICE electropherograms of BDNF concentrations present in biopsies taken at different time points in a patient with severe atopic dermatitis illustrating the concentrations of detectable BDNF over time. Analysis conditions as described in Section 2.5.
4 Discussion
The development and application of chip-based devices to biomedical research has greatly escalated in the past few years [16–22]. This popularity is mainly due to the decreased sample and reagent consumption offered by these devices in addition to the often extremely short analytical times. Microfluidic devices have been shown to be capable of measuring multiple analytes in a matter of minutes using samples as low as 200 nL in size [10], especially when capillary electrophoresis is employed as the analytical tool. Basic CE, whether in standard or chip formats can be greatly enhanced by marrying the separation to a number of high sensitivity detectors such as LIF detectors or mass spectrometers. Chip-based CE can also be enhanced by the addition of pre-separation concentrators such as affinity or immunoaffinity devices. In fact, such devices can be integrated into the CE system to produce affinity (ACE) [23–28] or immunoaffinity CE (ICE) [10, 19, 29–33] such as that described in this manuscript. The advantage of this addition is that the affinity or immunoaffinity ligands act as selective capture devices, thus acting as pre-analytical concentrators [13, 19, 34, 35]. In particular, when handling complex biological matrices, the employment of pre-analytical immunoaffinity extraction greatly enhances the efficiency of the separation procedure by actively selecting the analytes of interest and extracting them from the biological matrix. This in turn allows for shorter separation channels due to the reduced or lack of interference from extraneous molecules. In the present studies, the immunoaffinity port extracted the analyte of interest, BDNF, from the complex matrix of tissue homogenate. Provided the specificity of the antibody is carefully checked and introduced into the analytical system in excess, one is assured that the majority of the desired analyte will be successfully extracted and released into the analytical section of the CE.
ICE holds several advantages over conventional plate-based immunoassays in that it requires extremely small samples, thus reducing the amounts of patient materials required for analysis (200 nL vs 50 μL). Additionally, the immobilized antibodies can be regenerated up to 200 times, which further reduces costs and variability in the assay. The use of a replaceable immunoaffinity disk further reduces the assay costs as the glass chip can be used for an extended period of time. ICE also employs a single capture antibody, which is preferable when the analytes of interest contain a single reactive epitope. In such cases, ICE can be performed normally while immunoassays require alterations in procedure in order to perform competition assays. In comparison to ELISA, ICE can be used to analyze multiple analytes in the same sample [10, 22, 38], whereas ELISA usually measures a single analyte per sample. However, new developments in ELISA hold the potential for multi-analyte analysis. A further refinement of ICE is that it is a two-dimension assay as opposed to the single dimension of most immunoassays. ICE employs immunoaffinity capture in one dimension and electrophoresis in the other, thus helping to reduce the incidence of non-specific reactions and false positive; the electrophoretic phase separating the immunoaffinity bound materials and checking on selectivity [13].
ICE and chip-based ICE can be applied to many different analyses provided that suitable, specific antibodies exist that can be employed as immunoaffinity capture agents. To date, ICE has been applied to the analyses of a number of important biomedical analytes [36] including inflammatory biomarkers found in the cerebral spinal fluid of head injury patients [37] and for the measurement of hormones in human body fluids [38]. Additionally, both the Guzman and our groups have applied chip-based ICE to the measurement of the anti-inflammatory drug, naproxene [19, 39].
Acknowledgments
This work was supported by the Intramural Program of the National Institutes of Health, Bethesda, MD, USA.
Abbreviations
- BDNF
brain-derived neurotrophic factor
- ICE
immunoaffinity capillary electrophoresis
References
- 1.Peters EM, Ericson ME, Hosoi J, Seiffert K, Hordinsky MK, Ansel JC, Paus R, et al. J Invest Dermatol. 2006;126:1937–1947. doi: 10.1038/sj.jid.5700429. [DOI] [PubMed] [Google Scholar]
- 2.Birklein F, Schmelz M. Neurosci Lett. 2008;437:199–202. doi: 10.1016/j.neulet.2008.03.081. [DOI] [PubMed] [Google Scholar]
- 3.Rittner HL, Brack A, Stein C. Brit J Anaesth. 2008;101:40–44. doi: 10.1093/bja/aen078. [DOI] [PubMed] [Google Scholar]
- 4.Jornot L, Lacroix JS, Rochat T. Eur Respir J. 2008;32:769–774. doi: 10.1183/09031936.00051608. [DOI] [PubMed] [Google Scholar]
- 5.Bennedich Kahn L, Gustafsson LE, Olgart Höglund C. Eur J Pharmacol. 2008;595:78–83. doi: 10.1016/j.ejphar.2008.07.041. [DOI] [PubMed] [Google Scholar]
- 6.Noga O, Peiser M, Altenähr M, Schmeck B, Wanner R, Dinh QT, Hanf G, et al. Clin Exp Allergy. 2008;38:473–479. doi: 10.1111/j.1365-2222.2007.02907.x. [DOI] [PubMed] [Google Scholar]
- 7.Rost B, Hanf G, Ohnemus U, Otto-Knapp R, Groneberg DA, Kunkel G, Noga O. Regulatory Pept. 2005;124:19–25. doi: 10.1016/j.regpep.2004.06.024. [DOI] [PubMed] [Google Scholar]
- 8.Raap U, Werfel T, Goltz C, Deneka N, Langer K, Bruder M, Kapp A, et al. Allergy. 2006;61:1416–1418. doi: 10.1111/j.1398-9995.2006.01210.x. [DOI] [PubMed] [Google Scholar]
- 9.Namura K, Hasegawa G, Egawa M, Matsumoto T, Kobayashi R, Yano T, Katoh N, et al. Clin Immunol. 2007;122:181–186. doi: 10.1016/j.clim.2006.10.011. [DOI] [PubMed] [Google Scholar]
- 10.Phillips TM, Wellner EF. Electrophoresis. 2007;28:3041–3048. doi: 10.1002/elps.200700193. [DOI] [PubMed] [Google Scholar]
- 11.Fogarty BA, Lacher NA, Lunte SM. In: Microchip Capillary Electrophoresis: Methods and Protocols. Henry CS, editor. Totowa: Humana Press, Inc; 2006. pp. 159–186. [DOI] [PubMed] [Google Scholar]
- 12.Kasicka V. Electrophoresis. 2008;29:179–206. doi: 10.1002/elps.200700550. [DOI] [PMC free article] [PubMed] [Google Scholar]
- 13.Guzman NA, Blanc T, Phillips TM. Electrophoresis. 2008;29:3259–3278. doi: 10.1002/elps.200800058. [DOI] [PMC free article] [PubMed] [Google Scholar]
- 14.Hernandez E, Benavente F, Sanz-Nebot V, Barbosa J. Electrophoresis. 2008;29:3366–3376. doi: 10.1002/elps.200700872. [DOI] [PubMed] [Google Scholar]
- 15.Pierce Biotechnology. Tech Tip #6. Thermo Scientific Inc; Rockford, IL: 2008. [Google Scholar]
- 16.Chiem N, Harrison DJ. Anal Chem. 1997;69:373–378. doi: 10.1021/ac9606620. [DOI] [PubMed] [Google Scholar]
- 17.Regnier FE, He B, Lin S, Busse J. Trends Biotechnol. 1999;17:101–106. doi: 10.1016/s0167-7799(98)01294-3. [DOI] [PubMed] [Google Scholar]
- 18.Sato K, Tokeshi M, Kimura H, Kitamori T. Anal Chem. 2001;73:1213–1218. doi: 10.1021/ac000991z. [DOI] [PubMed] [Google Scholar]
- 19.Guzman NA. Electrophoresis. 2003;24:3718–3727. doi: 10.1002/elps.200305647. [DOI] [PubMed] [Google Scholar]
- 20.Haes AJ, Terray A, Collins GE. Anal Chem. 2006;78:8412–8420. doi: 10.1021/ac061057s. [DOI] [PubMed] [Google Scholar]
- 21.Demianova Z, Shimmo M, Poysa E, Fransssila S, Baumann M. Electrophoresis. 2007;28:422–428. doi: 10.1002/elps.200600334. [DOI] [PubMed] [Google Scholar]
- 22.Phillips TM, Wellner E. J Chromatogr A. 2006;1111:106–111. doi: 10.1016/j.chroma.2006.01.102. [DOI] [PubMed] [Google Scholar]
- 23.Sloat AL, Roper MG, Lin X, Ferrance JP, Landers JP, Colyer CL. Electrophoresis. 2008;29:3446–3455. doi: 10.1002/elps.200700808. [DOI] [PubMed] [Google Scholar]
- 24.Yang W, Sun X, Pan T, Woolley AT. Electrophoresis. 2008;29:3429–3435. doi: 10.1002/elps.200700704. [DOI] [PMC free article] [PubMed] [Google Scholar]
- 25.Hou C, Herr AE. Electrophoresis. 2008;29:3306–3319. doi: 10.1002/elps.200800244. [DOI] [PubMed] [Google Scholar]
- 26.Montes RE, Hanrahan G, Gomez FA. Electrophoresis. 2008;29:3325–3332. doi: 10.1002/elps.200700693. [DOI] [PubMed] [Google Scholar]
- 27.Heegaard NH, Schou C, Ostergaard J. Methods Mol Biol. 2008;421:303–338. doi: 10.1007/978-1-59745-582-4_21. [DOI] [PubMed] [Google Scholar]
- 28.Danel C, Azaroual N, Brunel A, Lannoy D, Vermeersch G, Odou P, Vaccher C. J Chromatogr A. 2008;1215:185–193. doi: 10.1016/j.chroma.2008.10.094. [DOI] [PubMed] [Google Scholar]
- 29.Guzman NA. Electrophoresis. 2003;24:3718–3727. doi: 10.1002/elps.200305647. [DOI] [PubMed] [Google Scholar]
- 30.Guzman NA. Anal Bioanal Chem. 2004;378:37–9. doi: 10.1007/s00216-003-2326-y. [DOI] [PubMed] [Google Scholar]
- 31.Delaunay-Bertoncini N, Hennion MC. J Pharm Biomed Anal. 2004;34:717–736. doi: 10.1016/S0731-7085(03)00559-4. [DOI] [PubMed] [Google Scholar]
- 32.Benavente F, Hernández E, Guzman NA, Sanz-Nebot V, Barbosa J. Anal Bioanal Chem. 2007;387:2633–2639. doi: 10.1007/s00216-007-1119-0. [DOI] [PubMed] [Google Scholar]
- 33.Miksa B, Chinnappan R, Dang NC, Reppert M, Matter B, Tretyakova N, Grubor NM, et al. Chem Res Toxicol. 2007;20:1192–1199. doi: 10.1021/tx7001096. [DOI] [PubMed] [Google Scholar]
- 34.Guzman NA, Phillips TM. Anal Chem. 2005;77:61A–67A. doi: 10.1021/ac053325c. [DOI] [PubMed] [Google Scholar]
- 35.Guzman NA, Stubbs RJ, Phillips TM. Drug Discov Today: Technol. 2006;3:29–37. doi: 10.1016/j.ddtec.2006.03.009. [DOI] [PubMed] [Google Scholar]
- 36.Amundsen LK, Siren H. Electrophoresis. 2007;28:99–113. doi: 10.1002/elps.200500962. [DOI] [PubMed] [Google Scholar]
- 37.Phillips TM. Electrophoresis. 2004;25:1652–1659. doi: 10.1002/elps.200305873. [DOI] [PubMed] [Google Scholar]
- 38.Wellner EF, Kalish H. Electrophoresis. 2008;29:3477–3483. doi: 10.1002/elps.200700785. [DOI] [PMC free article] [PubMed] [Google Scholar]
- 39.Phillips TM, Wellner EF. Biomed Chromatogr. 2006;20:662–667. doi: 10.1002/bmc.673. [DOI] [PubMed] [Google Scholar]


