

Abstract
Pure NMDA receptor (NMDAr)-mediated EPSCs, thought to correspond to “silent” glutamatergic synapses that lack AMPA receptors (AMPArs), have been observed in superficial spinal dorsal horn of neonatal but not adult rats. Recent anatomical studies suggest that AMPArs are present at virtually all glutamatergic synapses in this region in adults. We used antigen retrieval to examine colocalization of AMPArs and PSD-95 (a marker for glutamatergic synapses) in laminae I–II of neonatal and adult rats. We found a high degree of colocalization in all cases, which suggests that AMPArs are present in the great majority of glutamatergic synapses even in neonatal animals. We therefore reexamined evidence for silent synapses by performing blind whole-cell recordings from superficial dorsal horn neurons in slices from neonatal or adult rats, with focal stimulation to activate glutamatergic synapses. On some occasions in both neonatal (10 of 109, 9%) and adult (9 of 77, 12%) slices, NMDAr-mediated EPSCs were observed when the holding potential was raised to +50 mV at a stimulus strength that had failed to evoke AMPAr-mediated EPSCs. However, in all cases tested, AMPAr-mediated EPSCs were then observed when the cell was returned to −70 mV; this and other properties of the EPSCs suggest that they do not represent genuine silent synapses. When compared with previous findings, our results indicate that the appearance of silent synapses depends on experimental protocol. This suggests that pure NMDAr-mediated EPSCs seen in previous studies do not correspond to AMPAr-lacking synapses but result from another mechanism, for example, loss of labile AMPArs from recently formed synapses.
Introduction
Glutamate is the main excitatory transmitter in the spinal dorsal horn and is released by primary afferents, axons of excitatory interneurons, and certain descending axons (Broman, 1994; Todd et al., 2003; Todd and Koerber, 2005). Glutamate acts on ionotropic and metabotropic receptors, which are widely distributed throughout the dorsal horn. Ionotropic receptors of the AMPA type (AMPArs) mediate fast excitatory transmission (Yoshimura and Jessell, 1990; Yoshimura and Nishi, 1992) and convey information perceived as pain (Dickenson et al., 1997; Garry and Fleetwood-Walker, 2004). In contrast, NMDA receptors (NMDArs) are blocked by Mg2+ at resting potential but activated when the membrane is depolarized, allowing entry of Ca2+, which leads to central sensitization of dorsal horn neurons. NMDAr activation underlies certain forms of hyperalgesia and allodynia (Dickenson et al., 1997).
Electrophysiological studies have demonstrated EPSCs mediated by NMDA but not AMPA receptors in brain (Kullmann, 1994; Isaac et al., 1995; Liao et al., 1995; Durand et al., 1996; Montgomery et al., 2001) and spinal cord (Bardoni et al., 1998; Li and Zhuo, 1998; Baba et al., 2000; Jung et al., 2005). The most widely accepted explanation of this phenomenon is that there are silent synapses that possess NMDArs but lack functional AMPArs. It is thought that “unsilencing” of these by insertion of AMPArs contributes to long-term potentiation and maturation of glutamatergic synapses.
Studies of silent synapses in spinal cord have used “minimal stimulation” protocols, in which electrical stimuli are applied near the recorded cell or in the dorsal root (Bardoni et al., 1998; Li and Zhuo, 1998; Baba et al., 2000) and stimulus amplitude is reduced to a level at which AMPAr-mediated EPSCs are no longer detected. Changing the holding potential to a positive value while continuing stimulation at this intensity sometimes resulted in NMDAr-mediated EPSCs. Li and Zhuo (1998) and Bardoni et al. (1998) observed pure NMDAr EPSCs in neurons in spinal cord slices from rats aged <15 d. Baba et al. (2000) reported that, although such EPSCs could be detected in slices from neonatal rats, they were not seen in those from adults and concluded that silent synapses were developmentally regulated.
We recently used an antigen retrieval method that reveals synaptic proteins and demonstrated a very high degree of colocalization of AMPArs with PSD-95 in laminae I–III of adult rat spinal cord (Polgár et al., 2008). PSD-95, a member of the membrane-associated guanylate kinase (MAGUK) family, is thought to be an integral part of the postsynaptic density at glutamatergic synapses, and our finding therefore suggests that AMPArs are present at virtually all glutamatergic synapses in this region in the adult. In this study, we have analyzed the relationship between AMPArs and PSD-95 in adult and neonatal rats to look for evidence of AMPAr-lacking synapses in young animals. Because our results did not support the suggestion that significant numbers of glutamatergic synapses lack AMPArs at any of the ages examined, we performed electrophysiological studies on slices from neonatal and adult rats, to reexamine the evidence for silent synapses.
Materials and Methods
All experiments were approved by the Ethical Review Process Applications Panel of the University of Glasgow and were performed in accordance with the European Community directive 86/609/EC and the United Kingdom Animals (Scientific Procedures) Act 1986.
Immunocytochemical detection of AMPArs.
Wistar rats of either sex were used in this part of the study. These included adults (230–280 g; Harlan), as well as animals aged 2 weeks and 1 week (Glasgow University Biological Services). In all cases, the animals were deeply anesthetized with pentobarbitone and perfused through the left ventricle with fixative that contained 4% freshly depolymerized formaldehyde (200 ml for 1- or 2-week-old rats, 1000 ml for adults). Midlumbar spinal cord blocks were dissected out, stored in the same fixative for 2–8 h at 4°C, and cut into 60 μm transverse sections with a Vibratome. The sections were treated in 50% ethanol for 30 min to enhance antibody penetration and processed for antigen retrieval by incubating them for 10 min at 37°C in 0.2 m HCl containing 1 mg/ml pepsin (Dako) (Watanabe et al., 1998; Nagy et al., 2004). The sections were then incubated for 3 d in a mixture of rabbit antibody against PSD-95 (1:200) (Fukaya and Watanabe, 2000) and guinea pig antibody that recognizes all four AMPAr subunits (pan-AMPAr antibody; 1:100) (Fukaya et al., 2006; Polgár et al., 2008), followed by 1 d in the appropriate species-specific secondary antibodies, which were raised in donkey and conjugated to Alexa 488 (1:500; Invitrogen) or Rhodamine Red (1:100; Jackson ImmunoResearch). They were mounted in antifade medium (Vectashield; Vector Laboratories) and stored at −20°C. All antibodies were diluted in PBS that contained 0. 3 m NaCl and 0.3% Triton X-100, and incubations were at 4°C.
Sections from six adult, five 2-week-old, and five 1-week-old rats were used to analyze immunoreactive puncta in laminae I and II. These sections were scanned with a Bio-Rad Radiance 2100 confocal microscope, and all of the analysis was performed with MetaMorph software (Universal Imaging Corporation) on stacks of confocal images scanned sequentially (to avoid fluorescent bleed-through) with a 60× oil-immersion lens and a z-separation of 0.3 μm. With the pan-AMPAr antibody, we found that there was a low level of staining over the cytoplasm of certain neurons, and, for each confocal image stack, we measured the mean pixel intensity over the cytoplasm of the five cells that showed the strongest staining and multiplied this by three to obtain a threshold value. Any punctum with at least one pixel that exceeded this threshold value was defined as pan-AMPAr immunoreactive. From each of the rats, we opened confocal image stacks representing PSD-95 and selected 100 immunoreactive puncta in lamina I and 200 such puncta in lamina II. To avoid bias, a grid was applied to each stack, and the punctum nearest the bottom right-hand corner of each grid square on a predetermined optical section was selected (Nagy et al., 2004). We then merged image stacks for PSD-95 and pan-AMPAr and determined whether each of the selected PSD-95-immunoreactive puncta was pan-AMPAr positive (i.e., had at least one pixel that exceeded the threshold for pan-AMPAr staining). For those PSD-95-immunoreactive puncta in which pan-AMPAr immunostaining was below threshold, we also noted whether weak pan-AMPAr immunoreactivity was present. The proportion of pan-AMPAr-positive puncta that were PSD-95 immunoreactive was determined by selecting 50 and 100 such puncta from laminae I and II for each animal, respectively, using a similar method.
The pan-AMPAr antibody was raised against residues 727-745 of the mouse GluR1 (a region that is identical in all four AMPAr subunits) and detected each of the four AMPAr subunits in transfected cells, with a trace of cross-reactivity to the kainate receptor subunit GluR6 (Fukaya et al., 2006). We have shown that, after antigen retrieval, all puncta that are immunostained with antibodies against GluR1, GluR2, GluR3, or GluR4 are also immunoreactive with this antibody (Polgár et al., 2008). The PSD-95 antibody was raised against the N-terminal region (residues 1-64) of mouse PSD-95 and recognizes a band of 87–97 kDa on Western blots of rat brain homogenates (Fukaya and Watanabe, 2000). This antibody does not show synaptic labeling in sections from a PSD-95 mutant mouse in which a truncated form of the protein is not targeted to synapses (Migaud et al., 1998; Polgár et al., 2008).
Preparation of slices for whole-cell recording.
Neonatal (aged 4–14 d; Glasgow University Biological Services) and young adult (aged 6–9 weeks; 140–290 g; Harlan) Wistar rats of either sex were used in this part of the study. The methods used for preparing spinal cord slices were similar to those described previously (Yasaka et al., 2007), with minor modifications. Briefly, the rats were deeply anesthetized with halothane, and, after thoracolumbar laminectomy, the lumbosacral spinal cord was excised and placed in a preoxygenated cold (1–3°C) low-sodium Krebs' solution containing the following (in mm): 250 sucrose, 2.5 KCl, 0.5 CaCl2, 6 MgCl2, 1.25 NaH2PO4, 26 NaHCO3, and 25 glucose. The rats were then immediately killed by decapitation. All of the ventral and dorsal roots were cut, and the pia-arachnoid membrane was removed. Transverse slices (500 μm) were cut on a vibrating-blade microtome (VT1000S; Leica Microsystems) and stored in the same solution. After a recovery period of at least 1 h, the slice was transferred to the recording chamber and perfused continuously at a flow rate of 5 ml/min with normal Krebs' solution equilibrated with 95% O2 and 5% CO2 at room temperature. The Krebs' solution contained the following (in mm): 125 NaCl, 2.5 KCl, 2 CaCl2, 1 MgCl2, 1.25 NaH2PO4, 26 NaHCO3, and 25 glucose.
Recording and stimulation.
Blind whole-cell recordings were made from neurons in the superficial dorsal horn (laminae I–II) using patch pipettes filled with a solution containing the following (in mm): 110 Cs2SO4, 5 tetraethylammonium (TEA)-Cl, 0.5 CaCl2, 2 MgCl2, 5 EGTA, 5 HEPES, 5 Mg-ATP, and 5 QX-314 [N-(2,6-dimethylphenylcarbamoylmethyl) triethylammonium chloride], as described previously (Yasaka et al., 2007). The tip resistance of the patch pipettes was 8–12 MΩ. Signals were acquired with an Axopatch 200B amplifier (Molecular Devices). Data were digitized with an analog-to-digital converter (Digidata 1321A; Molecular Devices), stored on a personal computer using a data acquisition program (Clampex version 9; Molecular Devices), and analyzed with Clampfit software (version 9; Molecular Devices). In one series of experiments, 1,2-bis(2-aminophenoxy)ethane-N,N,N′,N′-tetraacetic acid (BAPTA) was used in the pipette solution, which contained the following (in mm): 50 Cs2SO4, 40 Cs-BAPTA, 5 TEA-Cl, 4 CaCl2, 2 MgCl2, 5 EGTA, 5 HEPES, 5 Mg-ATP, and 5 QX-314.
A minimal stimulation protocol was used to detect silent synapses (see Fig. 3A). Glass pipettes of the same type as the recording electrodes were used for focal stimulation. In voltage-clamp mode, cells were initially held at −70 mV. A stimulating electrode was then placed as close as possible to the recorded cell, and focal stimulation was applied at low frequency (0.2 Hz, 100 μs duration). If EPSCs were not evoked in the recorded cell, the stimulating electrode was moved to another location near the cell. The distance between stimulating and recording electrodes was generally <100 μm. Once evoked EPSCs were observed, the stimulus intensity was reduced to just below threshold, so that the cell failed to respond to the focal stimulation. After a certain number of failures, the membrane potential of the recorded cell was raised to +50 mV to test whether NMDAr-mediated EPSCs were present. In most cases, the membrane potential was then returned to −70 mV to check whether AMPAr-mediated EPSCs were present, and, in many cases, the threshold stimulus intensity for evoking AMPAr-mediated EPSCs was measured again. IPSCs were blocked by administering bicuculline (10–20 μm) and strychnine (5 μm) continuously throughout the period of recording. The absence of IPSCs, which might have been mistaken for NMDAr-mediated EPSCs at +50 mV, was checked for each cell for the first site from which focal stimulation evoked EPSCs, by raising the holding potential to ∼0 mV and applying between 1 and 20 stimuli. This test was performed just before increasing the holding potential to +50 mV. After each change in the holding potential, test stimuli were resumed as soon as membrane current had stabilized.
Figure 3.

Recording from superficial dorsal horn neurons and application of focal stimulation. A, Schematic diagram of experimental arrangement. Whole-cell recordings were obtained from lamina I/II neurons, and EPSCs evoked by focal stimulation were recorded while IPSCs were blocked by bicuculline and strychnine. B, Pharmacological demonstrations of EPSC components. At a holding potential of −70 mV (bottom records), inwardly directed EPSCs with fast kinetics were abolished by NBQX but not APV. At a holding potential of +50 mV (top 2 rows of records) outwardly directed EPSCs with slow kinetics were blocked by APV, whereas EPSCs with fast kinetics were sensitive to NBQX. Note different timescales for top and middle rows of records. C, Locations of the intracellularly labeled neurons. The plots show the locations of 32 neurons recorded in slices from neonatal animals (top) and 32 neurons recorded in slices from adult animals (bottom). In each case, cells that showed EPSCs at positive holding potentials are shown with filled circles, and the other cells are shown with open circles.
Identification of superficial dorsal horn neurons.
As reported previously (Yoshimura and Jessell, 1989), the superficial dorsal horn was easily identified with a binocular microscope as a translucent band. Neurons were recorded within this region at a depth of 100–300 μm from the surface of the slices, and, in most cases, their identity was further confirmed by labeling with Neurobiotin (0.2% in the electrode solution; Vector Laboratories) from the patch pipette. After completion of the electrophysiological recordings, the spinal cord slices were immersed overnight in 4% freshly depolymerized formaldehyde in 0.1 m phosphate buffer, pH 7.4, at 4°C, rinsed in phosphate buffer, and then sectioned transversely at 60 μm thickness with a Vibratome. Free-floating sections were incubated overnight at 4°C in PBS that contained 0.3% Triton X-100 and streptavidin conjugated to Rhodamine Red (1:1000; Jackson ImmunoResearch) and then washed several times in PBS. The slices were mounted in Vectashield and scanned with a confocal microscope (Bio-Rad MRC1024) to determine the location of the cell body.
Drug application.
Drugs dissolved in Krebs' solution were applied by exchanging solutions via a three-way stopcock without altering the perfusion rate or temperature. The drugs used were strychnine (5 μm; Sigma), bicuculline (20–40 μm; Sigma), 2-amino-5-phosphonovaleric acid (APV) (50–100 μm; Tocris Bioscience), 2,3-dioxo-6-nitro-1,2,3,4-tetrahydrobenzo[f]quinoxaline-7-sulfonamide (NBQX) (20 μm; Tocris Bioscience), and BAPTA tetracesium salt (40 mm in pipette solution; Invitrogen). Stock solutions of strychnine and APV were prepared in water. The stock solutions of bicuculline and NBQX were prepared in dimethylsulphoxide (DMSO). The final concentration of DMSO used in the experiment did not exceed 0.1%.
Results
Immunocytochemistry
After antigen retrieval with pepsin, both PSD-95 and pan-AMPAr immunoreactivity were present throughout the gray matter of the spinal cord. As reported previously (Polgár et al., 2008), the density of staining with both antibodies was highest in lamina II (Fig. 1). A very similar laminar distribution of staining for both PSD-95 and pan-AMPAr was already present in the dorsal horn by 1 week of age, and, at low magnification, the main difference in the appearance at this stage was the absence of myelin bundles that pass through the medial part of the dorsal horn in the adult (Fig. 1).
Figure 1.

The distribution of PSD-95 and pan-AMPAr immunoreactivity in the dorsal horn of 1-week-old and adult rats, seen after antigen retrieval with pepsin. In each row, PSD-95 (red) is on the left, pan-AMPAr (pAMPAr, green) is in the middle, and a merged image is shown on the right. Note that the distribution of each type of staining is similar at the two ages, with the highest density in a region of the superficial dorsal horn that corresponds to lamina II. The myelin bundles (which appear as unstained areas in the medial part of the dorsal horn) are only present in the adult. Each image was obtained from a single optical section scanned with a confocal microscope. Scale bar, 100 μm.
At high magnification, the labeling with both antibodies was seen to be punctate, and the two types of immunoreactivity showed extensive colocalization at each developmental stage (Fig. 2). In the adult, immunostained puncta in lamina II often appeared in clusters that were arranged around an unlabeled central space (Fig. 2, arrows). These clusters are likely to represent synaptic glomeruli, because we have shown that the central area may be occupied by an axonal bouton that can be immunostained with antibody against VGLUT1 or labeled with the lectin Bandeiraea simplicifolia isolectin B4, which are markers for central terminals of low-threshold myelinated and nonpeptidergic unmyelinated primary afferent terminals, respectively (Nagy et al., 2004). These clusters appeared to be less common in the spinal cords of 2-week-old animals and were seldom seen in those from 1-week-old rats.
Figure 2.

Colocalization of punctate staining with the PSD-95 and pan-AMPAr (pAMPAr) antibodies in lamina II at different developmental stages. In each row, PSD-95 (red) is on the left, pan-AMPAr (pAMPAr, green) is in the middle, and a merged image is shown on the right. Note that most puncta are stained with both antibodies. Arrows indicate clusters of puncta that probably correspond to synaptic glomeruli. Each image is a projection of two confocal optical sections at 0.3 μm z-spacing. Scale bar, 5 μm.
Quantitative analysis of immunoreactive puncta in the superficial dorsal horn confirmed a high degree of colocalization of the two types of immunoreactivity (Table 1, Fig. 2). Between 93 and 94% of PSD-95-positive puncta in laminae I and II were classified as pan-AMPAr immunoreactive, because staining with the pan-AMPAr antibody exceeded the threshold value (see Materials and Methods). However, this is probably an underestimate because weak pan-AMPAr immunostaining was observed at many of the puncta that were below threshold. When these were included, the proportions of PSD-95 puncta with pan-AMPAr staining were between 97 and 99% (for laminae I and II at each age group). Between 94 and 99% of pan-AMPAr puncta were PSD-95 immunoreactive (Table 1). There was no significant difference in the proportion of PSD-95 puncta that were pan-AMPAr immunoreactive at any age in lamina I or II, either when using the threshold to determine the presence of pan-AMPAr staining or judging this by eye (two-way ANOVA, p > 0.05). There was also no difference in the proportion of pan-AMPAr puncta in lamina I or II that were PSD-95 immunoreactive at any age (one-way ANOVA, p > 0.05).
Table 1.
Colocalization of PSD-95 and pan-AMPAr punctate staining in lamina II at different ages
| Lamina | % PSD-95 also pan-AMPAr |
% pan-AMPAr also PSD-95 |
||
|---|---|---|---|---|
| I | II | I | II | |
| 1 week (n = 5) | 92.6 (88–96) | 93.9 (92–98) | 95.2 (92–98) | 97.4 (97–99) |
| 2 week (n = 5) | 93.4 (89–98) | 92.8 (88–95) | 93.6 (90–98) | 98.2 (96–99) |
| Adult (n = 6) | 94.3 (89–97) | 94.0 (91–97) | 96.7 (94–98) | 98.8 (96–100) |
Numbers in parentheses are the ranges within each group.
Electrophysiology
The sample of cells from which recordings were made
Blind whole-cell recordings were made from superficial dorsal horn neurons in transverse slices prepared from 30 adult and 40 neonatal rats. For 126 of the recorded neurons (59 in slices from adult rats, 67 in slices from neonatal rats), EPSCs were evoked by focal stimulation (Fig. 3A), and these were subsequently tested with the minimal stimulation protocol for the presence of “silent synapses” (see below). Sixty-four of these cells were labeled with Neurobiotin to confirm their location. These cells were situated throughout the superficial dorsal horn and were similarly distributed in slices from adult and neonatal animals (Fig. 3C).
EPSCs evoked by focal stimulation
The presence of AMPAr- and NMDAr-mediated components of the EPSCs evoked by focal stimulation was confirmed pharmacologically in an additional sample of 11 neurons (five from adult and six from neonatal animals) (Fig. 3B). APV substantially reduced the amplitude of EPSCs evoked at a holding potential of +50 mV, whereas subsequent application of NBQX abolished the residual fast component of these EPSCs. APV had no affect on the amplitude of EPSCs recorded at a holding potential of −70 mV, but these were completely abolished by subsequent application of NBQX. All experiments were conducted in the presence of bicuculline and strychnine, and IPSCs were never seen in response to focal stimulation.
Minimal stimulation test for silent synapses
Responses to focal stimulation were tested using the minimal stimulation protocol. Tests were performed at between 1 and 5 sites per neuron (average of 1.5), and the results obtained are summarized in Table 2. In total, tests were made after stimulation at 186 sites: 77 sites in slices from adult animals and 109 sites in slices from neonatal animals. In some of these experiments, BAPTA was included in the recording pipette, but, because this was found to have no significant effect on the appearance of EPSCs when the holding potential was raised to +50 mV (see below), data from recordings with and without BAPTA were pooled for this part of the analysis.
Table 2.
Summary of incidence of “silent synapses” in electrophysiological experiments
| Neonate | Adult | Total | |
|---|---|---|---|
| Number of cells | 67 | 59 | 126 |
| Number of connections | 109 | 77 | 186 |
| Number of silent synapses | 10 (9%) | 9 (12%) | 19 (10%) |
This shows the incidence of connections at which EPSCs were observed at a holding potential of +50 mV while stimulating at a level that was initially subthreshold while the cell was held at −70 mV (“silent synapses”). Results obtained in slices from neonates (4–14 d) or adults (6–9 weeks) are shown separately.
An example of the minimal stimulation protocol is illustrated in Figure 4A. Focal stimuli evoking EPSCs were initially applied while recording with a holding potential of −70 mV. The stimulus intensity was then reduced until the cell responded to fewer than 5% of a series of consecutive stimuli (5–172 stimuli, average of 39). The holding potential was then increased to +50 mV, and the response of the cell to focal stimulation at the same intensity was tested (6–98 stimuli, average of 34). For the majority of synaptic connections tested, no response occurred when stimuli were applied at the positive holding potential. However, in a minority of tests (19 of 186, 10%), EPSCs were evoked by stimuli applied while recording at a positive holding potential (Fig. 4). The proportion of stimulation sites at which EPSCs were evoked while the neuron was held at a positive potential did not differ significantly between slices from adult (11.7%) and neonatal (9.2%) animals (Table 2) (p = 0.8, Fisher's exact probability test). Furthermore, within the neonatal group, there was no correlation between the proportion of tested connections that showed this phenomenon and age of the animal from which the slice was obtained (r = −0.62, p = 0.1). All of the 19 connections for which EPSCs were seen when the neuron was held at a positive potential were obtained in different slices, and all but two of these were from different animals. Thirteen of these connections were at the first focal stimulation site used for the neuron under study, whereas five were obtained at the second and one at the third stimulation site. In some cases, there was variation in the latency of EPSCs evoked by stimuli close to threshold intensity while the cell was held at −70 and +50 mV. Some of this may be attributed to variation in the timing of transmitter release as has been reported to occur at certain synapses (Feldmeyer and Sakmann, 2000; Hefft and Jonas, 2005). However, at some connections, it may have resulted from the fact that focal stimulation at threshold intensity could activate more than one presynaptic element with similar thresholds, and any combination of these may be activated by successive stimuli applied at this intensity. There was also some variation in latency earlier in the stimulation protocol, when the cell was held at −70 mV and stimulation was above threshold.
Figure 4.

Minimal stimulation protocol and failure rate of responses to focal stimulation. A, Example of a minimal stimulation test. AMPAr-mediated EPSCs were initially recorded, and the stimulus intensity carefully reduced to a point just below that evoking EPSCs. While stimulating at this intensity, the membrane potential was increased to +50 mV to test for the presence of slow NMDAr-mediated EPSCs. For most cells, the holding potential was then returned to −70 mV to check for any change in the AMPAr-mediated responses. The top panel shows 20 individual records (top row) and averages of records made throughout the recording period at each holding potential. Two sets of records are shown for the initial period of recording at −70 mV: one while stimuli reliably evoked EPSCs and one made after the stimulus intensity had been reduced below the threshold level. The middle two rows show the stimulus intensity and the holding potential, and the bottom plot shows the amplitude of EPSCs evoked by test focal stimuli. This example was recorded in an adult slice with BAPTA in the electrode. B, Failure rate of EPSCs in response to focal stimulation. In the top graph, each line represents data for an individual connection. The failure rate was determined initially at −70 mV (left), then at +50 mV (middle), and then on returning to −70 mV (right). Connections tested in slices from adult and neonatal animals and with or without BAPTA in the recording electrode are shown. The bottom bar graph shows averaged data for the same connections. Note the similarity of results obtained from adult and neonatal animals and with or without BAPTA.
EPSC responses often occurred within the first few stimuli after raising the holding potential. In 15 of the 19 cases in which EPSCs were seen at +50 mV, the holding potential had been stepped to ∼0 mV (no correction made for liquid junction potential) before being raised to +50 mV to confirm the absence of IPSCs (see above). In six of these cases, EPSCs were seen within the first six stimuli while the cell was held at 0 mV, and, in 14 of the 19 cases, the first EPSCs were seen within four stimuli after the holding potential was raised to +50 mV.
In those cells that showed EPSCs when held at a positive potential, the EPSCs were not usually evoked by every stimulus. The response rate for the 19 connections ranged from 15 to 100% (average 35%) (Fig. 4B), and responses generally occurred throughout the period of stimulation (Figs. 4A, 5C). However, they were sometimes seen mainly in the early (Fig. 5A) or late (Fig. 5B) part of the period during which the cell was held at +50 mV. To establish whether EPSCs occurred more often during the early or late part of this period, we determined the proportion of these that occurred in response to the first 50% of stimuli that were applied while the cell was held at +50 mV. The mean value was 0.54 (range of 0.05–1), and this did not differ significantly from the value of 0.5 that would be expected if responses occurred in a random manner throughout the period (p = 0.52, one-sample t test).
Figure 5.
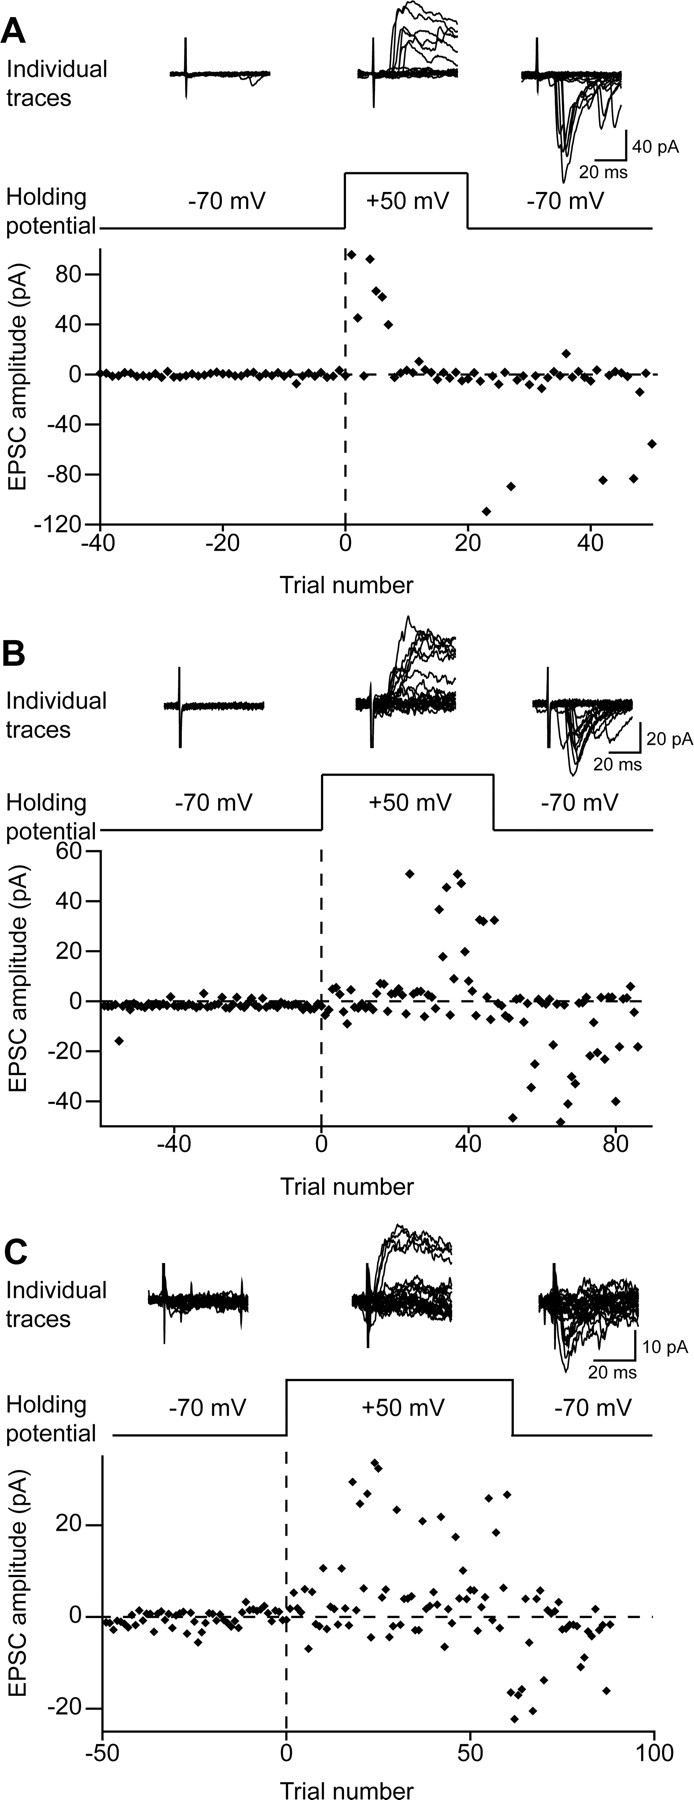
Examples of connections producing EPSCs at positive holding potentials. The top row of each section shows individual recordings from a neuron at different holding potentials: −70 mV, +50 mV, and on returning to −70 mV. The second row of each section indicates the holding potential, and the bottom plot shows the amplitudes of EPSCs evoked by focal stimulation. A, Recording from an adult slice using a pipette without BAPTA. B, Recording from a neonatal slice using a pipette without BAPTA. C, Recording from a neonatal slice using a pipette with BAPTA.
The amplitudes of the averaged EPSC responses seen at positive holding potentials ranged from 7 to 80 pA and were similar in neurons from adult and neonatal animals. In one case recorded in an adult slice, in which the pharmacology of these EPSCs was investigated, they were substantially reduced by application of the NMDAr blocker APV (Fig. 6).
Figure 6.

The effect of APV on EPSCs evoked by focal stimulation while the cell was held at +50 and −70 mV, after reduction of the stimulus strength to below the level that produced EPSCs when the cell was initially tested at −70 mV. The top traces show that APV substantially reduced the EPSC recorded at +50 mV, leaving a small residual current that was presumably mediated by AMPArs. The bottom trace shows a clear EPSC recorded in the presence of APV after the cell was returned to a holding potential of −70 mV. This recording was made in a slice obtained from an adult rat.
Effect of returning to a negative holding potential
For 109 of the 186 connections investigated, the holding potential was returned to −70 mV immediately after tests at +50 mV, and focal stimulation was continued at the same stimulus intensity. Ten of the connections tested in this way (five from adult animals and five from neonatal animals) belonged to the minority that responded with EPSCs on switching to the positive holding potential. In all of these cases, focal stimulation continued to evoke EPSCs on returning to the negative holding potential (Figs. 4, 5). In most cases (8 of 10), the response frequency at −70 mV was greater than that at +50 mV (average increase from 27 to 45%) (Fig. 4B). For one of these cases, an EPSC was seen when the holding potential was returned to −70 mV during application of APV, which had suppressed the NMDAr-mediated component of the EPSC seen at +50 mV (Fig. 6). To confirm that the EPSCs seen when returning to −70 mV were AMPAr mediated, we compared the half-widths of the EPSCs recorded at +50 mV and those recorded when the holding potential was returned to −70 mV in all 10 cases in which this phenomenon occurred. The ratios of these half-widths (+50/−70 mV) varied from 3 to 17.4 (median of 9.5), reflecting the much longer duration of NMDAr EPSCs. This did not differ significantly from the ratio of half-widths at +50 and −70 mV obtained from the 11 connections in which APV and NBQX were used to confirm the identity of the two types of EPSC (range of 3–25.5, median of 13.5; Mann–Whitney U test, p = 0.42). This strongly supports the suggestion that the EPSCs recorded at −70 mV after the cells had been held at +50 mV were mediated by AMPArs. We compared amplitudes of EPSCs evoked during the first half of the test period when the cell was returned to −70 mV (early) with those in the second half of this period (late). The mean ± SD ratio of late/early amplitudes was 0.94 ± 0.18, and this did not differ significantly from 1 (one-sample t test, p = 0.33), indicating that the amplitudes of EPSCs did not change during the course of the stimulation at −70 mV.
The remaining 99 connections that were tested using this paradigm showed no EPSCs at a positive holding potential. However, 10 of these showed EPSCs on returning to a negative holding potential. For 86 of the 89 connections that did not respond to focal stimulation at a positive holding potential or when the membrane potential was returned to −70 mV, the threshold stimulus intensity was measured again after returning to a holding potential of −70 mV in the same manner as at the start of the protocol. For 12 of the 86 connections, there had been no change in the threshold, whereas for the other 64, the threshold stimulus intensity was found to have increased. When the precise threshold stimulus intensity was determined (n = 63), it was found to have increased on average to 130% of the threshold value determined during the first stimulation period at a negative holding potential.
Effect of BAPTA
To test the possibility that the appearance of EPSCs when the holding potential was returned to −70 mV involved a Ca2+-dependent mechanism, BAPTA was included in the recording pipette solution in later experiments in the series. The results obtained with and without BAPTA in the recording electrode are summarized in Table 3. A total of 70 of the 186 connections investigated were recorded with BAPTA-containing electrodes (42 from young animals and 28 from adults). The great majority of connections tested with BAPTA (66 of 70) showed no EPSC responses at the positive holding potential. However, as with recordings that were made without BAPTA in the electrode, EPSCs were evoked in a small number of connections. Of these, 2 of 42 (4.8%) were recorded in young animals and 2 of 28 (7.1%) in adult animals. The total proportion of connections that showed this phenomenon when recordings were made with (4 of 70, 5.7%) or without (15 of 115, 13%) BAPTA did not differ significantly (Fisher's exact probability test, p = 0.21). In each of these four cases, EPSCs were seen on returning to the negative holding potential (Figs. 4, 5). Although we cannot be certain that BAPTA reached an adequate concentration to prevent rises in Ca2+ concentration throughout the dendritic trees of the cells, there are two reasons why we believe that this is very likely to have been the case. First, all of the cells had been in whole-cell configuration with BAPTA-containing pipettes for >20 min before the membrane potential was raised to +50 mV during focal stimulation, and we have found that 20 min is adequate to allow diffusion of Neurobiotin (which has a molecular weight of 323 compared with that of 478 for BAPTA), throughout the entire dendritic trees of lamina II neurons (T. Yasaka, unpublished observations). Second, the concentration of BAPTA in our pipettes (40 mm) was considerably higher than that generally used in whole-cell patch-clamp recording studies (5–20 mm).
Table 3.
Comparison of results obtained with and without BAPTA in the recording electrode in experiments in which the holding potential was returned to −70 mV
| Without BAPTA |
With BAPTA |
|||||
|---|---|---|---|---|---|---|
| Total | Neonate | Adult | Total | Neonate | Adult | |
| Number of cells | 39 | 21 | 18 | 49 | 28 | 21 |
| Number of connections | 53 | 30 | 23 | 70 | 42 | 28 |
| Number “silent” | 6 (11%) | 3 | 3 | 4 (6%) | 2 | 2 |
| Number of persistentEPSCs on return to −70 mV | 6 (100%) | 3 | 3 | 4 (100%) | 2 | 2 |
A summary of results obtained in slices from neonates (aged 4–14 d) or adults (aged 6–9 weeks), with or without BAPTA in the recording electrode. Number “silent” shows the number (and percentage) of connections at which EPSCs were observed at a holding potential of +50 mV while stimulating at a level that was initially subthreshold when the cell was held at −70 mV (“silent synapses”). The bottom row gives the number (and percentage) of these “silent synapses” for which AMPAr-mediated EPSCs were seen when the holding potential was returned to −70 mV.
Discussion
The main findings of this study were as follows: (1) there was a high degree of colocalization of punctate staining for AMPArs and PSD-95 in laminae I and II of adult and neonatal rats, with few PSD-95 puncta lacking pan-AMPAr immunoreactivity, and (2) genuinely silent (pure NMDAr-mediated) synapses were not observed in neurons recorded in this region after focal stimulation in slices from either adult or neonatal animals.
Anatomical detection of synaptic AMPArs
Conventional immunocytochemistry does not reveal synaptic receptors because of masking of epitopes after fixation (Fritschy et al., 1998). Watanabe et al. (1998) showed that antigen retrieval with pepsin gave punctate AMPAr immunoreactivity in hippocampus and concluded that this represented synaptic receptors. We reported that, after pepsin treatment of spinal cord sections, punctate staining can be seen with antibodies against each AMPAr subunit (Nagy et al., 2004) and with a pan-AMPAr antibody that detects all four subunits (Polgár et al., 2008). We confirmed that these puncta correspond to synaptic receptors by demonstrating their absence in knock-out animals, their association with glutamatergic boutons, and their ultrastructural location in postsynaptic densities (Nagy et al., 2004; Polgár et al., 2008). PSD-95, which is present in the postsynaptic density of glutamatergic synapses (Hunt et al., 1996; Valtschanoff et al., 1999; Sans et al., 2000), can also be revealed after pepsin treatment (Fukaya and Watanabe, 2000). We reported previously that ∼98% of PSD-95 puncta in laminae I–III of adult rat dorsal horn were pan-AMPAr immunoreactive, whereas >99% of pan-AMPAr-positive puncta in this region were PSD-95 immunoreactive (Polgár et al., 2008). Antal et al. (2008) used the highly sensitive freeze-fracture replica labeling method and demonstrated that GluR2 subunits were present at 99% of glutamatergic synapses in superficial laminae of adult rats. These results suggest that virtually all glutamatergic synapses in this region contain PSD-95 and AMPArs in the adult.
In the present study, we set a threshold for pan-AMPAr staining to allow reliable quantification of synaptic expression at different ages. Although this resulted in a somewhat lower proportion of PSD-95 puncta (93–94%) being defined as pan-AMPAr positive, the proportion did not differ between neonatal and adult animals, suggesting that, even in neonatal rats, the great majority of PSD-95-containing synapses in laminae I–II possess AMPArs. It has been reported that there is a developmental change in expression of MAGUK proteins in rat hippocampus, with SAP-102 being the predominant form and low expression of PSD-95 until postnatal day 10 (Sans et al., 2000). However, there is evidence that PSD-95 is important for synaptic clustering of NMDArs during synaptogenesis in cultures from embryonic or neonatal hippocampus (Rao et al., 1998; Friedman et al., 2000). Together with our finding that there is already a high level of PSD-95 in 7-d-old rats, this makes it unlikely that many glutamatergic synapses in superficial dorsal horn of neonatal animals lack PSD-95.
Absence of pure NMDAr-mediated EPSCs
Several studies reported pure NMDAr-mediated EPSCs in superficial dorsal horn neurons in response to dorsal horn or dorsal root stimulation (Bardoni et al., 1998; Li and Zhuo, 1998; Baba et al., 2000; Jung et al., 2005), and these findings have been interpreted as representing activation of synapses that possess NMDArs but lack AMPArs. Although at first sight the EPSCs evoked by previously subthreshold focal stimulation that we observed in some cells when the holding potential was raised to +50 mV resembled those reported previously, there are important differences. First, we observed these in relatively few cases and with equal frequency in slices from neonatal and adult animals. Second, we found that, in all cases in which the holding potential was subsequently returned to −70 mV, EPSCs were still detected, suggesting that this phenomenon did not result from activation of AMPAr-lacking synapses. Because some of the EPSCs seen at +50 mV might have resulted from activation of more than one presynaptic axon, we cannot rule out the possibility that one of these formed a genuinely silent synapse that was not detected because of the reappearance of EPSCs at the other synapse(s) when the holding potential was returned to −70 mV. However, if this is the case, then such synapses are presumably very rare. It is very unlikely that the reappearance of EPSCs at −70 mV was attributable to rapid insertion of AMPArs, because in many cases, recordings had been made from the cells for at least 30 min, whereas hippocampal long-term potentiation (which is thought to result from AMPAr insertion) is not seen in neurons that have been held in the whole-cell configuration for this long (Malinow and Tsien, 1990). In addition, activity-dependent insertion of AMPArs is Ca2+ mediated, and this phenomenon occurred with BAPTA in the pipette.
One possible explanation for our observations is that there was a progressive alteration in the effectiveness of the focal stimulation. However, we found that, in cases in which EPSCs appeared when the holding potential was raised, this often occurred very rapidly (Figs. 4A, 5A), suggesting that a change in effectiveness may have resulted from depolarization. Voronin et al. (2004) used a minimal stimulation protocol in hippocampal slices and also observed EPSCs that appeared when the holding potential was changed to a positive value and then remained when it was returned to the original negative level. However, this was not seen when the patch pipette contained 20 mm BAPTA, and the authors concluded that it was Ca2+ dependent.
Our finding that neither the appearance of EPSCs at +50 mV nor their persistence when the holding potential was returned to −70 mV was prevented by 40 mm BAPTA in the pipette suggests that neither phenomenon was Ca2+ mediated. A potential Ca2+-independent mechanism that could explain changes in excitability of presynaptic neurons involves leakage of Cs+ out of the recorded cell when the holding potential was raised (Liao et al., 1995; Voronin et al., 2004). This leakage could occur through NMDA receptors, as well as through Cs+-permeable K+ channels activated by depolarization, which have been identified in neurons (Rüsch and Eatock, 1996; Sanchez et al., 1998; Wigmore and Lacey, 2000). Leakage of Cs+ would have the effect of blocking K+ channels in nearby neuronal membranes, therefore increasing the excitability of the presynaptic glutamatergic axons that mediate the EPSCs seen after focal stimulation.
Silent synapses in the superficial dorsal horn
Our findings cannot account for the pure NMDAr-mediated EPSCs seen in all previous studies in dorsal horn, because Li and Zhuo (1998) and Bardoni et al. (1998) (R. Bardoni, personal communication) found that, in those cases in which EPSCs appeared when a positive holding potential was applied, they were not observed when the holding potential was returned to −70 mV. However, although both studies report pure NMDAr-mediated EPSCs in neonatal animals, there was a considerable difference in their prevalence: Li and Zhuo found them in >60% of cells from animals <10 d old, whereas Bardoni et al. observed them in ∼20% of synapses tested. Although some of this discrepancy may result from differences in stimulation site (dorsal roots or focal stimulation), together with the present findings, it suggests that the phenomenon shows considerable dependence on experimental protocol.
Assuming that our interpretation of the anatomical data is correct and that there are few if any AMPAr-lacking glutamatergic synapses in superficial dorsal horn at ages older than 7 d, it is necessary to account for the observation of pure NMDAr-mediated EPSCs in previous studies. One explanation is that it results from the presence of low levels of glutamate that are able to activate NMDA but not AMPA receptors (because the NMDArs have a much higher glutamate affinity), and it has been suggested that this can result from glutamate spillover from nearby synapses (Kullmann et al., 1996). Glutamate uptake mechanisms may be compromised in slices, for example attributable to trauma involved in sectioning (Asztely et al., 1997), and variation in slice preparation methods could therefore lead to differences in the amount of glutamate spillover.
A recent proposal to explain discrepancies between the finding of pure NMDAr-mediated EPSCs and anatomical studies that failed to detect significant numbers of AMPAr-lacking glutamatergic synapses is that AMPArs may be present in newly formed synapses but in a labile state (Xiao et al., 2004; Groc et al., 2006). It has been suggested that these labile AMPArs may be driven out of the synapses by a mechanism similar to long-term depression. Xiao et al. (2004) were able to evoke this “silencing” by stimulating at low frequency and demonstrated that it was Ca2+ dependent but not NMDAr mediated. One difference between the present study and those of Li and Zhuo (1998) and Bardoni et al. (1998) is that we recorded from cells that were at least 100 μm below the cut surface of the slice, whereas in these other studies recordings were apparently from more superficially located neurons. Because most superficial dorsal horn neurons have rostrocaudally elongated dendrites, many neurons close to the surface will have undergone transection of proximal dendrites in the transverse slices that were used in these studies. It is possible that significant Ca2+ entry through these dendrites led to synaptic “silencing” attributable to removal of labile synaptic AMPArs.
Footnotes
This work was supported by the Wellcome Trust. We thank R. Kerr, C. Watt, and M. McGill for expert technical assistance and Drs. R. Bardoni, I. Vida, M. Beato, and Z. Puskár for helpful discussion and advice.
References
- Antal M, Fukazawa Y, Eördögh M, Muszil D, Molnár E, Itakura M, Takahashi M, Shigemoto R. Numbers, densities, and colocalization of AMPA- and NMDA-type glutamate receptors at individual synapses in the superficial dorsal horn of rats. J Neurosci. 2008;28:9692–9701. doi: 10.1523/JNEUROSCI.1551-08.2008. [DOI] [PMC free article] [PubMed] [Google Scholar]
- Asztely F, Erdemli G, Kullmann DM. Extrasynaptic glutamate spillover in the hippocampus: dependence on temperature and the role of active glutamate uptake. Neuron. 1997;18:281–293. doi: 10.1016/s0896-6273(00)80268-8. [DOI] [PubMed] [Google Scholar]
- Baba H, Doubell TP, Moore KA, Woolf CJ. Silent NMDA receptor-mediated synapses are developmentally regulated in the dorsal horn of the rat spinal cord. J Neurophysiol. 2000;83:955–962. doi: 10.1152/jn.2000.83.2.955. [DOI] [PubMed] [Google Scholar]
- Bardoni R, Magherini PC, MacDermott AB. NMDA EPSCs at glutamatergic synapses in the spinal cord dorsal horn of the postnatal rat. J Neurosci. 1998;18:6558–6567. doi: 10.1523/JNEUROSCI.18-16-06558.1998. [DOI] [PMC free article] [PubMed] [Google Scholar]
- Broman J. Neurotransmitters in subcortical somatosensory pathways. Anat Embryol (Berl) 1994;189:181–214. doi: 10.1007/BF00239008. [DOI] [PubMed] [Google Scholar]
- Dickenson AH, Chapman V, Green GM. The pharmacology of excitatory and inhibitory amino acid-mediated events in the transmission and modulation of pain in the spinal cord. Gen Pharmacol. 1997;28:633–638. doi: 10.1016/s0306-3623(96)00359-x. [DOI] [PubMed] [Google Scholar]
- Durand GM, Kovalchuk Y, Konnerth A. Long-term potentiation and functional synapse induction in developing hippocampus. Nature. 1996;381:71–75. doi: 10.1038/381071a0. [DOI] [PubMed] [Google Scholar]
- Feldmeyer D, Sakmann B. Synaptic efficacy and reliability of excitatory connections between the principal neurones of the input (layer 4) and output layer (layer 5) of the neocortex. J Physiol. 2000;525:31–39. doi: 10.1111/j.1469-7793.2000.00031.x. [DOI] [PMC free article] [PubMed] [Google Scholar]
- Friedman HV, Bresler T, Garner CC, Ziv NE. Assembly of new individual excitatory synapses: time course and temporal order of synaptic molecule recruitment. Neuron. 2000;27:57–69. doi: 10.1016/s0896-6273(00)00009-x. [DOI] [PubMed] [Google Scholar]
- Fritschy JM, Weinmann O, Wenzel A, Benke D. Synapse-specific localization of NMDA and GABA(A) receptor subunits revealed by antigen-retrieval immunohistochemistry. J Comp Neurol. 1998;390:194–210. [PubMed] [Google Scholar]
- Fukaya M, Watanabe M. Improved immunohistochemical detection of postsynaptically located PSD-95/SAP90 protein family by protease section pretreatment: a study in the adult mouse brain. J Comp Neurol. 2000;426:572–586. [PubMed] [Google Scholar]
- Fukaya M, Tsujita M, Yamazaki M, Kushiya E, Abe M, Akashi K, Natsume R, Kano M, Kamiya H, Watanabe M, Sakimura K. Abundant distribution of TARP gamma-8 in synaptic and extrasynaptic surface of hippocampal neurons and its major role in AMPA receptor expression on spines and dendrites. Eur J Neurosci. 2006;24:2177–2190. doi: 10.1111/j.1460-9568.2006.05081.x. [DOI] [PubMed] [Google Scholar]
- Garry EM, Fleetwood-Walker SM. A new view on how AMPA receptors and their interacting proteins mediate neuropathic pain. Pain. 2004;109:210–213. doi: 10.1016/j.pain.2004.04.002. [DOI] [PubMed] [Google Scholar]
- Greicius MD, Krasnow B, Reiss AL, Menon V. Functional connectivity in the resting brain: a network analysis of the default mode hypothesis. Proc Natl Acad Sci U S A. 2003;100:253–258. doi: 10.1073/pnas.0135058100. [DOI] [PMC free article] [PubMed] [Google Scholar]
- Groc L, Gustafsson B, Hanse E. AMPA signalling in nascent glutamatergic synapses: there and not there! Trends Neurosci. 2006;29:132–139. doi: 10.1016/j.tins.2006.01.005. [DOI] [PubMed] [Google Scholar]
- Hefft S, Jonas P. Asynchronous GABA release generates long-lasting inhibition at a hippocampal interneuron-principal neuron synapse. Nat Neurosci. 2005;8:1319–1328. doi: 10.1038/nn1542. [DOI] [PubMed] [Google Scholar]
- Hunt CA, Schenker LJ, Kennedy MB. PSD-95 is associated with the postsynaptic density and not with the presynaptic membrane at forebrain synapses. J Neurosci. 1996;16:1380–1388. doi: 10.1523/JNEUROSCI.16-04-01380.1996. [DOI] [PMC free article] [PubMed] [Google Scholar]
- Isaac JT, Nicoll RA, Malenka RC. Evidence for silent synapses: implications for the expression of LTP. Neuron. 1995;15:427–434. doi: 10.1016/0896-6273(95)90046-2. [DOI] [PubMed] [Google Scholar]
- Jung SJ, Kim YS, Kim DK, Kim J, Kim SJ. Long-term potentiation of silent synapses in substantia gelatinosa neurons. Neuroreport. 2005;16:961–965. doi: 10.1097/00001756-200506210-00016. [DOI] [PubMed] [Google Scholar]
- Kullmann DM. Amplitude fluctuations of dual-component EPSCs in hippocampal pyramidal cells: implications for long-term potentiation. Neuron. 1994;12:1111–1120. doi: 10.1016/0896-6273(94)90318-2. [DOI] [PubMed] [Google Scholar]
- Kullmann DM, Erdemli G, Asztély F. LTP of AMPA and NMDA receptor-mediated signals: evidence for presynaptic expression and extrasynaptic glutamate spill-over. Neuron. 1996;17:461–474. doi: 10.1016/s0896-6273(00)80178-6. [DOI] [PubMed] [Google Scholar]
- Li P, Zhuo M. Silent glutamatergic synapses and nociception in mammalian spinal cord. Nature. 1998;393:695–698. doi: 10.1038/31496. [DOI] [PubMed] [Google Scholar]
- Liao D, Hessler NA, Malinow R. Activation of postsynaptically silent synapses during pairing-induced LTP in CA1 region of hippocampal slice. Nature. 1995;375:400–404. doi: 10.1038/375400a0. [DOI] [PubMed] [Google Scholar]
- Malinow R, Tsien RW. Presynaptic enhancement shown by whole-cell recordings of long-term potentiation in hippocampal slices. Nature. 1990;346:177–180. doi: 10.1038/346177a0. [DOI] [PubMed] [Google Scholar]
- Migaud M, Charlesworth P, Dempster M, Webster LC, Watabe AM, Makhinson M, He Y, Ramsay MF, Morris RG, Morrison JH, O'Dell TJ, Grant SG. Enhanced long-term potentiation and impaired learning in mice with mutant postsynaptic density-95 protein. Nature. 1998;396:433–439. doi: 10.1038/24790. [DOI] [PubMed] [Google Scholar]
- Montgomery JM, Pavlidis P, Madison DV. Pair recordings reveal all-silent synaptic connections and the postsynaptic expression of long-term potentiation. Neuron. 2001;29:691–701. doi: 10.1016/s0896-6273(01)00244-6. [DOI] [PubMed] [Google Scholar]
- Nagy GG, Al-Ayyan M, Andrew D, Fukaya M, Watanabe M, Todd AJ. Widespread expression of the AMPA receptor GluR2 subunit at glutamatergic synapses in the rat spinal cord and phosphorylation of GluR1 in response to noxious stimulation revealed with an antigen-unmasking method. J Neurosci. 2004;24:5766–5777. doi: 10.1523/JNEUROSCI.1237-04.2004. [DOI] [PMC free article] [PubMed] [Google Scholar]
- Polgár E, Watanabe M, Hartmann B, Grant SG, Todd AJ. Expression of AMPA receptor subunits at synapses in laminae I-III of the rodent spinal dorsal horn. Mol Pain. 2008;4:5. doi: 10.1186/1744-8069-4-5. [DOI] [PMC free article] [PubMed] [Google Scholar]
- Rao A, Kim E, Sheng M, Craig AM. Heterogeneity in the molecular composition of excitatory postsynaptic sites during development of hippocampal neurons in culture. J Neurosci. 1998;18:1217–1229. doi: 10.1523/JNEUROSCI.18-04-01217.1998. [DOI] [PMC free article] [PubMed] [Google Scholar]
- Rüsch A, Eatock RA. A delayed rectifier conductance in type I hair cells of the mouse utricle. J Neurophysiol. 1996;76:995–1004. doi: 10.1152/jn.1996.76.2.995. [DOI] [PubMed] [Google Scholar]
- Sanchez RM, Surkis A, Leonard CS. Voltage-clamp analysis and computer simulation of a novel cesium-resistant A-current in guinea pig laterodorsal tegmental neurons. J Neurophysiol. 1998;79:3111–3126. doi: 10.1152/jn.1998.79.6.3111. [DOI] [PubMed] [Google Scholar]
- Sans N, Petralia RS, Wang YX, Blahos J, 2nd, Hell JW, Wenthold RJ. A developmental change in NMDA receptor-associated proteins at hippocampal synapses. J Neurosci. 2000;20:1260–1271. doi: 10.1523/JNEUROSCI.20-03-01260.2000. [DOI] [PMC free article] [PubMed] [Google Scholar]
- Todd AJ, Koerber HR. Neuroanatomical substrates of spinal nociception. In: McMahon S, Koltzenburg M, editors. Wall and Melzack's textbook of pain. Ed 5. Edinburgh: Churchill Livingstone; 2005. pp. 73–90. [Google Scholar]
- Todd AJ, Hughes DI, Polgár E, Nagy GG, Mackie M, Ottersen OP, Maxwell DJ. The expression of vesicular glutamate transporters VGLUT1 and VGLUT2 in neurochemically defined axonal populations in the rat spinal cord with emphasis on the dorsal horn. Eur J Neurosci. 2003;17:13–27. doi: 10.1046/j.1460-9568.2003.02406.x. [DOI] [PubMed] [Google Scholar]
- Valtschanoff JG, Burette A, Wenthold RJ, Weinberg RJ. Expression of NR2 receptor subunit in rat somatic sensory cortex: synaptic distribution and colocalization with NR1 and PSD-95. J Comp Neurol. 1999;410:599–611. [PubMed] [Google Scholar]
- Voronin LL, Altinbaev RS, Bayazitov IT, Gasparini S, Kasyanov AV, Saviane C, Savtchenko L, Cherubini E. Postsynaptic depolarisation enhances transmitter release and causes the appearance of responses at “silent” synapses in rat hippocampus. Neuroscience. 2004;126:45–59. doi: 10.1016/j.neuroscience.2004.03.026. [DOI] [PubMed] [Google Scholar]
- Watanabe M, Fukaya M, Sakimura K, Manabe T, Mishina M, Inoue Y. Selective scarcity of NMDA receptor channel subunits in the stratum lucidum (mossy fibre-recipient layer) of the mouse hippocampal CA3 subfield. Eur J Neurosci. 1998;10:478–487. doi: 10.1046/j.1460-9568.1998.00063.x. [DOI] [PubMed] [Google Scholar]
- Wigmore MA, Lacey MG. A Kv3-like persistent, outwardly rectifying, Cs+-permeable, K+ current in rat subthalamic nucleus neurones. J Physiol. 2000;527:493–506. doi: 10.1111/j.1469-7793.2000.t01-1-00493.x. [DOI] [PMC free article] [PubMed] [Google Scholar]
- Xiao MY, Wasling P, Hanse E, Gustafsson B. Creation of AMPA-silent synapses in the neonatal hippocampus. Nat Neurosci. 2004;7:236–243. doi: 10.1038/nn1196. [DOI] [PubMed] [Google Scholar]
- Yasaka T, Kato G, Furue H, Rashid MH, Sonohata M, Tamae A, Murata Y, Masuko S, Yoshimura M. Cell-type-specific excitatory and inhibitory circuits involving primary afferents in the substantia gelatinosa of the rat spinal dorsal horn in vitro. J Physiol. 2007;581:603–618. doi: 10.1113/jphysiol.2006.123919. [DOI] [PMC free article] [PubMed] [Google Scholar]
- Yoshimura M, Jessell T. Amino acid-mediated EPSPs at primary afferent synapses with substantia gelatinosa neurones in the rat spinal cord. J Physiol. 1990;430:315–335. doi: 10.1113/jphysiol.1990.sp018293. [DOI] [PMC free article] [PubMed] [Google Scholar]
- Yoshimura M, Jessell TM. Primary afferent-evoked synaptic responses and slow potential generation in rat substantia gelatinosa neurons in vitro. J Neurophysiol. 1989;62:96–108. doi: 10.1152/jn.1989.62.1.96. [DOI] [PubMed] [Google Scholar]
- Yoshimura M, Nishi S. Excitatory amino acid receptors involved in primary afferent-evoked polysynaptic EPSPs of substantia gelatinosa neurons in the adult rat spinal cord slice. Neurosci Lett. 1992;143:131–134. doi: 10.1016/0304-3940(92)90249-7. [DOI] [PubMed] [Google Scholar]