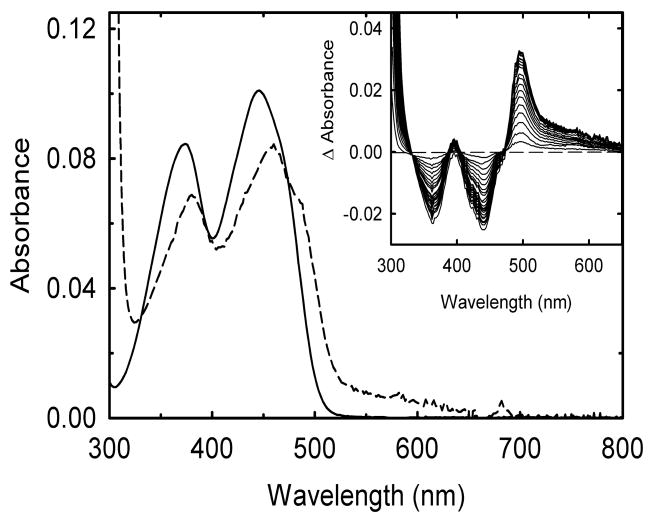
Figure 6.
Changes in the absorbance spectrum of FMN when bound to the apoprotein form of the -537Gly-Ala- variant. An FMN solution (~5 μM) in 50 mM sodium phosphate buffer pH 7.0 at 25 °C was titrated with sub-stoichiometric amounts of freshly prepared apoprotein. The main panel shows the absorbance of FMN before (solid line) and after (dashed line) the addition of saturating amounts of the apoprotein. Inset: Difference spectra obtained during the titration. All spectra are corrected for dilution and, if necessary, for some light scattering.

