

Abstract
Diffusion MRI is a non-invasive imaging technique that allows the measurement of water molecular diffusion through tissue in vivo. In this paper, we present a novel statistical model which describes the diffusion-attenuated MR signal by the Laplace transform of a probability distribution over symmetric positive definite matrices. Using this new model, we analytically derive a Rigaut-type asymptotic fractal law for the MR signal decay which has been phenomenologically used before. We also develop an efficient scheme for reconstructing the multiple fiber bundles from the DW-MRI measurements. Experimental results on both synthetic and real data sets are presented to show the robustness and accuracy of the proposed algorithms.
Index Terms: Biomedical imaging, Magnetic resonance imaging, Biomedical image processing, Diffusion processes
1. INTRODUCTION
Diffusion-weighted imaging (DWI) is a magnetic resonance (MR) imaging technique exploiting the sensitivity of the MR signal to the Brownian motion of water molecules. It adds to the conventional relaxation-weighted magnetic resonance imaging (MRI) the capability of measuring the water diffusion characteristics in local tissue. The directional dependence of water diffusion in fibrous tissues, like muscle and white-matter in the brain, provides an indirect but powerful means to probe the microstructure of these tissues. As of today, DWI is the unique noninvasive technique capable of quantifying the anisotropic diffusion of water molecules in tissues allowing one to draw inferences about neuronal connections between different regions of the central nervous system (CNS).
In diffusion MRI, most applications rely on the fundamental relationship between the MR signal measurement S(q) and the average particle displacement probability density function (PDF) P(r) which is given by the following Fourier transform [1]: S(q) = S0∫R3P(r) eiq·rdr where S0 is the signal in the absence of diffusion gradient, r is the displacement vector and q = γδGg, where γ is the gyromagnetic ratio, δ is the diffusion gradient duration, G and g are the magnitude and direction of the diffusion sensitizing gradients respectively.
Diffusion tensor MRI (DT-MRI or DTI), introduced by [2], provides a relatively simple way of quantifying diffusional anisotropy as well as predicting the local fiber direction within the tissue from multidirectional diffusion MRI data. DTI assumes a displacement probability characterized by an oriented Gaussian probability distribution function, which leads to a signal decay given by S(q) = S0 exp (−bgT Dg) where b = |q|2t is the diffusion weighting factor depending on the strength |q| as well as the effective diffusion time and D is called the apparent diffusion tensor. DTI model has been shown to be quite successful in regions of the brain and spinal cord with significant white-matter coherence and has enabled the mapping of anatomical connections in the central nervous system. However, the major drawback of diffusion tensor MRI is that it can only reveal a single fiber orientation in each voxel and fails in voxels with orientational heterogeneity (IVOH) [3]. This limitation of DT-MRI has prompted interest in the development of both improved imaging measurement strategies and more sophisticated reconstruction methods. Recently, [4] proposed the so called q-ball imaging (QBI) method, in which radial integral of the displacement PDF is approximated by the spherical Funk-Radon transform. [5, 6] further reformulates QBI’s Funk-Radon transform in a spherical harmonic basis. More recently, [7] introduced the diffusion orientation transform (DOT) which transforms the diffusivity function into probability function by expressing the Fourier relation in spherical coordinates and evaluating the radial part of the integral analytically. Multi-compartmental models [3] have also been used to model the diffusion-attenuated MR signal. Two problems accompany the use of these models. First, the number of such compartments has to be pre-specified, presenting a model-selection problem. Second, the nonlinear fitting procedure is unstable and heavily depends on the choice of the starting point because of the local minima in the objective function.
In this paper, we present a novel statistical model which assumes that at each voxel there is an underlying probability measure associated with  (the manifold of n × n positive definite matrices). We make the interesting observation that the resulting continuous mixture model and MR signal attenuation are related via a Laplace transform defined on . We also show that the Laplace transform can be evaluated in closed form for the case when the mixing distribution is a matrix-variate gamma distribution. The resulting closed form is a Rigaut-type function which has been phenomenologically used before to explain the MR signal decay but never with a rigorous mathematical justification until now.
2. THEORY
We assume that at each voxel there is an underlying probability measure associated with the manifold of n × n symmetric positive-definite matrices, . Let f(D) be its density function with respect to some carrier measure dD on . Then we can model the diffusion signal by:
| (1) |
Note that above equation implies a more general form of mixture model with f(D) being a mixing density over the covariance matrices of Gaussian distributions. Clearly, our model simplifies to the diffusion tensor model when the underlying probability measure is the Dirac measure.
Since bgT Dg in Eq.(1) can be replaced by trace(BD) where B = bggT, the diffusion signal model presented in the form of (1) can be exactly expressed as the Laplace transform (matrix variable case) [8]:
| (2) |
where ℒf denotes the Laplace transform of a function f which takes argument in .
Definition 1
[8] For σ ∈ and for p in
, the matrix-variate gamma distribution γp,σ with scale parameter σ and shape parameter p is defined as 1
where Γn is the multivariate gamma function and |·| denotes the determinant of a matrix.
It can be shown [8] that the Laplace transform of γp,σ is
Let f in (2) be the density of matrix-variate gamma distribution γp,σ with a fixed expected value D̂ = pσ. We have
| (3) |
This is a familiar Rigaut-type asymptotic fractal expression [9] which implies a signal decay characterized by a power-law in the large-|q|, hence large-b asymptotic. This is the expected asymptotic behavior for the MR signal attenuation in porous media [10]. Note that although this form of a signal attenuation curve had been phenomenologically fitted to the diffusion-weighted MR data before [11], until now, there was no rigorous derivation of the Rigaut-type expression used to explain the MR signal behavior as a function of b-value. Therefore, this derivation may be useful in understanding the apparent fractal-like behavior of the neural tissue in diffusion-weighted MR experiments. Also note when p tends to infinity, we have S(q) → S0 exp(−bgTD̂g), which implies that the mono-exponential model can be viewed as a limiting case (p → ∞) of our model.
3. METHOD
The Laplace transform relation between MR signal and the probability distributions on naturally leads to an inverse problem: to recover a distribution on that best explains the observed diffusion signal. This is an ill-posed problem and in general is not solvable without further assumptions. We first propose a discrete mixture of matrix-variate gamma distribution model where the mixing distribution in Eq.(2) is expressed as
. In this model (pi, σi) are treated as basis and will be fixed as described below. It leaves the weights w as the unknowns to be estimated. Note here the number of components in mixture, N, only depends on the resolution of the manifold discretization and should not be interpreted as the expected number of fiber bundles. Then we assume that all the pi take the same value p = 2 based on the analogy between the Eq.(3) and Debye-Porod law of diffraction [10] in three-dimensional space. Since the fibers have an approximately cylindrical geometry, it is reasonable to assume that the two smaller eigenvalues of diffusion tensors are equal. In practice, we fix the eigenvalues of σi to specified values
consistent with the values commonly observed in white-matter tracts [3]. This rotational symmetry leads to a tessellation where N unit vectors evenly distributed on the unit sphere are chosen as the principal directions of σi. In this way, the distribution can be estimated using a spherical deconvolution scheme [12]. For K measurements with qj, the signal model equation:
yields a linear system Aw = s, where s = (S(q)/S0) is the vector of normalized measurements, w = (wi), is the vector of weights to be estimated and A is the matrix with Aji = (1 + trace(Bj σi))−p. Since the matrix A only depends on the sampling scheme and therefore needs only onetime computation, the computational burden of this method is light and comparable to that of diffusion-tensor MRI. However, the induced inverse problem can be ill-conditioned due to the possible singular configurations of the linear system. In practice, the damped least squares method as a regularization scheme is employed to overcome the instability problem.
After the continuous distribution of tensors model is obtained, the displacement PDF can be approximated by the Fourier transform P (r) = ∫E(q) exp(−iq·r)dq where E(q) = S(q)/S0 is the MR signal attenuation. Assuming a continuous diffusion tensor model as in Eq.(1) with mixing distribution , we have
| (4) |
where D̂i = pσi are the expected values of γp,σi. Once the P(r) as a real-valued spherical function is computed, the number of fibers, together with an orientation estimate at each voxel, can be resolved by finding the peaks of P(r) as in [7].
4. RESULTS
4.1. Simulations
We empirically investigated the performance of our reconstruction method. Of special interest is its accuracy towards fiber orientation detection in the presence of noise. To study this issue, we first took the HARDI simulations of 1-,2- and 3-fiber profiles with known fiber orientations and computed the probability profiles as shown in Fig. 1.2
Fig. 1.
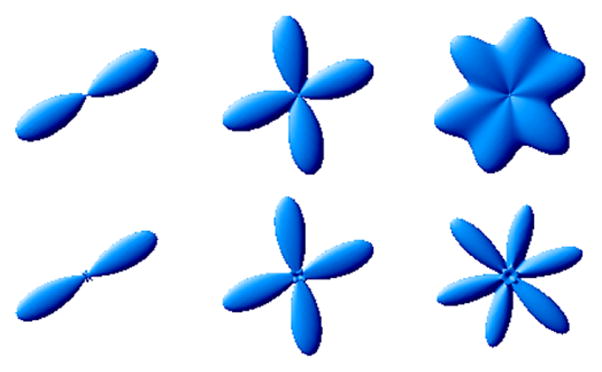
Simulations of 1-, 2- and 3-fibers (b = 1500s/mm2). Orientations: azimuthal angles φ1 = 30, φ2 = {20, 100}, φ3 = {20, 75, 135}; polar angles were all 90°. Top: Q-ball ODF surfaces; Bottom: Probability surfaces computed using proposed method.
In the case of noiseless signal, the proposed method as well as QBI are both able to recover the fiber orientation quite accurately. The Q-ball orientation distribution functions (ODF) is computed by using the formula given by [5] in terms of spherical harmonics expansion. Since our method computes the probability values directly, we fit the resulting probability profiles from proposed method using spherical harmonics basis for better surface rendering. The existence of analytical angular derivatives of spherical harmonic functions also enables us to apply fast gradient-based numerical optimization routines to find the peaks of the probability surfaces.
To provide a more quantitative assessment of the proposed method and its sensitivity to noise, we add Rician-distributed noise by adding Gaussian noise on both real and imaginary parts of all 1-, 2- and 3-fiber systems shown in Fig. 1, with increasing noise levels (σ = .02, .04, .06). The simulations of the signal profiles with noise were repeated 100 times for each noise level to provide a distribution of deviation angles. Table 1 reports the mean and standard deviation of these distributions in degrees.
Table 1.
Statistics of the deviation angles ψ between the computed and true fiber orientations in presence of noise.
| From proposed method | |||
|---|---|---|---|
| ψ(σ = .02) | ψ(σ = .04) | ψ(σ = .06) | |
| 1 fiber | 0.65 ± 0.39 | 1.19 ± 0.65 | 1.66 ± 0.87 |
| 2 fibers | 1.18 ± 0.66 | 2.55 ± 1.29 | 3.85 ± 2.12 |
| 1.30 ± 0.66 | 2.76 ± 1.34 | 3.63 ± 1.91 | |
| 3 fibers | 4.87 ± 3.23 | 8.59 ± 5.82 | 11.79 ± 6.86 |
| 5.81 ± 3.61 | 7.70 ± 5.02 | 11.27 ± 6.36 | |
| 4.92 ± 3.32 | 7.94 ± 4.59 | 12.57 ± 7.09 | |
| From QBI | |||
|---|---|---|---|
| ψ(σ = .02) | ψ(σ = .04) | ψ(σ = .06) | |
| 1 fiber | 1.28 ± 0.75 | 3.34 ± 1.97 | 5.94 ± 3.19 |
| 2 fibers | 2.39 ± 1.26 | 4.82 ± 2.44 | 7.95 ± 4.45 |
| 2.30 ± 1.10 | 4.94 ± 2.15 | 7.49 ± 3.88 | |
| 3 fibers | 10.80 ± 5.59 | 12.15 ± 4.42 | 20.21 ± 11.10 |
| 11.59 ± 5.44 | 13.07 ± 4.74 | 19.54 ± 11.80 | |
| 11.66 ± 5.18 | 12.25 ± 4.93 | 20.36 ± 11.50 | |
As expected, the deviation angles between the recovered and the true fiber orientations increase with increasing noise levels and it is more challenging to accurately resolve the distinct orientations when there are more fiber orientations. The statistics reported in Table 1 also indicate that the proposed method has stronger resistance to noise than the QBI method.
4.2. Experiments
The rat optic chiasm is an excellent experimental validation of our approach due to its distinct myelinated structure with both parallel and descussating optic nerve fibers. A HARDI data from optic chiasm region of excised, perfusion-fixed rat nervous tissue was acquired at 14.1T using Bruker Avance imaging systems. A diffusion-weighted spin echo pulse sequence was used. Diffusion-weighted images were acquired along 46 directions with a b-value of 1250s/mm2 along with a single image acquired at b ≈ 0s/mm2.
Figure 2 shows the displacement probabilities computed from the optic chiasm image. For the sake of clarity, we excluded every other pixel and overlaid the probability surfaces on generalized anisotropy (GA) maps [14]. As evident from this figure, our method is able to demonstrate the distinct fiber orientations in the central region of the optic chiasm where ipilateral myelinated axons from the two optic nerves cross and form the contralateral optic tracts.
Fig. 2.
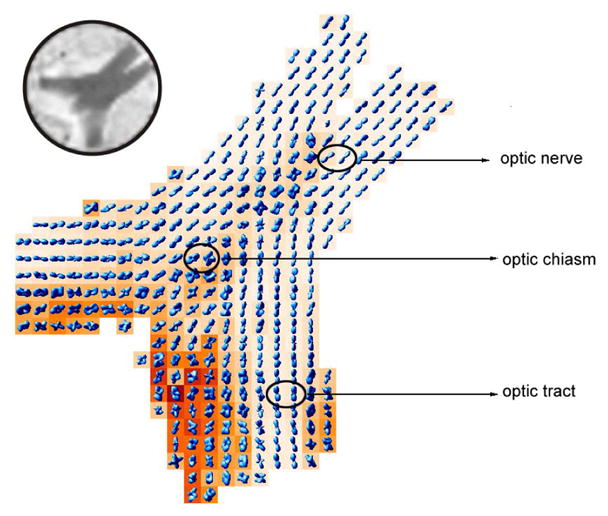
Probability maps computed from a rat optic chiasm data set overlaid on axially oriented GA maps. The decussations of myelinated axons from the two optic nerves at the center of the optic chiasm are readily apparent. Decussating fibers carry information from the temporal visual fields to the geniculate body. Upper left corner shows the corresponding reference (S0) image.
5. CONCLUSION
In this paper, we present a novel mathematical model which shows that the diffusion MR signals and probability distributions for positive definite matrix-valued random variables are related through Laplace transforms. We further show that in the case of matrix-variate gamma distributions, a closed form expression for the Laplace transform exists and can be used to derive a Rigaut-type asymptotic fractal law for the MR signal decay behavior which has been observed experimentally in the past [11]. Moreover in this case, the traditional diffusion tensor model is the limiting case of the expected signal attenuation. Then using this novel model, we develop new methods for reconstructing the multiple fiber bundles from the diffusion weighted MRI measurements. Experimental results on both synthetic and real data sets have shown the robustness and accuracy of the proposed algorithms.
Acknowledgments
This research was in part supported by NIH EB007082, NIH NS42075 to BCV and NIH EB004752 to PC & TM.
Footnotes
Note that the correspondence between this definition and the Wishart distribution Wn(p, Σ) is given simply by γp/2,2Σ = Wn(p, Σ).
The simulations employed the exact form of the MR signal attenuation from particles diffusing inside cylindrical boundaries [13].
References
- 1.Callaghan PT. Principles of Nuclear Magnetic Resonance Microscopy. Clarendon Press; Oxford: 1991. [Google Scholar]
- 2.Basser PJ, Mattiello J, LeBihan D. Estimation of the effective self-diffusion tensor from the NMR spin echo. J Magn Reson B. 1994;103:247–254. doi: 10.1006/jmrb.1994.1037. [DOI] [PubMed] [Google Scholar]
- 3.Tuch DS, Reese TG, Wiegell MR, Makris N, Belliveau JW, Wedeen Van J. High angular resolution diffusion imaging reveals intravoxel white matter fiber heterogeneity. Magn Reson Med. 2002;48(4):577–582. doi: 10.1002/mrm.10268. [DOI] [PubMed] [Google Scholar]
- 4.Tuch DS, Reese TG, Wiegell MR, Wedeen Van J. Diffusion MRI of complex neural architecture. Neuron. 2003 December;40:885–895. doi: 10.1016/s0896-6273(03)00758-x. [DOI] [PubMed] [Google Scholar]
- 5.Anderson AW. Measurement of fiber orientation distributions using high angular resolution diffusion imaging. Magn Reson Med. 2005;54(5):1194–1206. doi: 10.1002/mrm.20667. [DOI] [PubMed] [Google Scholar]
- 6.Descoteaux Maxime, Angelino Elaine, Fitzgibbons Shaun, Deriche Rachid. A fast and robust odf estimation algorithm in q-ball imaging. International Symposium on Biomedical Imaging: From Nano to Macro; 2006. pp. 81–84. [Google Scholar]
- 7.Özarslan E, Shepherd TM, Vemuri BC, Blackband SJ, Mareci TH. Resolution of complex tissue microarchitecture using the diffusion orientation transform (DOT) NeuroImage. 2006;31:1086–1103. doi: 10.1016/j.neuroimage.2006.01.024. [DOI] [PubMed] [Google Scholar]
- 8.Mathai AM. Jacobians and functions of matrix argument. World Scientific; 1997. [Google Scholar]
- 9.Rigaut JP. An empirical formulation relating boundary lengths to resolution in specimens showing ‘non-ideally fractal’ dimensions. J Microsc. 1984;133:41–54. [Google Scholar]
- 10.Sen PN, Hürlimann MD, de Swiet TM. Debye-Porod law of diffraction for diffusion in porous media. Phys Rev B. 1995;51(1):601–604. doi: 10.1103/physrevb.51.601. [DOI] [PubMed] [Google Scholar]
- 11.Köpf M, Corinth C, Haferkamp O, Nonnenmacher TF. Anomalous diffusion of water in biological tissues. Biophys J. 1996;70:2950–2958. doi: 10.1016/S0006-3495(96)79865-X. [DOI] [PMC free article] [PubMed] [Google Scholar]
- 12.Tournier JD, Calamante F, Gadian DG, Connelly A. Direct estimation of the fiber orientation density function from diffusion-weighted MRI data using spherical deconvolution. NeuroImage. 2004;23(3):1176–1185. doi: 10.1016/j.neuroimage.2004.07.037. [DOI] [PubMed] [Google Scholar]
- 13.Soderman O, Jönsson B. Restricted diffusion in cylindrical geometry. J Magn Reson B. 1995;(117):94–97. [Google Scholar]
- 14.Özarslan E, Vemuri BC, Mareci TH. Generalized scalar measures for diffusion MRI using trace, variance, and entropy. Magn Reson Med. 2005;53(4):866–876. doi: 10.1002/mrm.20411. [DOI] [PubMed] [Google Scholar]