

Abstract
Measuring the binding affinities of 42 single base pair mutants in the acceptor and T-stems of S. cerevisiae tRNAPhe to T. thermophilus EF-Tu revealed that most of the specificity for tRNA occurs at the 49-65, 50-64, and 51-63 base pairs. Introducing the same mutations at the three positions into E. coli tRNALeuCAG resulted in similar changes in the binding affinity. Swapping the three pairs from several E. coli tRNAs into yeast tRNAPhe resulted in chimeras with EF-Tu binding affinities similar to the donor tRNA. Finally, analysis of double and triple base pair mutants of tRNAPhe shows that the thermodynamic contributions at the three sites are additive, permitting reasonably accurate prediction of the EF-Tu binding affinity for all E. coli tRNAs. Thus, it appears that the thermodynamic contributions of three base pairs in the T-stem primarily account for tRNA binding specificity to EF-Tu.
Keywords: EF-Tu, tRNA Mutagenesis, tRNA Protein Interaction, T-Stem, Thermodynamic compensation
Introduction
The bacterial translation factor EF-Tu is a GTPase that ensures rapid binding and accurate decoding of aminoacyl-tRNAs (aa-tRNAs) on the ribosome.1,2 The GTP-bound form of the protein binds to its structurally diverse set of aa-tRNA substrates with nearly uniform affinity by combining quite variable thermodynamic contributions of the esterified amino acid and tRNA body.3,4 Experiments with misacylated tRNAs established that the different esterified amino acids contribute up to 2.5 kcal/mol,5 and the corresponding cognate tRNA bodies contribute up to 3.6 kcal/mol to the overall binding affinity.6 Therefore, the sequence of each tRNA has evolved to possess a binding affinity that compensates for its cognate amino acid such that a uniform affinity for each aa-tRNA is achieved.
How EF-Tu achieves sequence specificity is not completely understood. Crystal structures of T. aquaticus EF-Tu complexed with either yeast (S. cerevisiae) Phe-tRNAPhe or E. coli Cys-tRNACys indicate that the protein interacts with the acceptor (A) and TΨC (T) helices of both tRNAs, but with a slightly different pattern of hydrogen bonds for the two tRNA bodies.7; 8 This suggests that each tRNA may bind the protein in a thermodynamically distinct manner, although this possibility has not been tested. Alanine scanning mutagenesis has identified 14 amino acids in the interface between EF-Tu and tRNA that contribute towards the affinity to yeast Phe-tRNAPhe.9 Furthermore, at least three of the EF-Tu residues interact with other tRNAs in a sequence-dependent manner.10 Limited tRNA mutagenesis experiments have shown that the 51-63 and 49-65 base pairs in the T helix strongly contribute to the specific recognition of several tRNAs,11,12 but it is not known whether additional sites are used by other tRNAs. In addition, it remains unclear how the individual recognition elements combine to achieve the overall tRNA specificity.
In this paper, individual base pairs in the A and T-stems of yeast tRNAPhe and E. coli tRNALeuCAG are systematically mutated, and the effect on EF-Tu affinity is determined with the goal of obtaining a comprehensive view of the sequence-specific binding of EF-Tu to all bacterial tRNAs. The thermodynamic additivity of potential recognition contacts is assessed, and a recognition model is tested by introducing the proposed recognition elements from different tRNA backgrounds into yeast tRNAPhe.
Results
Because of the available high resolution X-ray co-crystal structure and extensive biochemical data, mutations were initially made in yeast tRNAPhe (Figure 1). With the exception of the universally conserved G53-C61 base pair that is essential for proper folding of the T loop,13 all twelve base pairs in the A and T helices were mutated even though the existing co-crystal structures only show contacts with nine of them. This was done because it is not known whether all tRNAs interact with EF-Tu in an identical manner. Other tRNA sequences could potentially form stabilizing hydrogen bonds or destabilizing steric clashes not seen in the two available structures. In addition, non-contacting residues could influence binding affinity indirectly by affecting the structure or the dynamics of the free tRNA.
Figure 1.
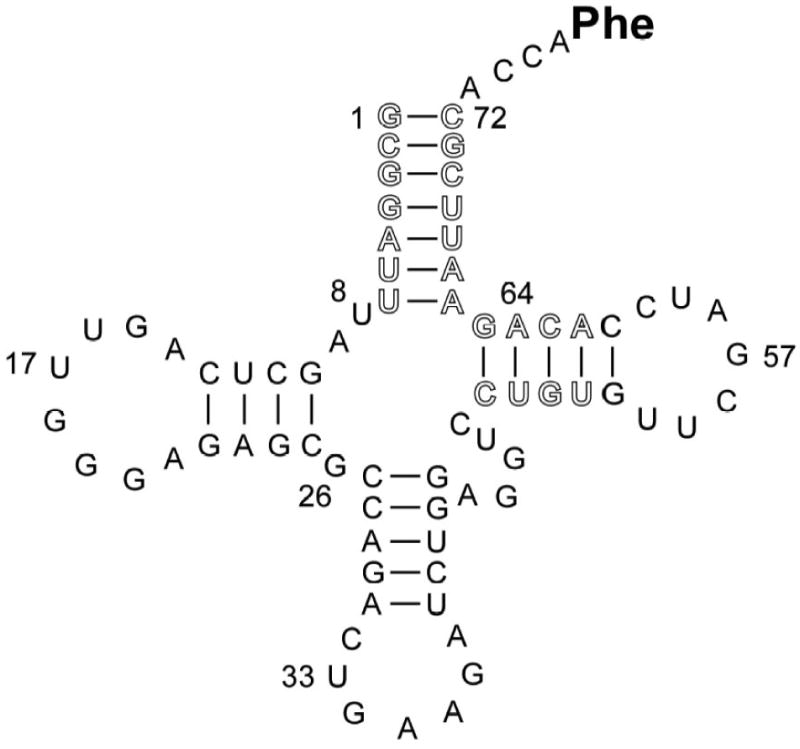
Sequence of S. cerevisiae tRNAPhe transcript used in this study with the sites of mutation outlined.
Analysis of more than 5000 non-redundant tRNA sequences representing about 200 fully sequenced bacterial genomes from tRNA datamart (http://trnamart.uoregon.edu/) revealed that while the A and T helices predominantly contain Watson-Crick base pairs, a significant fraction of GU, AC, and other non Watson-Crick base pairs is present (Table 1). In order to limit the total number of mutants, base pair changes at a given position were only selected if they were present in greater than 5% of all tRNAs or greater than 25% of tRNAs in any individual amino acid acceptor family. This selection ensured that all commonly used sequence elements were tested, including those used in only a few tRNA types. For example, the G3-U70 pair that is present only in 5% of all tRNAs was included because it is present in all tRNAAla species, and this could potentially affect the binding of this tRNA to EF-Tu. tRNA mutations at position 1-72 that initiated with either pyrimidine were not included to simplify synthesis but may be important for some tRNAs (see below).
Table I.
Rates of dissociation (koff) of mutants of Phe-tRNAPhe from T. thermophilus EF-Tu in buffer A at 0°C. Asterisk (*) refers to data extrapolated from NH4Cl dependence (see Figure 2). Frequency refers to the appearance of that base pair in greater than 5000 non-redundant bacterial tRNA gene sequences (http://trnamart.uoregon.edu/). N is the number of independent determinations. ΔG° is calculated from koff assuming kon = 0.11 μm-1s-1 (see text). All errors are standard errors.
| Mutation | Frequency | koff (s-1 × 10⁴) | ΔG° (kcal/mol) | N |
|---|---|---|---|---|
| WT | 9.6 ± 0.7 | -10.1 ± 0.07 | 5 | |
| A1-U72 | 0.03 | 14.9 ± 1.4 | -9.8 ± 0.09 | 3 |
| G2-C71 | 0.50 | 11.8 ± 1.2 | -10.0 ± 0.10 | 3 |
| U2-A71 | 0.03 | 11.3 ± 0.4 | -10.0 ± 0.04 | 3 |
| A2-U71 | 0.02 | 12.5 ± 0.2 | -9.9 ± 0.02 | 3 |
| C3-G70 | 0.30 | 11.6 ± 0.3 | -10.0 ± 0.03 | 3 |
| A3-U70 | 0.14 | 9.3 ± 0.3 | -10.1 ± 0.03 | 3 |
| U3-A70 | 0.08 | 12.3 ± 0.2 | -9.9 ± 0.02 | 3 |
| G3-U70 | 0.05 | 12.2 ± 0.2 | -9.9 ± 0.02 | 3 |
| U4-A69 | 0.08 | 9.7 ± 0.3 | -10.1 ± 0.03 | 3 |
| G4-C69 | 0.49 | 14.6 ± 0.5 | -9.8 ± 0.03 | 3 |
| A4-U69 | 0.06 | 11.1 ± 1.0 | -10.0 ± 0.09 | 3 |
| U4-G69 | 0.03 | 7.2 ± 0.9 | -10.2 ± 0.12 | 3 |
| G5-C68 | 0.33 | 8.5 ± 0.5 | -10.1 ± 0.06 | 3 |
| C5-G68 | 0.30 | 7.1 ± 0.5 | -10.2 ± 0.06 | 3 |
| G5-68U | 0.03 | 6.6 ± 1.2 | -10.3 ± 0.17 | 3 |
| U5-G68 | 0.03 | 4.9 ± 0.7 | -10.4 ± 0.15 | 3 |
| U5-A68 | 0.06 | 7.6 ± 1.1 | -10.2 ± 0.14 | 3 |
| A6-U67 | 0.16 | 8.7 ± 0.7 | -10.1 ± 0.08 | 3 |
| G6-C67 | 0.24 | 14.4 ± 0.9 | -9.9 ± 0.06 | 3 |
| C6-G67 | 0.28 | 14.6 ± 0.8 | -9.8 ± 0.05 | 3 |
| U6-G67 | 0.004 | 14.4 ± 1.5 | -9.9 ± 0.11 | 3 |
| A7-U66 | 0.23 | 5.4 ± 0.2 | -10.4 ± 0.04 | 3 |
| G7-C66 | 0.48 | 7.4 ± 0.5 | -10.2 ± 0.07 | 3 |
| G49-C65 | 0.46 | 4.0 ± 0.5 | -10.5 ± 0.11 | 3 |
| G49-U65 | 0.24 | 2.3 ± 0.3 | -10.9 ± 0.13 | 3 |
| A49-U65 | 0.20 | 3.8 ± 0.5 | -10.6 ± 0.13 | 3 |
| U49-A65 | 0.01 | 8.3 ± 0.7 | -10.2 ± 0.08 | 3 |
| A50-U64 | 0.13 | 8.1 ± 1.3 | -10.2 ± 0.17 | 3 |
| G50-C64 | 0.19 | 6.6 ± 1.1 | -10.3 ± 0.17 | 3 |
| C50-G64 | 0.34 | 4.1 ± 1.2 | -10.6 ± 0.28 | 3 |
| G50-U64 | 0.11 | 106 ± 3.1 | -8.8 ± 0.03 | 4 |
| U50-G64 | 0.04 | 15.3 ± 1.7 | -9.8 ± 0.11 | 3 |
| C51-G63 | 0.15 | 21.3 ± 0.9 | -9.6 ± 0.04 | 3 |
| A51-U63 | 0.22 | 39.2 ± 1.7 | -9.3 ± 0.04 | 3 |
| U51-A63 | 0.09 | 52.5 ± 2.0 | -9.2 ± 0.04 | 3 |
| G51-U63 | 0.03 | 60.9 ± 1.3 | -9.1 ± 0.02 | 3 |
| U51-G63 | 0.02 | 57.3 ± 4.2 | -9.1 ± 0.07 | 3 |
| A51-C63 | 0.01 | 13.7 ± 0.7 | -9.9 ± 0.05 | 3 |
| A52-U62 | 0.13 | 5.0 ± 0.4 | -10.4 ± 0.08 | 3 |
| G52-C62 | 0.84 | 4.3 ± 0.2 | -10.5 ± 0.06 | 3 |
| A52-C62 | 0.01 | 5.3 ± 1.3 | -10.4 ± 0.25 | 3 |
| Double Mutants | koff (s-1 × 10⁴) | ΔG° (kcal/mol) | N | |
| G50-U64 U51-A63* | 428 ± 41.6 | -8.0 ± 0.10 | 3 | |
| C50-G64 U51-A63 | 61.0 ± 3.4 | -9.1 ± 0.06 | 4 | |
| G49-U65 G50-U64 | 28.6 ± 0.7 | -9.5 ± 0.02 | 3 | |
| G49-U65 C50-G64* | 1.2 ± 0.5 | -11.2 ± 0.40 | 3 | |
| G49-C65 G50-C64 | 4.4 ± 0.4 | -10.5 ± 0.08 | 5 | |
| G49-C65 G50-U64 | 36.2 ± 1.7 | -9.4 ± 0.05 | 5 | |
| G50-C64 A51-U63 | 37.5 ± 3.7 | -9.3 ± 0.10 | 6 | |
| Triple Mutants | koff (s-1 × 10⁴) | ΔG° (kcal/mol) | N | |
| G49-U65 G50-U64 U51-A63 | 102 ± 14.3 | -8.8 ± 0.14 | 3 | |
| G49-U65 C50-G64 U51-A63 | 7.6 ± 1.2 | -10.2 ± 0.16 | 3 | |
| G49-U65 G50-C64 A51-U63 | 10.0 ± 0.7 | -10.0 ± 0.07 | 5 | |
| G49-C65 A50-U64 A51-U63 | 16.8 ± 0.7 | -9.8 ± 0.04 | 5 |
Forty-two mutants of yeast tRNAPhe were prepared by in vitro transcription and were aminoacylated with [3H]-Phe using yeast PheRS, which does not contain identity elements in the A and T helices. Unmodified tRNA transcripts could be used since unmodified tRNAPhe binds just as well as fully modified tRNAPhe 14. Each [3H]-Phe-tRNA was bound to T. thermophilus EF-Tu●GTP, and a ribonuclease protection assay15,16 was used to determine a koff for each mutant in Buffer A at 0°C (Figure 2A). For those mutations where koff was either faster than 0.01 s-1 or slower than 0.0005s-1, koff values were determined at several lower or higher NH4Cl concentrations, and the value at 0.5 M was extrapolated from an ln koff versus ln [NH4Cl] plot (Figure 2B). To calculate Kd values from the koff values, the value of kon for EF-Tu binding to several tRNAPhe mutants was measured using a ribonuclease protection assay. Varying concentrations of EF-Tu●GTP were mixed with 2.5 nM [3H]-Phe-tRNA in Buffer A at 0°C. Reactions were terminated at varying times by addition of RNase A, incubated for an additional 20s, quenched, and filtered. The amount of [3H]-Phe-tRNA bound as a function of time gave a kobs at each EF-Tu concentration (Figure 2C). A plot of kobs versus initial EF-Tu●GTP concentration allowed calculation of kon (Figure 2D). The value of kon was found to be similar for wild-type tRNAPhe and all eight mutants tested. Thus, it was assumed that the average kon value of 0.11 μM-1sec-1 could be used to calculate Kd and ΔG° for all the tRNA mutants (Table I). Errors ranged between ± 0.1 and 0.4 kcal/mol for the calculated ΔG° values.
Figure 2.
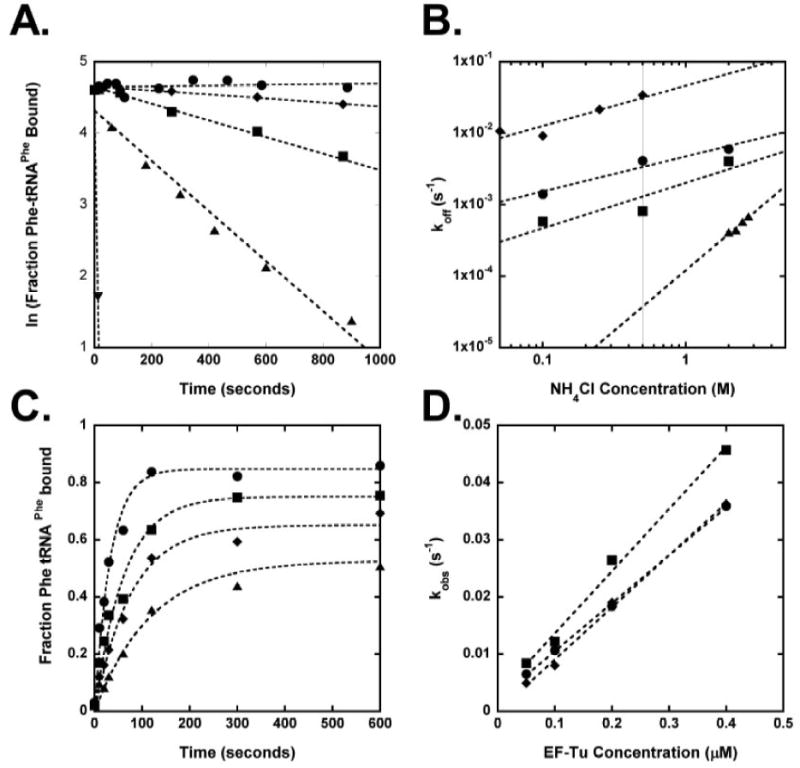
(A.) Measurement of dissociation rates at 0°C in buffer A for: no RNase A (●), Phe-tRNAPhe with (■) and without (▼) EF-Tu●GTP, Phe-tRNAPhe(G49-U65) (◆), and Phe-tRNAPhe(A51-U63) (▲). Average koff values are given in Table I. (B.) NH4Cl concentration dependence of dissociation rates at 0°C for Phe-tRNAPhe (●), Phe-tRNAPhe (G50-U64) (■), Phe-tRNAPhe (G50-U64 U51-A63) (◆), Phe-tRNAPhe (G49-U65 C50-G64) (▲). Interpolated values at 0.5 M NH4Cl (vertical line) are shown in Table I. (C.) Observed rate of association for Phe-tRNAPhe at 0°C in buffer A at: 0.4 μM (●), 0.2 μM (■), 0.1 μM (◆), 0.05 μM (▲) EF-Tu*GTP. (D.) Association rate dependence on EF-Tu concentration at 0°C in buffer A for: Leu-tRNALeuCAG (●), Phe-tRNAPhe A49-U65 (■), Phe-tRNAPhe (◆). Slopes give kon= 0.08, 0.11 and 0.09 μM-1s-1 respectively.
The free energies of binding of the yeast tRNAPhe mutants to EF-Tu are compared graphically in Figure 3. Individual mutation of seven base pairs in the acceptor stem of Phe-tRNAPhe resulted in modest effects on ΔG°. In all seven cases, the range of ΔG° between the mutant and wild-type tested was less than 0.4 kcal/mol, which is only slightly greater than the error of measurement. While this does not eliminate the possibility that EF-Tu can derive some sequence specificity from this region by combining the small effects, to a first approximation the protein interacts with all tRNAs similarly in this part of the molecule. The only exception to this conclusion is the tRNAs which contain certain 1-72 base pairs that were not tested. Indeed, introducing the U1-A72 pair weakens the affinity to E. coli EF-Tu,17 and U1-A72 in tRNAGln is an important determinant in defining the weak binding of tRNAGln to T. thermophilus EF-Tu (L. Behlen, unpublished data).
Figure 3.

Effects of single base pair substitutions in yeast tRNAPhe on ΔG° of binding to T. thermophilus EF-Tu in buffer A at 0°C. The solid horizontal line marks the ΔG° for wild-type tRNAPhe with the sequence given on the x axis, while colored triangles indicate the ΔG° of each mutant at the indicated base pair. Numerical data are shown in Table I.
Mutations in four of the base pairs in the T-stem show substantial differences in their binding affinity to EF-Tu. The range of ΔG° values spans 0.8 kcal/mol for the 49-65 pair, 1.7 kcal/mol for the 50-64 pair, 1.0 kcal/mol for the 51-63 pair, and 0.4 kcal/mol for the 52-62 pair (Figure 3, Table 1). Comparable ΔG° effects were previously observed for a more limited number of mutations of the 49-65 and 51-63 pairs in tRNALeu, tRNAAsn, tRNAAsp, and tRNAPhe.11,12 However, since the U52-A62 pair present in tRNAPhe is rarely found among bacterial tRNAs, it is unlikely that the 52-62 position contributes to EF-Tu binding specificity for most bacterial tRNAs since the AU and GC pairs commonly found at this position have virtually identical ΔG° values. Thus, this comprehensive mutagenesis experiment reveals that only the 49-65, 50-64 and 51-63 base pairs contribute substantially to the aa-tRNA binding specificity. The same three base pairs were previously identified as the primary sites that ensured weak binding of tRNASec to T. thermophilus EF-Tu using minihelix substrates.18
To better understand how different base pairs combine to achieve the cognate ΔG°, all eight combinations of the tightest and weakest of the three specificity base pairs were introduced into tRNAPhe. Since the native tRNAPhe sequence uses the weakest alternative (C-G) at position 49-65, and the tightest (G-C) at position 51-63, two of the eight ΔG° values had already been measured as single base-pair mutations. The ΔG° values for the remaining six tRNAPhe derivatives were determined, and the data for all eight derivatives are shown in Figure 4. It is clear from this experiment that the three base pairs combine to achieve the overall affinity. As a result, it is possible that relatively similar ΔG° values can be obtained by different combinations of base pairs. For example, as shown in Figure 4, a ΔG° of about -9 kcal/mol can be achieved by using each combination of two weak and one strong base pair. It is likely that a ΔG° of -9 kcal/mol could also be achieved by combining three intermediate base pairs. Thus, many different tRNA sequences can be used to obtain an intermediate overall ΔG°.
Figure 4.
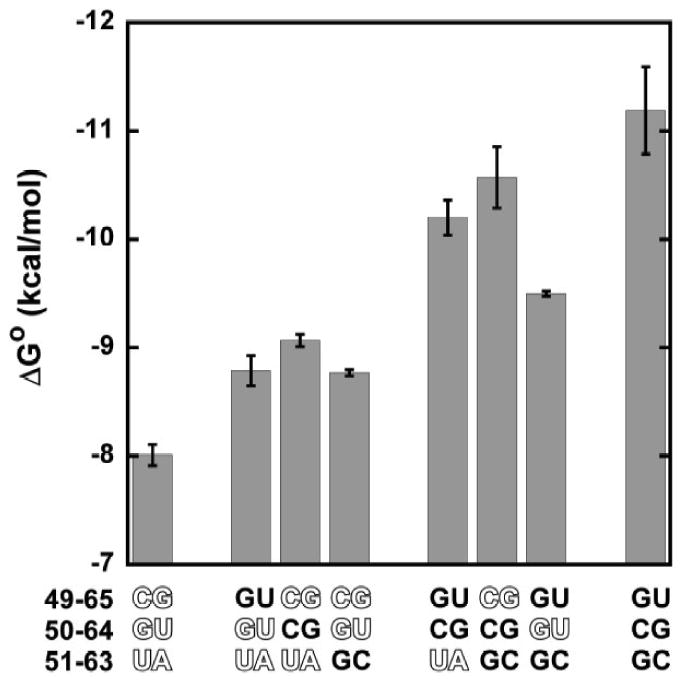
Free energy of binding to T. thermophilus EF-Tu in buffer A at 0°C of different combinations of strong and weak (outlined) base pairs at the three specificity positions inserted into tRNAPhe. Numerical data in Table I.
It is striking that the weakest and tightest tRNAPhe derivatives in Figure 4 differ in ΔG° by -3.2 kcal/mol, which is comparable to the -3.6 kcal/mol range of ΔG° values seen among 19 valylated E. coli tRNAs assayed previously.6 This suggests that the three base pairs identified by tRNAPhe mutagenesis may explain the majority of tRNA sequence specificity observed among the bacterial tRNAs. To test this idea, we selected several tight, moderate, and weak E. coli tRNA bodies identified previously6 and transplanted their base pairs at 49-65, 50-64, and 51-63 into yeast tRNAPhe. The resulting tRNAPhe chimeras with 49-65, 50-64, and 51-63 sequences from tRNAAsp, tRNAGly, tRNALeu, tRNAPro, tRNATyr, tRNATrp, and tRNAGln were phenylalanylated, and values for ΔG° with T. thermophilus EF-Tu were obtained. As shown in Figure 5, the ΔG° values of the tRNAPhe chimeras correlated closely to the ΔG° values obtained previously for the valylated E. coli tRNAs in nearly identical buffer conditions.6 The difference in the absolute value of ΔG° of the two data sets is primarily accounted for by the fact that tRNAs esterified with valine bind EF-Tu more weakly than the same tRNAs esterified with phenylalanine.19,20 However, the slope of the best fit line for the seven data points is 1.4, suggesting that some aspect of the bodies of several of the tRNAs outside of base pairs 49-65, 50-64, and 51-63 may also contribute to the binding affinity.
Figure 5.
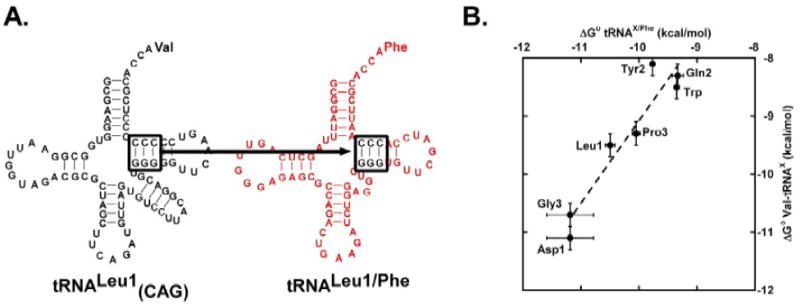
Specificity swap experiment. (A.) Three specificity pairs in tRNALeuCAG were transplanted into tRNAPhe to give tRNALeu/Phe. (B.) Comparison of ΔG° for binding seven Phe-tRNAX/Phe chimeras to T. thermophilus EF-Tu with the ΔG° for Val-tRNAX determined previously 6. The slope of the best fit line is 1.4 with a correlation coefficient of 0.95. Numerical data in Table I.
The availability of ΔG° values for the 11 double or triple base-pair mutations in tRNAPhe presented in Figures 4 and 5 makes it possible to evaluate whether the thermodynamic contributions of the three base pairs are additive. To do this, the positive or negative ΔΔG° values between tRNAPhe and each of the single base-pair mutations were calculated. The ΔG° of a given double or triple mutant could then be predicted by adding the appropriate ΔΔG° values to the ΔG° of tRNAPhe. As shown in Figure 6, the agreement between predicted and measured values is excellent over a wide range of ΔG°. This shows that the thermodynamic contributions of the three base pairs are nearly independent of one another.
Figure 6.
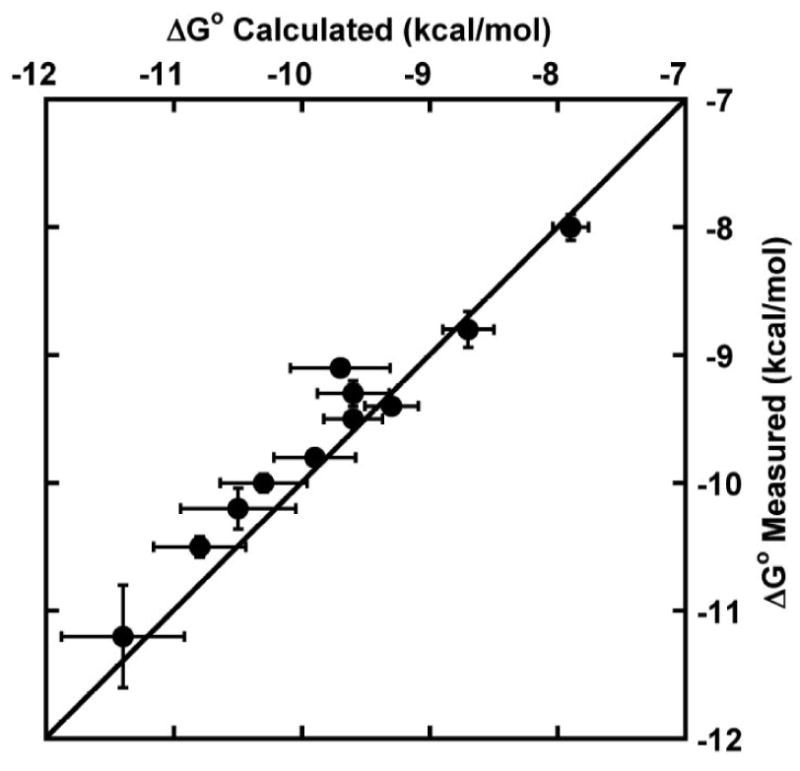
Additivity test. Comparison of measured ΔG° for double and triple base pair mutants of tRNAPhe with the value calculated assuming a linear combination of effects found with single base pair mutations. Line indicates perfect correlation between measured and calculated ΔG°.
While the above experiments support the idea that the three base pairs are the primary specificity determinants in the binding of most aa-tRNAs to EF-Tu, all experiments thus far were performed in the background of yeast tRNAPhe. While this tRNA has an overall “D4V5” architecture that is typical of the majority of bacterial tRNAs,21 it was important to test whether the three specificity base pairs made a similar relative contribution in a different aa-tRNA background. E. coli Leu-tRNALeuCAG was chosen because it has a very different type II architecture with an extended variable loop and lacks aminoacyl tRNA synthetase recognition elements in the T-stem (Figure 7). The presence of different tertiary interactions in the core of tRNALeu 22 can potentially affect either the structure or dynamics of the free tRNA or affect the strength and position of the hydrogen bonds in the bound complex, thereby altering the contributions of the specificity base pairs to the overall binding free energy. The measured affinities of the different Leu-tRNALeuCAG mutants are reported in Table II and are compared to the corresponding Phe-tRNAPhe mutants in Figure 7. In general, the effect of a given mutation at each of the three positions is similar in the two tRNAs; however, it is notable that several mutants do not agree perfectly. For example, both A51-U63 and C50-G64 bind tighter in tRNAPhe than in tRNALeuCAG. Nevertheless, the fact that the effects of mutations in the two tRNA backgrounds are quite similar suggests that any structural and/or dynamic differences between the two tRNAs only minimally affects their interaction with EF-Tu.
Figure 7.
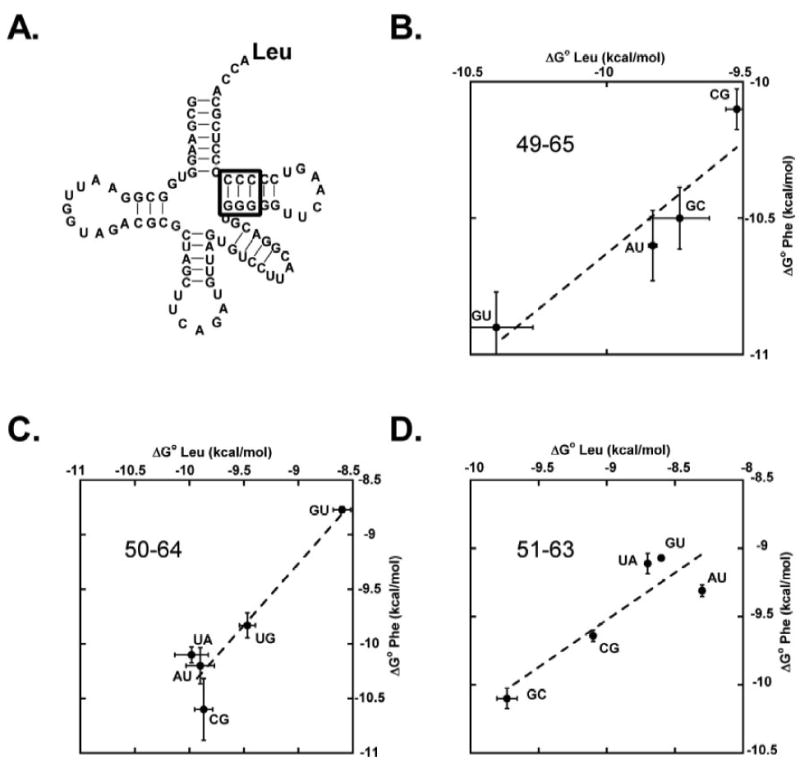
Comparison of ΔG° values for base pair substitutions in Leu-tRNALeuCAG (numerical data in Table II) and Phe-tRNAPhe (numerical data in Table I). (A.) Sequence of E. coli tRNALeuCAG with sites of base pair substitutions indicated. (B.) The 49-65 base pair. Line has a slope of 0.82 and a correlation coefficient of 0.93. (C.) The 50-64 base pair. Line has a slope of 1.1 and a correlation coefficient of 0.94. (D.) The 51-63 base pair. Line has a slope of 0.69 and a correlation coefficient of 0.93.
Table II.
Rates of dissociation (koff) of mutants of Phe-tRNAPhe from T. thermophilus EF-Tu in buffer A at 0°C. Asterisk (*) refers to data from reference 12. N is the number of independent determinations. ΔG° is calculated from koff assuming kon = 0.11 μm-1s-1 (see text). All errors are standard errors.
| Mutation | koff (s-1 × 10⁴) | ΔG° (kcal/mol) | N |
|---|---|---|---|
| WT | 17.9 ± 1.9 | -9.7 ±0.11 | 7 |
| A49-U65 | 14.9 ± 0.2 | -9.8 ± 0.02 | 3 |
| C49-G65 | 26.4 ± 1.1 | -9.5 ± 0.04 | 3 |
| G49-U65 | 5.2 ± 07 | -10.4 ± 0.14 | 3 |
| C50-G64 | 14.0 ± 1.2 | -9.9 ± 0.08 | 4 |
| U50-A64 | 11.4 ± 1.8 | -10.0 ± 0.15 | 4 |
| U50-G64 | 29.2 ± 2.1 | -9.5 ± 0.07 | 3 |
| G50-U64 | 142 ± 11.6 | -8.6 ± 0.08 | 3 |
| A50-U64 | 12.8 ± 1.7 | -9.9 ± 0.13 | 3 |
| C51-G63* | -9.1 | ||
| G51-U63* | -8.6 | ||
| A51-U63* | -8.3 | ||
| U51-A63* | -8.7 |
Because the ΔΔG° values at the three specificity sites were additive, and were quite similar in another tRNA, it is of interest to use the tRNAPhe data to calculate the ΔG° values for all E. coli tRNAs and compare them to those measured previously.6 To do this, the ΔΔG° values for the 49-65, 50-64, and 51-63 base pairs for each E. coli tRNA were added to the ΔG° of tRNAPhe to calculate their overall affinity. In general, since the E. coli tRNAs that bind EF-Tu tightly contain tight binding pairs and the weak binding tRNAs contain weak binding pairs, a reasonably good fit was expected. Indeed, most of the calculated values are close to the affinity of the valylated tRNAs, considering the error of the calculation (Figure 8). This is rather remarkable considering the overall structural differences between the E. coli tRNA bodies. However, tRNAGluUUC, tRNAMetM, tRNATyrGUA, and tRNAIleGAU were rather far (>0.8 kcal/mol) outside of their calculated values. Such a lack of fit could be due to many factors. First, as shown above for tRNALeuCAG, the ΔΔG° of a given pair determined in tRNAPhe may not be the same in other tRNAs. This may be due to either slightly different complex structures or differences in structure or dynamics of the free tRNAs. Support for this possibility includes the observation that Ala mutations in Arg 274 and Thr 332, which contact the tRNA in invariant positions, contribute different amounts in different tRNAs.10 Secondly, the small ΔΔG° values observed at several sites in the acceptor stem could combine to slightly alter the overall affinity of certain tRNAs. Finally, it is possible that the extrapolated data for certain tRNAX or tRNAPhe mutants may be incorrect. For example, extrapolation of data obtained at much higher or lower NH4Cl concentrations may not accurately give the correct value of ΔG° at 0.5 M NH4Cl. Considering the many potential sources of error, the fit of calculated and experimental data in Figure 8 is quite good.
Figure 8.
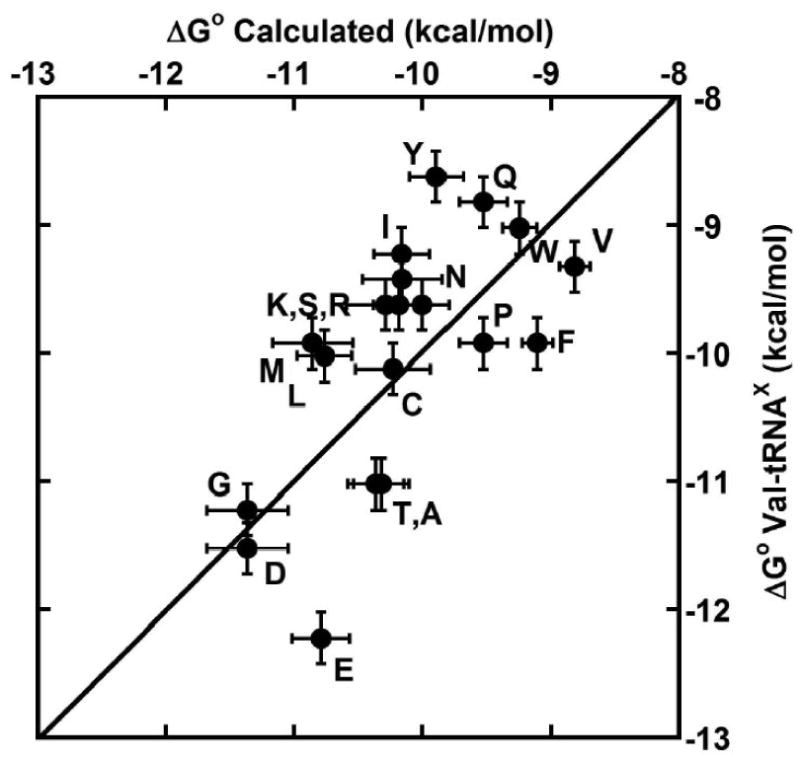
Comparison of previously measured ΔG° of Val-tRNAX 6 with the calculated ΔG° of the tRNA based on the ΔΔG° values of the 49-65, 50-64, and 51-63 base pairs determined from single base pair mutations. tRNAs are labeled with the one letter code.
Discussion
Based on 53 mutations in yeast tRNAPhe and 12 in E. coli tRNALeu, we have identified three base pairs in the T-stem of tRNA that modulate the affinity of tRNA to T. thermophilus EF-Tu in a sequence-specific manner. The data support and extend previous more limited tRNA and minihelix mutagenesis experiments11,12,18,23 and molecular dynamics/bioinformatics analysis24 that identified the same region. Other base pairs that contact EF-Tu do not contribute significantly to the sequence specificity, although there is evidence that certain mutations in the 1-72 base pair that were not tested here also have an effect.23; 25 Nevertheless, the three base pairs in the T-stem quantitatively account for the characteristic affinity of most bacterial tRNAs to EF-Tu. Transplanting the three specificity base pairs from several E. coli tRNAs into yeast tRNAPhe successfully converts tRNAPhe into a molecule that has a binding affinity similar to the donor tRNA. Analysis of the free energy of binding for several double and triple base-pair substitutions suggests that the contribution of each base pair is thermodynamically independent. As a result, it was possible to use the single base-pair substitution data to predict the affinities of many bacterial tRNAs with reasonable accuracy.
The tRNA mutagenesis data presented here agree very well with experiments examining the effects of EF-Tu mutations on the specificity of tRNA binding.10 Single Ala substitutions for amino acids in the tRNA binding cleft of T. thermophilus EF-Tu were tested for their ability to bind four tRNA bodies with different intrinsic affinities. Five “specificity” amino acids were identified that differentially affected ΔG° of binding to the four tRNAs. Two of the amino acids (Thr 332 and Arg 274) contact tRNA backbone functional groups (phosphate oxygens at C75 and G53) at the edges of the EF-Tu binding site that are conserved in all tRNAs and therefore must confer specificity indirectly. However, it is striking that three of the five “specificity” amino acids - Glu 390, Gln 341 and Thr 350 - interact with functional groups of the three “specificity” base pairs identified in this work. Glu 390 interacts with an amino group of G when present in the minor groove of the 51-63 base pair, while Gln 341 and Thr 350 interact with 2′ hydroxyl groups of the ribose at 64 and 65, respectively.7 This agreement between the EF-Tu and tRNA mutagenesis data strongly supports the conclusion that the major part of the EF-Tu●tRNA interface responsible for sequence specificity has been identified.
The observation that the thermodynamic contributions of the three specificity base pairs were nearly independent of each other was surprising considering that they are adjacent to one another. Since the precise position of the base and backbone functional groups of a base pair in an RNA helix depends upon the identity of its neighboring pairs,26 one would expect that the contribution of a protein contact to the binding free energy would be sensitive to the identity of neighboring pairs, and hence not be the same in all sequence contexts. Furthermore, examination of the structural details of the EF-Tu●tRNAPhe complex reveals that while Glu 390 interacts with the 51-63 pair independently of other amino acids, Gln 341 and Thr 350 form a hydrogen bond with one another as well as with the 2′ hydroxyls 49-65 and 50-64 base pairs. Therefore, it is rather unexpected that sequence changes can modulate the strength of the 49-65 contact independently of the 50-64 contact. It would be valuable to obtain the structures of EF-Tu complexes with different T-stem sequences to further understand this surprising absence of neighbor effects.
It is now possible to understand the total free energy of binding of T. thermophilus EF-Tu with a given aa-tRNA, ΔG°(total), in terms of five thermodynamic contributions that are reasonably independent. First, there is a basal binding free energy, ΔG°(tRNA) of about -8.0 kcal/mol associated with the aa-tRNA body that reflects the majority of the stabilizing contacts with the protein but is approximately the same for all aa-tRNAs. The contacts occur throughout the interface between the tRNA and EF-Tu, including the 5′ phosphate, the CCA terminus, part of the acceptor helix, and part of the T hairpin. ΔG°(tRNA) also includes several stabilizing contacts with the amino group of the esterified amino acid. The second contribution, ΔG°(a.a.), is due to the side chain of the esterified amino acid that was deduced directly by comparing misacylated tRNAPhe species5 or indirectly by comparing tRNAs acylated with their cognate amino acid and with Val19. The values of ΔG°(a.a.) are the result of idiosyncratic interactions made with the large amino acid pocket in EF-Tu and vary by 2.5 kcal/mol5. The final three contributions to ΔG°(total) are from the three T-stem base pairs studied in this work: ΔG°(49-65), ΔG°(50-64), and ΔG°(51-63). Each of the terms depends strongly on the sequence of the pair, but the three can contribute up to a total of -3.6 kcal/mol, which is approximately the same as the range of free energies observed among E. coli tRNA bodies6. This range of free energies also approximates the range observed for ΔG°(a.a.), and as discussed previously, evolution has adjusted the sequences of natural tRNAs such that the differences in ΔG°(total) for natural, correctly esterified aa-tRNAs are quite small.3,19 It is likely that the above dissection of ΔG°(total) into five independent components is an oversimplification that ignores the cooperative structural and dynamic effects of both the free and bound components. However, as shown in Figure 8 and in reference 19, the model is a useful tool to approximately calculate ΔG°(total) for different tRNA sequences esterified with various amino acids.
T-stem sequences present in E. coli tRNAs vary considerably. As would be expected, the tight binding tRNA bodies such as tRNAAsp or tRNAGly use the most strongly stabilizing base pairs at all three positions, while weak binding tRNAs such as tRNAGln and tRNATrp use the corresponding weakest alternatives. More interesting are the tRNA bodies with intermediate affinity which often use quite different combinations of the three base pairs to achieve the same binding affinity. Indeed, there are many cases where different isoacceptor tRNAs, which would be expected to have similar values for ΔG°(total), have different sequences in the three critical base pairs. For example, tRNASer5GGA uses G49-C65 G50-C64 G51-C63 in its T-stem and has a calculated ΔG°(total)= -10.8 kcal/mol, while tRNASer1UGA uses C49-G65 A50-U64 G51-C63 to give a similar calculated ΔG°(total)= -10.2 kcal/mol. The fact that a given value of ΔG°(total) can be achieved using so many combinations of base pairs is a distinguishing feature of EF-Tu recognition of tRNA, which presumably reflects its need to interact with all tRNAs with a characteristic affinity.
It is interesting to contrast the tRNA recognition properties of EF-Tu with those of aminoacyl tRNA synthetases which use a limited number of identity nucleotides to ensure that the small number of cognate tRNAs bind tightly and all other non-cognate tRNAs bind with a 103 to 104-fold weaker affinity.27 Thus, both proteins can be considered to be sequence- specific tRNA binding proteins that use a similar number of tRNA residues to elicit a similar range in binding affinities. The major difference is that synthetases must distinguish a limited number of tRNAs from all others while EF-Tu must recognize every tRNA with a certain affinity. In general, tRNA synthetases do not use the three T-stem base pairs for specific recognition, so the two systems could have evolved independently. An interesting exception to this conclusion appears to be tRNAGln, which contains the rare U1-A72 pair that is needed for tight binding by their synthetases28,29 and weak binding by EF-Tu17(L. Behlen, unpublished data).
The rules for T. thermophilus EF-Tu binding to different tRNAs outlined above are likely to be the same for all bacteria. The main specificity residues Glu 390, Gln 341, Thr 350, and Thr 332 are universally conserved, and Arg 274 is highly conserved in bacterial EF-Tu sequences. The T-stem sequences of tRNAs that bind EF-Tu very tightly or very weakly are also highly conserved. For example, the tight binding tRNAAsps contain 95% G51-C63 91% C50-G64 and 90% G49-U65 which are all tight base pairs. Similarly, the weak binding tRNAGlns 6 contain 92% A51-U63 or U51-A63, 28% G50-U64 or U50-G64, and 91% G49-C65 or C49-G65, which are all weak base pairs. In contrast, tRNAs with intermediate binding affinity often show a wider variety of sequences in the T-stem. For example, bacterial tRNALyss, which show intermediate affinity to EF-Tu 6, have variable T-stems that contain varying combinations of tight, weak, and intermediate base pairs with no pair present greater than 48% of the time at any of the three sites. There are a few interesting examples of tRNAs whose T-stem sequences are predicted to be very different from other members of their acceptor families. For example, a tRNAGlu from H. pylori has G49-C65 G50-U64 A51-U63, which is much weaker than most bacterial tRNAGlu. Also, tRNAAsn from B. Japonicum has G49-C65 C50-G64 G51-C63, which is predicted to bind EF-Tu much more tightly than all other tRNAAsns. It is possible that these two tRNAs are related to the transamidation pathway present in those organisms that is used to produce Gln-tRNAGln and Asn-tRNAAsn 30.
The conserved mechanism of tRNA specificity for bacterial EF-Tus does not extend to eukaryal and archaeal EF-Tus. Since Glu 390 in bacteria is an Asp in eukaryal and archaeal EF-Tus, it is possible that a similar recognition contact may occur. However, the remaining recognition residues Gln 341, Thr 350, Arg 274, and Thr 332 are quite variable in eukaryotes and archae. Furthermore, eukaryotic tRNAAsps, tRNAGlus, and tRNAGlys sequences do not have the tight binding G49-U65 present in bacteria, but usually contain the weaker C49-G65. Conversely, in eukaryotes, many tRNATrps, which bind weakly in E. coli, contain the tight binding G49-U65 C50-G64 G51-C63. This suggests that the eukaryal and archaeal EF-Tus either recognize tRNAs in a slightly different manner or a specific interaction does not occur.
It is not known whether the selective pressure for the evolution of uniform binding of aa-tRNAs is solely to form the initial complex with EF-Tu. It is possible that the interactions of EF-Tu with aa-tRNA on the ribosome also played an important role in the evolution of the interface. On the ribosome, EF-Tu●GTP●aa-tRNA is rapidly bound to the A/T site, and upon correct codon-anticodon interaction, a signal is sent from the decoding center to EF-Tu to hydrolyze GTP and release the aa-tRNA into the A site.2 It could be that a precise affinity of aa-tRNA for EF-Tu is essential for the correct rates of GTP hydrolysis or release from EF-Tu●GDP. For example, if the EF-Tu●tRNA interaction were too tight, dissociation of the complex could limit the rate of peptide bond formation. It will thus be interesting to evaluate the properties of tRNA mutations that either weaken or strengthen EF-Tu binding on the rates of GTP hydrolysis and peptide bond formation.
Materials and Methods
Expression and purification of T. thermophilus EF-Tu was performed as described previously. 9 Formation of the EF-Tu●GTP complex and determination of the fraction of the complex capable of binding aa-tRNA were determined as previously described.9 Double-stranded DNA templates for T7 transcription of tRNAs were prepared by annealing two oligonucleotides (Integrated DNA Technologies) with at least 20 base pairs of overlap and extending with Taq DNA polymerase. In vitro transcription was performed as described previously,12 except in the synthesis of the A start transcript where 12.5 mM AMP was used to prime the transcription instead of GMP. The transcripts were purified on a 10% denaturing polyacrylamide gel. The tRNAs were aminoacylated with purified yeast PheRS or E. coli LeuRS and [3H]phenylalanine (123 Ci/mmol) or [3H]leucine (160 Ci/mmol) (Amersham) as described previously.5
The dissociation rate (koff) constants of [3H]-aa-tRNAs from EF-Tu●GTP were determined as previously described 9 at 0°C in buffer A (50 mM Hepes pH 7.0, 20 mM MgCl2, 0.5 M NH4Cl, 5 mM DTT, 20 μM GTP, 3 mM Phosphoenolpyruvate, and 50 μg/mL pyruvate kinase). For those tRNAs where koff was either faster than 0.01 s-1 or slower than 0.0005s-1, koff values were determined at several lower or higher NH4Cl concentrations, and the value at 0.5 M was extrapolated from an ln koff versus ln [NH4Cl] plot.4
The association rate constants (kon) for aa-tRNAs to EF-Tu●GTP were determined using a ribonuclease protection assay in buffer A at 0°C. After activation to form EF-Tu●GTP, the protein was serially diluted in buffer A to concentrations ranging from 100 nM to 800 nM. To initiate the binding reaction, a 25 μL aliquot of protein was mixed with 25 μL of 2.5nM [3H]-aa-tRNA and subsequently quenched at multiple time points by the addition of 10 μL of 1mg/mL RNase A. This concentration of RNase digests free aa-tRNA within 20 seconds, but the ternary complex that formed during the initial incubation was stable and resistant to digestion. After the incubation with RNase, 150 μL of 10% (w/v) trichloroacetic acid (TCA) with 0.1 mg/mL unfractionated yeast tRNA (Sigma Aldrich) was added, filtered over a nitrocellulose membrane presoaked in 5% TCA and washed three times with 100 μL ice cold TCA. The dried filters were quantified using a Molecular Dynamics Storm Phosphoimager and ImageQuant software (Amersham Biosciences). The amount of [3H]-aa-tRNA bound to EF-Tu as a function of time was fitted with a single exponential yielding a kobs for each EF-Tu concentration (Figure 2). The association rate constants were determined using the slopes of kobs versus concentration of EF-Tu (Figure 2d). All measurements were done in triplicate. Control experiments in the absence of EF-Tu showed that RNase A digested >95% of aa-tRNA within 15 seconds.
Footnotes
This work was funded by National Institutes of Health Grant GM037552 (to O.C.U.)
Publisher's Disclaimer: This is a PDF file of an unedited manuscript that has been accepted for publication. As a service to our customers we are providing this early version of the manuscript. The manuscript will undergo copyediting, typesetting, and review of the resulting proof before it is published in its final citable form. Please note that during the production process errors may be discovered which could affect the content, and all legal disclaimers that apply to the journal pertain.
References
- 1.Krab IM, Parmeggiani A. EF-Tu, a GTPase odyssey. Biochim Biophys Acta. 1998;1443:1–22. doi: 10.1016/s0167-4781(98)00169-9. [DOI] [PubMed] [Google Scholar]
- 2.Pape T, Wintermeyer W, Rodnina MV. Complete kinetic mechanism of elongation factor Tu-dependent binding of aminoacyl-tRNA to the A site of the E. coli ribosome. EMBO J. 1998;17:7490–7. doi: 10.1093/emboj/17.24.7490. [DOI] [PMC free article] [PubMed] [Google Scholar]
- 3.Louie A, Ribeiro NS, Reid BR, Jurnak F. Relative affinities of all Escherichia coli aminoacyl-tRNAs for elongation factor Tu-GTP. J Biol Chem. 1984;259:5010–6. [PubMed] [Google Scholar]
- 4.LaRiviere FJ, Wolfson AD, Uhlenbeck OC. Uniform binding of aminoacyl-tRNAs to elongation factor Tu by thermodynamic compensation. Science. 2001;294:165–8. doi: 10.1126/science.1064242. [DOI] [PubMed] [Google Scholar]
- 5.Dale T, Sanderson LE, Uhlenbeck OC. The affinity of elongation factor Tu for an aminoacyl-tRNA is modulated by the esterified amino acid. Biochemistry. 2004;43:6159–66. doi: 10.1021/bi036290o. [DOI] [PubMed] [Google Scholar]
- 6.Asahara H, Uhlenbeck OC. The tRNA specificity of Thermus thermophilus EF-Tu. Proc Natl Acad Sci USA. 2002;99:3499–504. doi: 10.1073/pnas.052028599. [DOI] [PMC free article] [PubMed] [Google Scholar]
- 7.Nissen P, Kjeldgaard M, Thirup S, Polekhina G, Reshetnikova L, Clark BF, Nyborg J. Crystal structure of the ternary complex of Phe-tRNAPhe, EF-Tu, and a GTP analog. Science. 1995;270:1464–72. doi: 10.1126/science.270.5241.1464. [DOI] [PubMed] [Google Scholar]
- 8.Nissen P, Thirup S, Kjeldgaard M, Nyborg J. The crystal structure of Cys-tRNACys-EF-Tu-GDPNP reveals general and specific features in the ternary complex and in tRNA. Structure. 1999;7:143–56. doi: 10.1016/s0969-2126(99)80021-5. [DOI] [PubMed] [Google Scholar]
- 9.Sanderson LE, Uhlenbeck OC. Directed Mutagenesis Identifies Amino Acid Residues Involved in Elongation Factor Tu Binding to yeast Phe-tRNA(Phe) J Mol Biol. 2007;368:119–30. doi: 10.1016/j.jmb.2007.01.075. [DOI] [PMC free article] [PubMed] [Google Scholar]
- 10.Sanderson LE, Uhlenbeck OC. Exploring the specificity of bacterial elongation factor Tu for different tRNAs. Biochemistry. 2007;46:6194–200. doi: 10.1021/bi602548v. [DOI] [PubMed] [Google Scholar]
- 11.Roy H, Becker HD, Mazauric MH, Kern D. Structural elements defining elongation factor Tu mediated suppression of codon ambiguity. Nucl Acids Res. 2007;35:3420–30. doi: 10.1093/nar/gkm211. [DOI] [PMC free article] [PubMed] [Google Scholar]
- 12.Sanderson LE, Uhlenbeck OC. The 51-63 base pair of tRNA confers specificity for binding by EF-Tu. RNA. 2007;13:835–40. doi: 10.1261/rna.485307. [DOI] [PMC free article] [PubMed] [Google Scholar]
- 13.Romby P, Carbon P, Westhof E, Ehresmann C, Ebel JP, Ehresmann B, Giege R. Importance of conserved residues for the conformation of the T-loop in tRNAs. J Biomol Struct Dyn. 1987;5:669–87. doi: 10.1080/07391102.1987.10506419. [DOI] [PubMed] [Google Scholar]
- 14.Harrington KM, Nazarenko IA, Dix DB, Thompson RC, Uhlenbeck OC. In vitro analysis of translational rate and accuracy with an unmodified tRNA. Biochemistry. 1993;32:7617–22. doi: 10.1021/bi00081a003. [DOI] [PubMed] [Google Scholar]
- 15.Pleiss JA, Uhlenbeck OC. Identification of thermodynamically relevant interactions between EF-Tu and backbone elements of tRNA. J Mol Biol. 2001;308:895–905. doi: 10.1006/jmbi.2001.4612. [DOI] [PubMed] [Google Scholar]
- 16.Vorstenbosch EL, Potapov AP, de Graaf JM, Kraal B. The effect of mutations in EF-Tu on its affinity for tRNA as measured by two novel and independent methods of general applicability. J Biochem Biophys Methods. 2000;42:1–14. doi: 10.1016/s0165-022x(99)00032-9. [DOI] [PubMed] [Google Scholar]
- 17.Seong BL, RajBhandary UL. Mutants of Escherichia coli formylmethionine tRNA: a single base change enables initiator tRNA to act as an elongator in vitro. Proc Natl Acad Sci USA. 1987;84:8859–63. doi: 10.1073/pnas.84.24.8859. [DOI] [PMC free article] [PubMed] [Google Scholar]
- 18.Rudinger J, Hillenbrandt R, Sprinzl M, Giege R. Antideterminants present in minihelix(Sec) hinder its recognition by prokaryotic elongation factor Tu. EMBO J. 1996;15:650–7. [PMC free article] [PubMed] [Google Scholar]
- 19.Asahara H, Uhlenbeck OC. Predicting the binding affinities of misacylated tRNAs for Thermus thermophilus EF-Tu. GTP Biochemistry. 2005;44:11254–61. doi: 10.1021/bi050204y. [DOI] [PubMed] [Google Scholar]
- 20.Dale T, Uhlenbeck OC. Binding of misacylated tRNAs to the ribosomal A site. RNA. 2005;11:1610–5. doi: 10.1261/rna.2130505. [DOI] [PMC free article] [PubMed] [Google Scholar]
- 21.Kim SH, Sussman JL, Suddath FL, Quigley GJ, McPherson A, Wang AH, Seeman NC, Rich A. The general structure of transfer RNA molecules. Proc Natl Acad Sci USA. 1974;71:4970–4. doi: 10.1073/pnas.71.12.4970. [DOI] [PMC free article] [PubMed] [Google Scholar]
- 22.Tukalo M, Yaremchuk A, Fukunaga R, Yokoyama S, Cusack S. The crystal structure of leucyl-tRNA synthetase complexed with tRNALeu in the post-transfer-editing conformation. Nat Struct Mol Biol. 2005;12:923–30. doi: 10.1038/nsmb986. [DOI] [PubMed] [Google Scholar]
- 23.Stortchevoi A, Varshney U, RajBhandary UL. Common location of determinants in initiator transfer RNAs for initiator-elongator discrimination in bacteria and in eukaryotes. J Biol Chem. 2003;278:17672–9. doi: 10.1074/jbc.M212890200. [DOI] [PubMed] [Google Scholar]
- 24.Eargle J, Black AA, Sethi A, Trabuco LG, Luthey-Schulten Z. Dynamics of Recognition between tRNA and elongation factor Tu. J Mol Biol. 2008;377:1382–405. doi: 10.1016/j.jmb.2008.01.073. [DOI] [PMC free article] [PubMed] [Google Scholar]
- 25.Fischer W, Doi T, Ikehara M, Ohtsuka E, Sprinzl M. Interaction of methionine-specific tRNAs from Escherichia coli with immobilized elongation factor Tu. FEBS Lett. 1985;192:151–4. doi: 10.1016/0014-5793(85)80062-4. [DOI] [PubMed] [Google Scholar]
- 26.Xin Y, Olson WK. BPS: a database of RNA base-pair structures. Nucl Acids Res. 2008 doi: 10.1093/nar/gkn676. Advance Access published October 9, 2008. [DOI] [PMC free article] [PubMed] [Google Scholar]
- 27.Schulman LH. Recognition of tRNAs by aminoacyl-tRNA synthetases. Prog Nucleic Acid Res Mol Bio l. 1991;41:23–87. [PubMed] [Google Scholar]
- 28.Jahn M, Rogers MJ, Soll D. Anticodon and acceptor stem nucleotides in tRNA(Gln) are major recognition elements for E. coli glutaminyl-tRNA synthetase. Nature. 1991;352:258–60. doi: 10.1038/352258a0. [DOI] [PubMed] [Google Scholar]
- 29.Rould MA, Perona JJ, Soll D, Steitz TA. Structure of E. coli glutaminyl-tRNA synthetase complexed with tRNA(Gln) and ATP at 2.8 A resolution. Science. 1989;246:1135–42. doi: 10.1126/science.2479982. [DOI] [PubMed] [Google Scholar]
- 30.Cathopoulis TJ, Chuawong P, Hendrickson TL. Conserved discrimination against misacylated tRNAs by two mesophilic elongation factor Tu orthologs. Biochemistry. 2008;47:7610–6. doi: 10.1021/bi800369q. [DOI] [PMC free article] [PubMed] [Google Scholar]